
Mixed Driven Refinement Design of Multidimensional Models based on
Agglomerative Hierarchical Clustering
Lucile Sautot
1,2
, Sandro Bimonte
3
, Ludovic Journaux
4
and Bruno Faivre
1
1
Biog
´
eosciences Laboratory, University of Burgundy, 6 boulevard Gabriel, Dijon, France
2
AgroParisTech, 19 rue du Main, Paris, France
3
IRSTEA Centre de Clermont-Ferrand, 9 avenue Blaise Pascal, Aubi
`
ere, France
4
LE2I, University of Burgundy, all
´
e Alain Savary, Dijon, France
Keywords:
Multidimensional Design, Data Warehouse, OLAP, Data Mining.
Abstract:
Data warehouses (DW) and OLAP systems are business intelligence technologies allowing the on-line anal-
ysis of huge volume of data according to users’ needs. The success of DW projects essentially depends on
the design phase where functional requirements meet data sources (mixed design methodology) (Phipps and
Davis, 2002). However, when dealing with complex applications existing design methodologies seem inef-
ficient since decision-makers define functional requirements that cannot be deduced from data sources (data
driven approach) and/or they have not sufficient application domain knowledge (user driven approach) (Sautot
et al., 2014b). Therefore, in this paper we propose a new mixed refinement design methodology where the
classical data-driven approach is enhanced with data mining to create new dimensions hierarchies. A tool
implementing our approach is also presented to validate our theoretical proposal.
1 INTRODUCTION
Data warehouses (DW) and OLAP systems are busi-
ness intelligence technologies allowing the on-line
analysis of huge volume of data. Warehoused data
is organized according to the multidimensional model
that defines the concepts of dimensions and facts. Di-
mensions represent analysis axes and they are orga-
nized in hierarchies. Facts are the analysis subjects
and they are described by numerical indicators called
measures. Warehoused data are then explored and ag-
gregated using OLAP operators (e.g. Roll-up, Slice,
etc.) (Kimball, 1996).
The success of DW projects essentially depends
on the design phase where functional requirements
meet data sources (Phipps and Davis, 2002). Three
main methodologies have been developed: user-
driven, datadriven and mixed (Romero and Abello,
2009). User-driven approach puts decision-makers at
the center of the design phase by providing them tools
to define the multidimensional model exclusively ac-
cording to their analysis needs. Usually, data driven
methodology proposals deduce the multidimensional
model from structured and semistructured (Mahboubi
et al., 2009; Jensen et al., 2004) data sources exploit-
ing metadata (e.g. foreign keys) and some empirical
values. Finally, mixed approaches fusion the two pre-
vious described methods.
Hierarchies are crucial structures in DW since
they allow aggregation of measures in order to pro-
vide a global and general analytic view of warehoused
data. For that reasons, some works investigate defini-
tion of hierarchies by means of Data Mining (DM)
algorithms (Favre et al., 2006; Sautot et al., 2014b).
However, this design step is applied once the multi-
dimensional model has been defined, and it takes into
account only members of one dimension.
From our point of view, these methodologies
present an important limitation since in real DW
projects often those DM algorithms need data of dif-
ferent dimensions and facts. Thus, in this paper we
present a framework for a mixed design of multidi-
mensional models by integrating DM algorithms in
a classical data driven-approach. This allows defin-
ing hierarchical structures, according to decisional
users’ requirements, that cannot be deduced by clas-
sical datadriven methods. This hierarchical organi-
zation of dimensional data is translated in a complex
multi-factual multidimensional model in order to rep-
resent as well as possible semantic of data sources.
547
Sautot L., Bimonte S., Journaux L. and Faivre B..
Mixed Driven Refinement Design of Multidimensional Models based on Agglomerative Hierarchical Clustering.
DOI: 10.5220/0005404605470555
In Proceedings of the 17th International Conference on Enterprise Information Systems (ICEIS-2015), pages 547-555
ISBN: 978-989-758-096-3
Copyright
c
2015 SCITEPRESS (Science and Technology Publications, Lda.)

The paper is organized in the following way: Sec-
tion 2 introduces related work; a retail case study and
the motivation are presented in Section 3; our design
method is detailed in Section 4 and its implementation
is shown on Section 5.
2 RELATED WORK
Three types of approaches can be used to design a
data warehouse: (i) Methods based on user specifi-
cations, or demand-driven approaches; (ii) Methods
based on available data, or data-driven approaches;
(iii) Mixed methods, or hybrid approaches. For ex-
ample, (Jovanovic et al., 2012) is an iterative demand-
driven method where at each iteration, the system
searches for the best data corresponding with the in-
formation required by the user in terms of dimensions
or facts. Moreover, several other have proposed sys-
tems based on hybrid approach such as (Romero and
Abello, 2010) that propose to express functional re-
quirements using SQL queries.
Relational data driven approaches deduce multi-
dimensional structures (facts and dimensions) from
conceptual (Phipps and Davis, 2002) and/or logical
models (Carme et al., 2010; Jensen et al., 2004). In
particular some works investigate automatic discover-
ing facts using some heuristics (Carme et al., 2010).
About dimensions some works propose using logical
database metadata such as foreign keys (Jensen et al.,
2004) or some heuristics.
Other works use more complex algorithm to iden-
tify dimensions hierarchies. (Nguyen and Tjoa, 2000)
propose a system to dynamically build hierarchies
based on data from Twitter (Nguyen and Tjoa, 2000).
(Messaoud et al., 2004) present a new OLAP opera-
tor named OPAC that allows to aggregate facts that
refer to complex objects, such as images. This op-
erator is based on hierarchical clustering algorithm.
(Favre et al., 2006) provide a framework for automatic
defining hierarchies according to user rules. In order
to personalize the multidimensional schema, (Ben-
tayeb, 2008) propose to create new levels in a hier-
archy with the K-means algorithm. (Leonhardi et al.,
2010) propose to increase the OLAP cube exploration
functionalities by providing the user data mining al-
gorithms to analyze data. (Ceci et al., 2011) use a hi-
erarchical clustering to integrate continuous variables
as dimensions in an OLAP schema. In the same line,
(Sautot et al., 2014b) propose using Agglomerative
Clustering for designing hierarchies, and the integra-
tion in a rapid prototyping methodology is presented
in (Sautot et al., 2014a). However, all existing works
define hierarchies using only either dimensional data
(i.e. attributes of dimension members) or factual data
(i.e. measures) (see Table 1). But, in a constellation
schema, a dimension can be enriched with a hierarchy
created by using other dimensions and facts. It means
that the creation of a new hierarchy can involved a
refinement of facts and dimensions in the entier con-
stellation schema. We detail this issue in the follow-
ing section, using a real application case from bird
biodiversity.
Table 1: Summary of literature review related to automatic
hierarchy building.
Data sources
Star schema Constellation
schema
Facts One di-
mension
Facts and
dimensions
Algorithm
K-means (Bentayeb,
2008)
(Bentayeb,
2008)
Hierarchical
classification
(Ceci
et al.,
2011)
(Sautot
et al.,
2014a)
(Sautot
et al.,
2014b)
(Messaoud
et al.,
2004)
Our proposal
Other (Favre
et al.,
2006)
(Nguyen
and Tjoa,
2000)
(Leonhardi
et al.,
2010)
3 MOTIVATION
In order to describe motivation of our new DW de-
sign methodology we present in this section a real
case study concerning the bird biodiversity analysis
(Sautot et al., 2014b). This dataset has been collected
to analyze spatio-temporal changes in bird popula-
tions along the Loire River (France) and to identify
local and global environmental factors that can ex-
plain these changes. Data sources are stored in a rela-
tional database (PostGIS). Applying the data driven
algorithm proposed in (Romero and Abello, 2010)
we obtain the constellation schema depicted in Fig-
ure 1, which presents two facts as described in the
following. Abundances is one fact, and can be an-
alyzed according to three dimensions (an instance is
shown on Table 3): (i) the species dimension, which
stores species names and attributes, (ii) the time di-
mension, which corresponds to the census years and
ICEIS2015-17thInternationalConferenceonEnterpriseInformationSystems
548
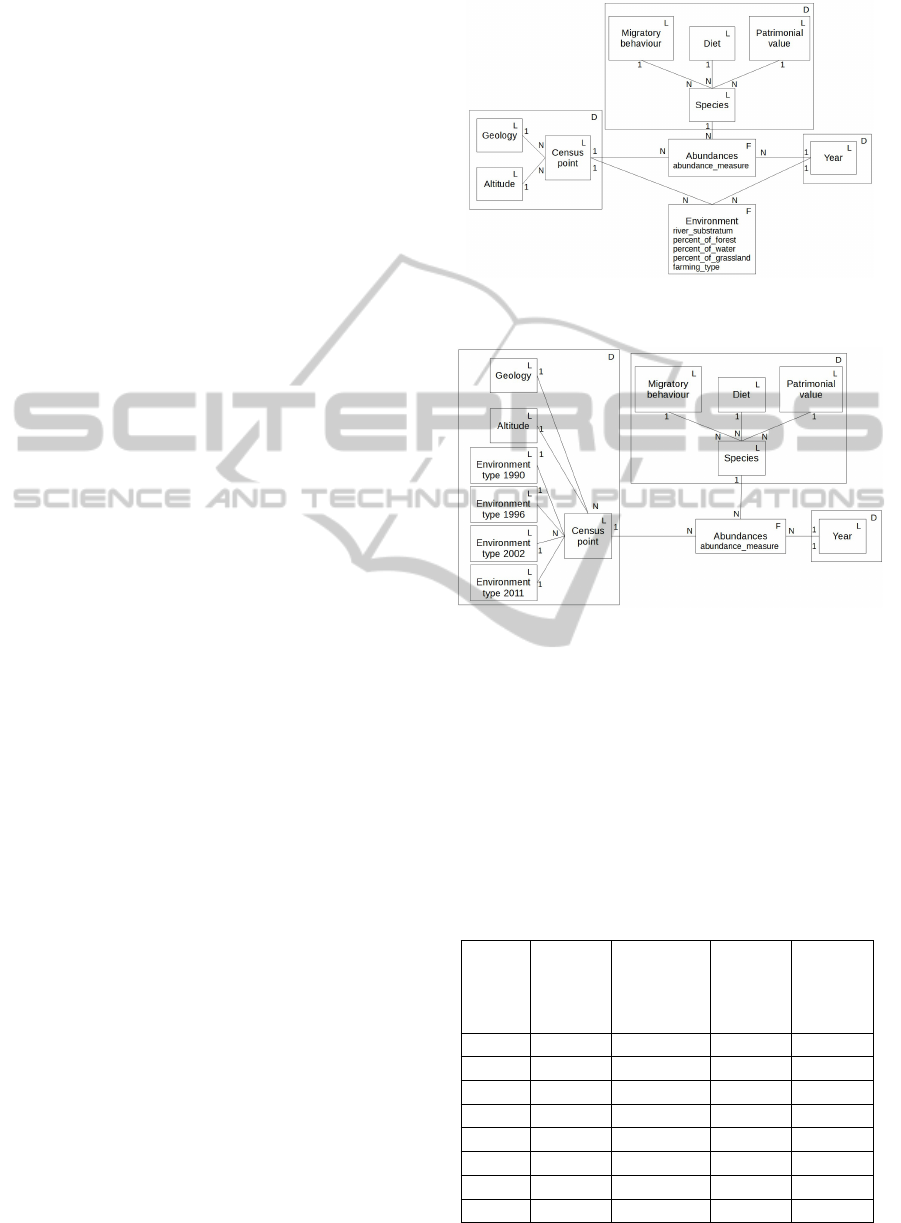
(iii) the spatial dimension, which describes census
points along the river. Using this model decision-
maker can answer to queries like: “What is the total
of birds per year and census point?” or “What is the
total of birds per year and altitude?”. To complete
bird census, the landscape and the river are described
around each census point. Environment descriptions
are represented by another fact, which is associated to
the time dimension and the spatial dimension. With
this model, it is possible to describe census points, for
example a possible OLAP query is “What is the per-
centage of forest per census point in 2012?”.
Note that descriptions of census points that are not
dependent from time, such as altitude and geology,
are used as spatial dimension levels, while other at-
tributes are represented as measures of another fact
(e.g. percentage of forest). Unfortunately, abun-
dances for a specie have not meaning if not related
to environmental data of census points. In this sit-
uation a drill-across operation is not adequate since
it will hide the species dimension. Indeed, with the
drill-across operators facts are joined only on com-
mon dimensions. Moreover, the multidimensional
model of Figure 1 does not make possible to provide
the decision-makers with OLAP queries aggregating
abundance by classes of environmental variable (30%
of forest, 50% of water, etc.), for example “What is
the total of birds per year and group of census point
with 30% of forest?” or “What is the total of birds per
year and group of census point with 50% of water?”,
since environmental parameters do not appear as lev-
els, but as measures, prohibiting group-by queries.
Therefore, in our case study, decision-makers
need for a new design method that group census
points (dimensional data) by environmental parame-
ters (factual data) and year (dimensional data).
The multidimensional model allowing correct
OLAP analysis should be the one shown on Figure 2
(Miquel et al., 2002b). This multidimensional schema
presents only one fact and the spatial dimension is
enriched with some levels representing group of en-
vironmental parameters for each year. Indeed, envi-
ronmental parameters for census points in 2001 can
be different from ones of 2002 implying that the same
census point is not grouped in the same level on two
different years as shown on Table 3.
For example, data describing agricultural activi-
ties around the census points, are available only for
the 2002 census campaign. Therefore, it is important
to take into this different classification when navigat-
ing on the temporal dimension during an OLAP anal-
ysis session. For example, the query “What is the to-
tal of birds in 2002 and in census points with the same
environmental parameters?” has to use the environ-
Figure 1: Bird biodiversity case study: Data-driven constel-
lation schema.
Figure 2: Bird biodiversity case study:manually driven
multi-version schema.
ment type 2002 level, and “What is the total of birds
in 2011 and in census points with the same environ-
mental parameters?” has to use the environment type
2011 level. For example an OLAP query using the en-
vironment type 2002 level and the temporal member
2011 is not coherent since it associates the number of
birds on 2011 in the past geographical-environmental
configuration of 2002, leading to erroneous interpre-
tation.
Table 2: Factual data of “Environments” node.
Years Census
Points
Agencies Percent
of
Forest
Percent
of
Grass-
land
2002 1 LE2I 0.176 0.250
2002 1 ONEMA 0.356 0.261
2002 2 LE2I 0.311 0.420
2002 2 ONEMA 0.255 0.574
2011 1 LE2I 0.189 0.278
2011 1 ONEMA 0.241 0.385
2011 2 LE2I 0.322 0.568
2011 2 ONEMA 0.257 0.575
MixedDrivenRefinementDesignofMultidimensionalModelsbasedonAgglomerativeHierarchicalClustering
549
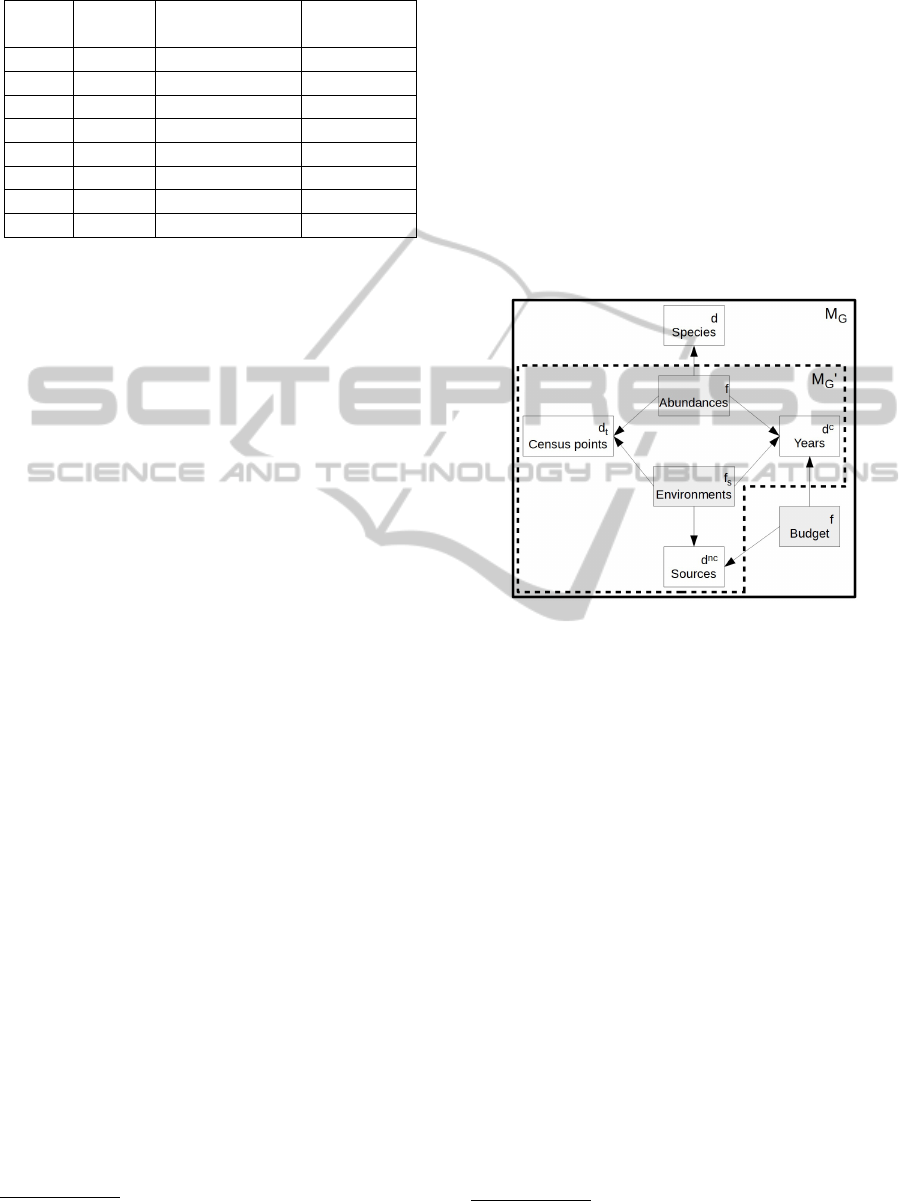
Table 3: Factual data of “Abundances” node.
Years Census
points
Species Abundance
2002 1 Yellowhammer 1.5
2002 1 Coal Tit 0.5
2002 2 Yellowhammer 1.5
2002 2 Coal Tit 0
2011 1 Yellowhammer 1
2011 1 Coal Tit 3
2011 2 Yellowhammer 1
2011 2 Coal Tit 2
4 OUR PROPOSAL
In this section we introduce our framework for the re-
finement of multidimensional in a mixed approach.
The main idea of our proposal is using an existing
data driven methodology in a first step. Then, in our
new design step, we collect user needs about hierar-
chies that are not been deduced in the multidimen-
sional schema by means of the functional dependen-
cies. These users’ needs are expressed in the form
of facts existing in the constellation multidimensional
model. In particular, the main idea is to provide an al-
gorithm that transforms the constellation multidimen-
sional schema by eliminating a fact node and integrat-
ing factual data in an associated dimension used for
creating new levels.
To perform this algorithm, we translate the multi-
dimensional model in a multidimensional graph.
In the following section we describe the multidi-
mensional graph definitions (Section 4.1), the main
algorithm is detailed in Section 4.2 and the calcula-
tion of new versioned hierarchies is explained in Sec-
tion 4.3.
4.1 Preliminaries
In this subsection, we present some preliminary defi-
nitions.
We represent a multidimensional model using a
graph.
Definition 1. Multidimensional Graph.
A multidimensional graph is a directed graph
M
G
=< D, F, A > with:
D =
{
d
1
, ..., d
m
}
, dimensional nodes, which repre-
sent dimensions.
F =
{
f
1
, ..., f
n
}
, fact nodes representing facts.
A =
{
a
1
, ..., a
p
}
| ∀i ∈ [[1, p]], a
i
= ( f
j
, d
k
), with j ∈
[[1, n]] and k ∈ [[1, m]], are arcs
1
, meaning that arcs are
1
In this paper, the notation ( f
i
, d
j
) represents the arc
only directed from a fact node to a dimensional node.
Moreover, M
G
contains no alone node, isolated of
another node, but can contain possibly disconnected
sets of nodes if each sub-graph must contain at least
one fact node.
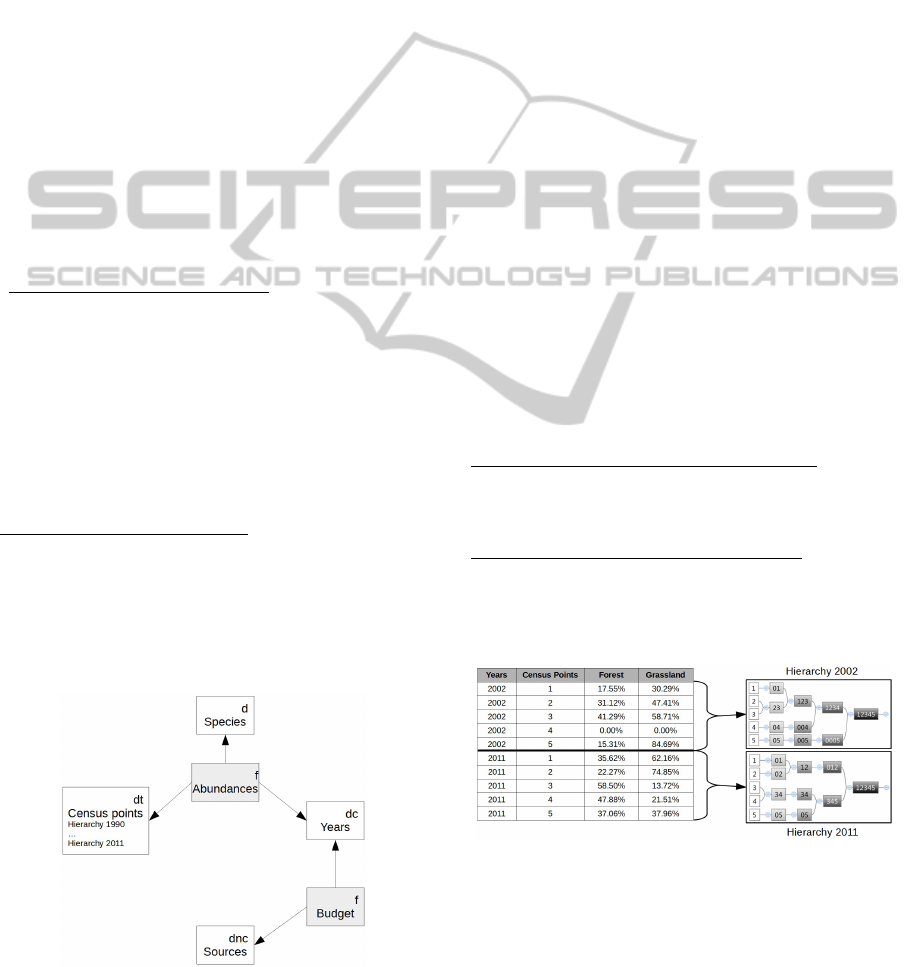
Example. An example of multidimensional graph
is shown on Figure 3. “Species” dimension, “Cen-
sus points” dimension, “Years” dimension, “Abun-
dances” fact and “Environments” fact are described
in previous sections. “Sources” dimension represents
agencies, which collect data. “Budget” fact represents
the funds allowed by each agency for each year to col-
lecting data.
Figure 3: Multidimensional graph M
G
.
In our approach decision-maker want to enrich a
dimension with some new hierarchies using some fac-
tual data. That dimension is called Target dimension
Definition 2. Target Dimension.
The target dimension d
t
of a multidimensional
graph M
G
is a dimension such as:
d
t
∈ D | ∃( f
1
, d
t
), ..., ( f
u
, d
t
) with u ∈ [[2, n]]
This means that dt is associated at least to two
facts since one has to be removed and used to create
its new levels.
Example. An example of possible target dimen-
sion is the “census point” dimension (Figure 3).
Let us now formalize the fact node that is used to
create levels.
Definition 3. Source Node.
The source node of a M
G
with a target dimension
d
t
is a fact node f
s
∈
{
f
1
, ..., f
u
}
.
Example. With “census point” dimension as target
node, an example of possible source node is the fact
node “Environments”.
from fact node f
i
to dimensional node d
j
.
ICEIS2015-17thInternationalConferenceonEnterpriseInformationSystems
550

As we have said before our algorithm removes
the source node from the graph. Therefore, a part of
the structure of the graph is changed. Note that only
nodes related to the source nodes are affected. We
define this sub-graph in the following way
Definition 4. Source-target Multidimensional
Sub-graph.
Let M
G
a multidimensional graph with a target
dimension d
t
and a source node f
s
then the Source-
target multidimensional sub-graph M
0
G
is a multidi-
mensional graph such as: M
0
G
=< D
0
, F
0
, A
0
> with:
F
0
=
{
f
i
∈ F | ∃( f
i
, d
t
)
}
D
0
=
{
d
i
∈ D | ∃( f
s
, d
i
)
}
A
0
=
( f
i
, d
j
) | f
i
∈ F
0
, d
j
∈ D
0
M
0
G
contains thereby only fact nodes linked to d
t
and dimensional nodes linked to f
s
. In M
0
G
, all fact
nodes are so linked to at least one dimensional node
and all dimensional nodes are so linked to at least one
fact node. There is no isolated node in this sub-graph.
M
0
G
is so a well-formed multidimensional graph.
Example. An example of Source-target multidi-
mensional sub-graph using the previous example is
shown on Figure 3.
In order to formalize inputs of the agglomerative
hierarchical clustering algorithm used for the creation
of levels of the target dimension, we formalize factual
data aggregated to a set of dimensions levels using the
definition of instance fact node.
Definition 5. Instance Fact Node.
Let M
G
a multidimensional graph. Let m
i
a mem-
ber of the dimension d
i
. Then the instance fact node
I( f , d
1
.m
1
, ..., d
n
.m
n
) is the set of tuples represent-
ing facts of f aggregated to the dimensions members
d
1
.m
1
, ..., d
n
.m
n
.
Example. Let, Table 2 representing the instance
fact node for the node “Environments”, then Table 4
represents facts aggregated to the All member of the
“Agencies” dimension:
(I(“Environments”, “Agencies.ALL”,
“Years.1990”, “Census points.*”))
2
4.2 Algorithm
In this section we provide details and formalize our
approach.
Removing a fact node from the multidimensional
graph implies its redefinition. Thus, the main idea
is in a first step to work on the source-target mul-
tidimensional graph exclusively, transform this sub-
graph adding levels to the target dimension and re-
moving the source node, and then finally re-integrate
2
‘*’ means ‘all members of the dimension’
the new sub-graph in the rest of original multidimen-
sional graph.
Removing the source node implies to handle its
associated dimensions. It is possible to distinguish
three types of dimensions:
• The target dimension that will rest in the trans-
formed sub-graph,
• the Non Context dimensions D
nc
, and
• the Context dimensions D
c
.
The Non context dimensions D
nc
are dimensions that
are only associated to the source node fact. In order to
remove one dimension it is possible to provide a clas-
sical Dice operator, which consists in aggregating fact
data to the top dimension member. Let us note that
in order to avoid summarazability problems (aggre-
gation cannot be reused) (Lenz and Thalheim, 2009),
in our approach we allow using only distributive and
algebraic aggregation functions for the Dice operator.
Example. An example of Non contextual dimen-
sion is the “Agencies” node. In Table 4 is shown an
example of the Dice operator on the Agencies dimen-
sion, which is a Non contextual dimension.
Table 4: Factual data of “Environments” node aggregated
on “Agencies”.
Years Census
Points
Percent
of
Forest
Percent
of
Grass-
land
2002 1 0.266 0.256
2002 2 0.283 0.497
2011 1 0.215 0.332
2011 2 0.290 0.572
Formally,
Definition 6. Non Contextual Dimension.
Let Source-target multidimensional sub-graph
M
0
G
=< D
0
, F
0
, A
0
>, then the set of non contextual
dimension D
nc
is
D
nc
=
{
d
nc
1
, ..., d
nc
v
}
⊂ D
0
| ∀i ∈ [[1, v]]∃!(d
nc
i
, f
j
) | f
j
∈ F
0
Note that in the previous formula, all dimensional
nodes in D
nc
are only linked to f
s
. Indeed, all dimen-
sional nodes in M
0
G
are linked to f
s
and dimensional
nodes in D
nc
are linked to one (and only one) dimen-
sional node.
The Context dimensions D
c
are dimensions in M
0
G
that are associated to f
s
and another fact node f . With
the future refined graph, users analyze facts in f ac-
cording to d
t
. But, data used for calculating new hier-
archies in d
t
come from f
s
and are thereby dependent
of dimensions in D
c
. Therefore, we need to ensure
MixedDrivenRefinementDesignofMultidimensionalModelsbasedonAgglomerativeHierarchicalClustering
551
that data used to create the hierarchy are coherent with
data consulted by the user during their OLAP analy-
sis. With this in mind, we offer a system that cal-
culates hierarchies according a context, this context
defining with D
c
.
Formally,
Definition 7. Contextual Dimension.
Let Source-target multidimensional sub-graph
M
0
G
, then the set of contextual dimension D
c
is
D
c
⊂ D
0
| D
c
= D
0
− (D
nc
∪ {d
t
})
Example. An example of contextual dimension is
the “Years” node. On Table 3, we present data from
“Abundances” node: data are dependent of “Years”
dimensional node.
Once we have defined non context and contex di-
mensions let us provide our algorithm supposing that
we have only one context dimension.
The input of this algorithm is the multidimen-
sional graph M
G
presented on Figure 3.
Begin of the Refinement Algorithm
1. Identify the Source-target multidimensional sub-graph
M
0
G
.
2. Calculate a hierarchy for each instance of each context.
This part of the algorithm is detailed in particular in the
section 4.3.
3. Remove f
s
from M
G
.
4. Remove isolated nodes. The isolated nodes can be
only dimensional nodes linked to f
s
. Then M
G
is well
formed.
End of the Refinement Algorithm
The output of this algorithm is a multidimensional
graph, presented on Figure 4. We note that f
s
has been
removed and there are new hierarchies in the “census
points” node. Moreover, M
G
remains a well-formed
multidimensional graph and can be also implmented
in a ROLAP architecture.
Figure 4: Refined multidimensional graph M
G
.
4.3 Automatic Creation of Hierarchies
In this section we describe how the is applied to create
new levels of the target dimension.
A complete methodology to create new hierar-
chies in a multidimensional model with Hierarchi-
cal Agglomerative Clustering is presented in (Sautot
et al., 2014b). The main idea of this methodology is
to build a new hierarchy into a dimension by using
data, which describe items at the lowest level of the
hierarchy. In our case, items are census points and
description data are factual data. We suggest to use
the Hierarchical Agglomerative Clustering, due to the
similarity between the output of the Hierarchical Ag-
glomerative Clustering and a hierarchy into an OLAP
dimension (Messaoud et al., 2004).
Main steps of this algorithm are: (1) Calculation
of distances between individuals; (2) Choice of the
two nearest individuals. (3) Aggregation of the two
nearest individuals in a cluster. The cluster is consid-
ered an individual. (4) Go back to the step 1 and loop
while there is more than one individual.
In our approach the clustering (AHC) takes as in-
puts the instance of the source node f
s
evaluated on
each member of the context dimension and dicing it
non context dimensions.
Formally, the step 2 of our algorithm is the
following:
Begin of the Hierarchy Builder Algorithm
for each member
i
of d
c
. create a new hierarchy of d
t
. AHC(I( f
s
,d
nc
1
.ALL,... ,d
nc
v
. ALL, d
c
.member
i
, d
t
.*))
End of the Hierarchy Builder Algorithm
An example is presented on Figure 5. We note that
two hierarchies for the spatial dimension have been
created for years 2002 and 2011.
Figure 5: Contextual hierarchies of census points.
5 VALIDATION AND
EXPERIMENTS
In this section we present the implementation our pro-
ICEIS2015-17thInternationalConferenceonEnterpriseInformationSystems
552
posal. A semantic and performance evaluations are
detailed in Sec 5.1 and 5.2 respectively.
The refinement tool implements our algorithm us-
ing Matlab. It allows defining graph using a simple
visual interface as shown on Figure 7. The consid-
ered multidimensional graph is presented on the top
part of the visual interface. On the bottom one, the
algorithm ask inputs to users in a command window.
5.1 Semantic Evaluation
In this section, we describe the added-value of our
methodology from a design point of view (i.e. does
the refinement methodology corresponds to decision-
makers needs?). For that goal two we have investi-
gated two aspects: 1) Do dimensions and facts cre-
ated using our methodology correspond to decision-
makers analysis needs?; 2) Do hierarchies created us-
ing our methodology improve analysis capabilities?
Therefore have decided to compare the result of
our methodology with with one proposed in (Miquel
et al., 2002a). Indeed, (Miquel et al., 2002a) propose
a manually method to obtain a multi-version multi-
dimensional schema,and when the time dimension is
chosen as the context dimension our approach results
a multi-version multidimensional schema. The re-
sult of this validation shows that the multidimensional
schema produced with the manual methodology and
our automatic methodology are equal.
Moreover, in order to validate the semantic cor-
rectness of using AHC for hierarchies definition, we
have asked to ecologists of the project to choice be-
tween a spatial dimension with only one level, and
a spatial dimension with a hierarchy created using
AHC. When the number of created levels is not supe-
rior to 5, decision-makers prefer having hierarchies,
since they can reveal interesting pattern such as agri-
cultural profiles of census points. For example, data
in the “Environments” fact table contains data that de-
scribe agriculture policies around each census point
at each year. The data clustering according to these
data can classify census points and allows decision-
makers analyzing impact of agricultural practices on
bird biodiversity. For example, decision-makers can
analyze biodiversity according to agricultural forest
and grassland parameters of census points, by using
this simple OLAP query: “What is the biodiversity
value per group of census points (first level of the hi-
erarchy obtained with clustering) in 2002 and 2003?”.
This query can reveal that for the same year, for exam-
ple 2002, biodiversity is very affected by agricultural
parameters since the aggregated biodiversity value for
each group of census point is different.
5.2 Performance Evaluation
In this section, we test time performance of our
methodology in order to validate its feasibility from
a project deployment process point of view.
In particular we study time performance related
to: 1) refinement algorithm for facts and dimension
design, and 2) hierarchy creation using AHC.
In order to test the first point, we have created a
set of 200 simulated constellation schema using from
2 to 100 dimensions, since real usable multidimen-
sional schema presents maximum between 3 and 10
dimensions (Kimball, 1996). Finally, the worst time
execution is 15.23 s. The average execution time is
equal to 11.7 s with a standard deviation equal to 1.17
s. These performances are satisfactory for are good
for an off-line design phase.
In this paragraph, we study time performances of
the AHC algorithm. In this paragraph, “classified
items” are census points (which are members of the
“census points” dimension, the target dimension) and
“attributes” are aggregated facts from the “Environ-
ments” fact node (which is the source fact node). The
AHC algorithm has been also implemented in Mat-
lab and its performance has been also tested. Us-
ing our case study data, we perform 2090 tests, with
a number of classified items (source node instances-
Enverinments facts) between 10 and 190, and a num-
ber of attributes (source node attributes-Enverinments
fact measures) between 10 and 100, and the average
calculation time is equal to 0.072 s, with a standard
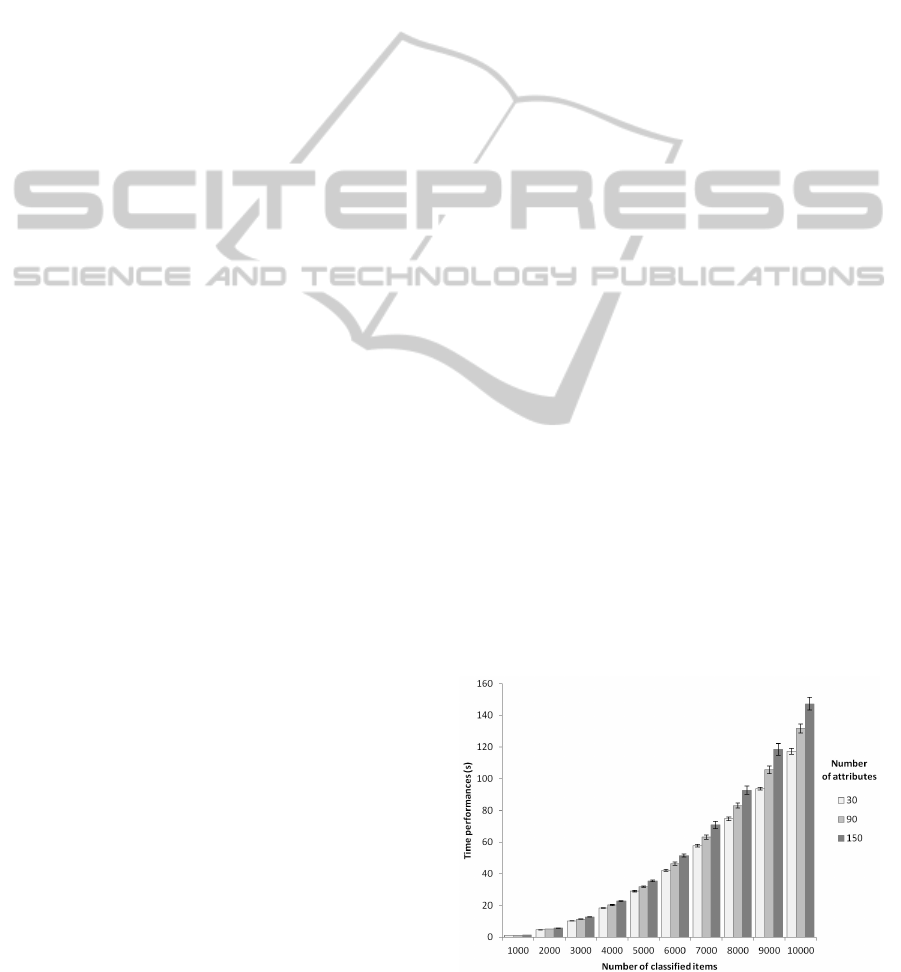
deviation equal to 0.002 s. To complete our evalu-
ation, we simulate a data set with 10,000 classified
items and 150 attributes. In this case, the AHC calcu-
lates a hierarchy in 147.36 s, with a standard deviation
equal to 4.03 , with a maximal calculation time equal
to 214 s. All time performances are shown on Figure
6. This calculation time (approximately four minutes)
is efficient for an off-line design phase.
Figure 6: Execution times according the number of at-
tributes and classified items.
MixedDrivenRefinementDesignofMultidimensionalModelsbasedonAgglomerativeHierarchicalClustering
553
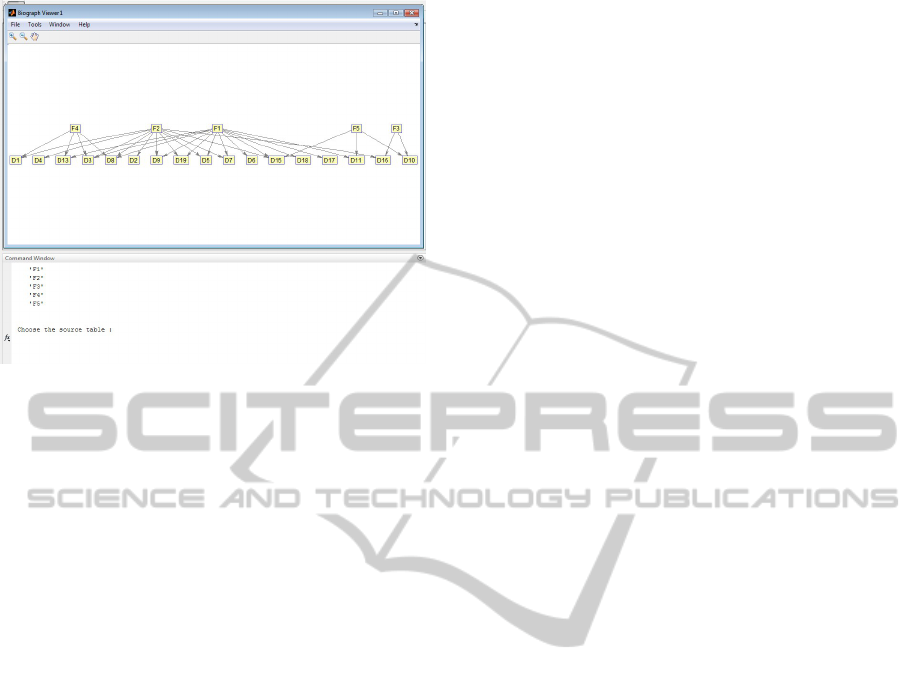
Figure 7: Visual interface of the refinement tool.
6 CONCLUSION AND FUTURE
WORK
Design data warehouses system is a complex and cru-
cial task depending on available data sources and de-
cisional requirements. Existing work do not exploit
the semantics of data to automatically create complex
hierarchies. Thus in this paper, we present a mixed
multidimensional refinement methodology, that trans-
form constellation schema to define hierarchy level
using a hierarchical clustering algorithm. Our refine-
ment methodology enriches a dimension with factual
data, and considers the context of factual data. We
present also the implementation of our method in a
ROLAP architecture.
We perform the proposed methodology on a real
application case from bird biodiversity. We have
noted that actual automatic multidimensional design
methodologies cannot produce a multidimensional
schema, which covers all decision-maker needs due
to the data complexity. Our methodology offers a so-
lution to enrich dimensions with factual data and, by
this way, to refine the multidimensional schema.
Our ongoing work is the extension of our method-
ology to simplify and reduce the number of created
levels, using other DM algorithms such as SVM, etc.,
in order to provide decision-makers with easy OLAP
exploration analysis and its implementation in a RO-
LAP architecture.
Moreover, we are also working to integrate our
approach in the rapid prototyping methodology pro-
posed in (Sautot et al., 2014a), and extending to help
decision-makers and DW experts choose the right DM
algorithms and parameters of the refinement algo-
rithm (source node, contextual dimensions, etc.). Fu-
ture work concerns the usage of the formal evaluation
framework Goal Question Metric (Briand et al., 2002)
to evaluate our methodology.
ACKNOWLEDGEMENTS
Data acquisition received financial support from the
FEDER Loire, Etablissement Public Loire, DREAL
de Bassin Centre, the R
´
egion Bourgogne (PARI, Pro-
jet Agrale 5) and the French Ministry of Agriculture.
We also thank heartily Pr. John Aldo Lee, from the
Catholic University of Leuven, for his help.
REFERENCES
Bentayeb, F. (2008). K-means based approach for olap di-
mension updates. In 10th International Conference on
Enterprise Information Systems (ICEIS), pages 531–
534.
Briand, L. C., Morasca, S., and Basili, V. R. (2002). An
operational process for goal-driven definition of mea-
sures. IEEE Trans. Software Eng., 28(12):1106–1125.
Carme, A., Mazon, J.-N., and Rizzi, S. (2010). A model-
driven heuristic approach for detecting multidimen-
sional facts in relational data sources. In Pedersen,
T., Mohania, M., and Tjoa, A. M., editors, Proceed-
ings of 12th International Conference on Data Ware-
housing and Knowledge Discovery (DaWaK), volume
LNCS 6263, pages 13–24.
Ceci, M., Cuzzocrea, A., and Malerba, D. (2011). Olap
over continuous domains via density-based hierar-
chical clustering. In 15th International Conference
on Knowledge-Based and Intelligent Information and
Engineering Systems (KES 2011), volume 2, pages
559–570.
Favre, C., Bentayeb, F., and Boussaid, O. (2006). A
knowledge-driven data warehouse model for analysis
evolution. Frontiers in Artificial Intelligence and Ap-
plications, 143:271.
Jensen, M. R., Holmgren, T., and Torben (2004). Discov-
ering multidimensional structure in relational data. In
Data Warehousing and Knowledge Discovery: 6th In-
ternational Conference (DaWaK).
Jovanovic, P., Romero, O., Simitsis, A., and Abell
´
o, A.
(2012). Ore: An iterative approach to the design
and evolution of multi-dimensional schemas. In Pro-
ceedings of the Fifteenth International Workshop on
Data Warehousing and OLAP, DOLAP ’12, pages 1–
8, New York, NY, USA. ACM.
Kimball, R. (1996). The Data Warehouse Toolkit: Practi-
cal Techniques for Building Dimensional Data Ware-
houses. Wiley.
Lenz, H.-J. and Thalheim, B. (2009). A formal framework
of aggregation for the olap-oltp model. Journal of
Universal Computer Science, 15(1):273–303.
ICEIS2015-17thInternationalConferenceonEnterpriseInformationSystems
554

Leonhardi, B., Mitschang, B., Pulido, R., Sieb, C., and
Wurst, M. (2010). Augmenting olap exploration
with dynamic advanced analytics. In 13th Interna-
tional Conference on Extending Database Technology
(EDBT 2010).
Mahboubi, H., Ralaivao, J.-C., Loudcher, S., Boussa
¨
ıd, O.,
Bentayeb, F., Darmont, J., et al. (2009). X-wacoda:
an xml-based approach for warehousing and analyz-
ing complex data. Data Warehousing Design and Ad-
vanced Engineering Applications: Methods for Com-
plex Construction, pages 38–54.
Messaoud, R. B., Boussaid, O., and Rabas
´
eda, S. (2004). A
new olap aggregation based on the ahc technique. In
DOLAP 2004, ACM Seventh International Workshop
on Data Warehousing and OLAP, pages 65–72.
Miquel, M., Bdard, Y., and Brisebois, A. (2002a). Concep-
tion d’entrepts de donnes gospatiales partir de sources
htrognes. exemple d’application en foresterie. Ing-
nieries des Systmes d’information, 7(3):89–111.
Miquel, M., B
´
edard, Y., Brisebois, A., Pouliot, J., Marc-
hand, P., and Brodeur, J. (2002b). Modeling multi-
dimensional spatio-temporal data werehouses in a
context of evolving specifications. International
Archives Of Photogrammetry Remote Sensing And
Spatial Information Sciences, 34(4):142–147.
Nguyen, T. B. and Tjoa, A. M. (2000). An object oriented
multidimensional data model for olap. In In Proc.
of 1st Int. Conf. on Web-Age Information Manage-
ment (WAIM), number 1846 in LNCS, pages 69–82.
Springer.
Phipps, C. and Davis, K. C. (2002). Automating data ware-
house conceptual schema design and evaluation. In
Proceedings of the 4th International Workshop on De-
sign and Management of Data Warehouses (DMDW),
volume 2.
Romero, O. and Abello, A. (2009). A survey of multidimen-
sional modeling methodologies. International Journal
of Data Warehousing and Mining, 5(2):1–23.
Romero, O. and Abello, A. (2010). Automatic validation
of requirements to support multidimensional design.
Data and Knowledge Engineering, 69:917–942.
Sautot, L., Bimonte, S., Journaux, L., and Faivre, B.
(2014a). A methodology and tool for rapid prototyp-
ing of data warehouses using data mining: Applica-
tion to birds biodiversity. In Proceedings of 4th Inter-
national Conference on Model & Data Engineering
(MEDI). In Press.
Sautot, L., Faivre, B., Journaux, L., and Molin, P. (2014b).
The hierarchical agglomerative clustering with gower
index: a methodology for automatic design of olap
cube in ecological data processing context. Ecological
Informatics. In Press.
MixedDrivenRefinementDesignofMultidimensionalModelsbasedonAgglomerativeHierarchicalClustering
555
