
Twist, Shift, or Stack?
Usability Analysis of Geospatial Interactions on a Tangible Tabletop
Catherine Emma Jones
1
and Valérie Maquil
2
1
CVCE, Sanem, Luxembourg
2
Luxembourg Institute of Science and Technology (LIST), Esch-sur-Alzette, Luxembourg
catherine.jones@cvce.eu, valerie.maquil@list.lu
Keywords: Tangible User Interface, Cartography, Geospatial Information, Usability, Qualitative Study, User Study,
Tangible Interfaces, TUI, Mapping, User Centred Design, Interactive Tabletops.
Abstract: Maps as learning, exploration and analysis tools have great power to aid understanding of complex
phenomena and to instigate and engage discussion. To date, web-mapping platforms have largely
contributed to the public availability of geospatial information. Tangible user interfaces (TUI) as an
emerging class of interfaces, have a clear potential for improving collaboration around geospatial data, as
well as increase geospatial understanding, but to realise this potential they must be easy and straightforward
to learn and use. To date, there is a lack of research centred on human interactions with geospatial tangible
applications. This paper reports on the results of an initial qualitative usability study carried with novice
users on a geospatial tangible table. It discusses aspects related to cartographic elements, object
manipulations, and offline interactions, to create an initial set of usability guidelines for geo-tangible tables.
1 INTRODUCTION
Maps as learning, exploration and analysis tools
have power, aiding understanding of complex
phenomena and to instigate and engage discussion
for both novice and experts. If we are able to
integrate maps within technology that facilitates
discussion and collaboration there is even more
potential for knowledge building and cross-
disciplinary engagement.
Technological advances in the last decade
transformed maps and geographic information (GI),
bringing new technologies and methods for
acquiring, processing and sharing GI (Goodchild,
2010). Most markedly, the now ubiquitous web-
mapping applications based on the online “slippy
map” API’s (Bing Maps, Google Maps,
OpenStreetMap) (Parsons 2013) have largely
contributed to the public availability of geospatial
information on web sites, services, and apps. These
user friendly interfaces prove that simple intuitive
interfaces adhering to usability principals (Jones and
Weber, 2012) were a real breakthrough for widening
access to GI. Such interfaces are one of the primary
GI interaction tools for the lay person and have been
widely adopted by National Mapping Agencies. This
revolutionises in how GI is created and consumed,
and presents new opportunities for design research.
Turning from the over reliance on sophisticated and
often complex interactions which alienate users and
impairs knowledge construction and moving towards
new geo- interfaces with users at the core, adding
value by being fun and engaging (Fuhrmann, 2005;
Hakley and Tobòn, 2003; Jones et al., 2009).
Tangible user interfaces (TUI) as an emerging
class of interfaces (Ishii 1997), have a clear potential
for improving collaboration with geospatial data.
TUIs offer large representations that encourage
collaborative working amalgamated with intuitive
and tactile user interactions (MacEachren et al.,
2005). The inherent knowledge of the physical
objects, drawing upon familiar concepts of the
physical world, helps to provide users with a feeling
of intuitive directness (Djajadiningrat et al. 2004).
TUIs are natural supports for collaboration; they
enhance group productivity, by bringing users
around a shared discussion space and supporting
them in coordinating their actions using the physical
objects (Hornecker and Buur, 2006). Moreover,
applications available via tangible devices are
inherently spatial, both literally and metaphorically
(Marshall 2007).
These benefits have led to the implementation of
a variety of geospatial TUI research scenarios, such
170
Jones C. and Maquil V..
Twist, Shift, or Stack? - Usability Analysis of Geospatial Interactions on a Tangible Tabletop.
DOI: 10.5220/0005377601700177
In Proceedings of the 1st International Conference on Geographical Information Systems Theory, Applications and Management (GISTAM-2015), pages
170-177
ISBN: 978-989-758-099-4
Copyright
c
2015 SCITEPRESS (Science and Technology Publications, Lda.)
as urban planning (Maquil et al. 2007) or disaster
management (MacEachren et al., 2005). TUIs have
potential as novel collaborative learning
environments for mapping applications but to realise
this potential they must be straightforward to learn
and use. Their functionality must be memorable and
peripheral so users focus on knowledge construction.
There are relatively few usability studies related
to mapping on tabletop interfaces. Research focuses
on technical implementations at the expense of user
research. The few existing studies have only
marginally incorporated user centric approaches and
testing, through use of questionnaires (Nagel et al.,
2014) and a task-based approach (Scott et al..2010).
The study presented in this paper is novel in two
aspects. First, it focusses on cartographic
interactions on a tabletop. Second, it investigates the
use of tangible objects for that purpose: our
cartographic interactions are implemented by means
of manipulations with physical objects. We explore
the relationship between the user and the spatial
interactions to determine the most intuitive and
effective use of tangibles for geographic interactions
such as zoom, pan and working with layers and their
legends. The aim is to describe the results of an
initial qualitative usability study to provide insights
on how novice users interact with geospatial data
through a tangible table.
2 ABOUT THE GEOSPATIAL
TANGIBLE TABLE
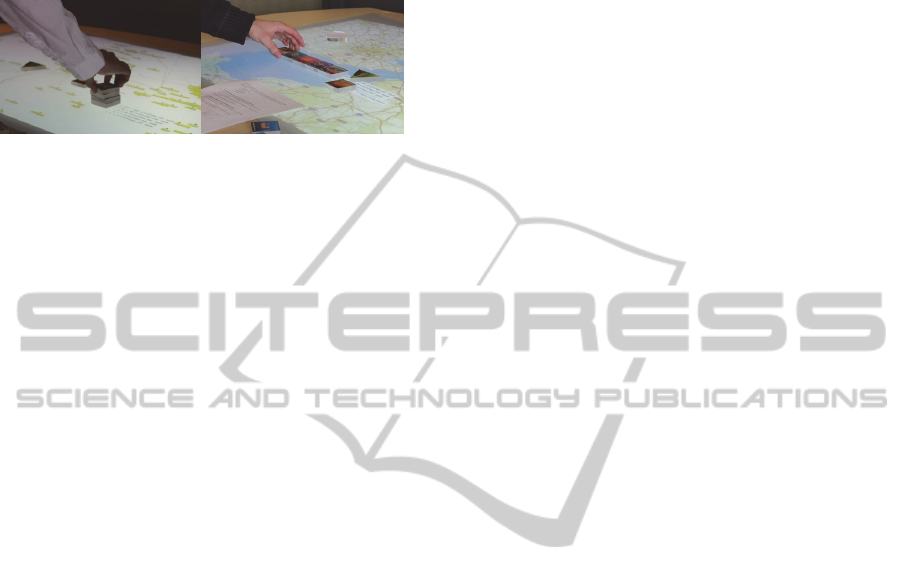
The geospatial tangible table (Maquil et al., 2015)
allows users to explore and analyse digital maps
projected onto a tabletop. Interactions with the map
are carried out using physical objects that are placed,
shifted, and twisted on the tabletop. The rounded
tabletop is sized 150x105cm, with an interactive
surface of 120x75cm (see Figure 1).
Figure 1: Digital maps on the tangible table.
The system was developed in 2013-14 in an
iterative approach. The digital maps were created in
the context of sustainable freight transport in North
Western Europe, from the Interreg IVb Weastflows
project. The aim was to develop a new technological
solution for supporting face-to-face collaboration of
multiple stakeholders in order to identify future
opportunities for sustainable and more efficient
supply chains, an inherently geographical problem.
In multiple iterations we designed a series of
basic geospatial interactions, that we progressively
extended by more advanced interactions. While the
system with all the interactions, as well as the
software architecture has been reported elsewhere
(Maquil et al., 2015), the basic spatial interactions
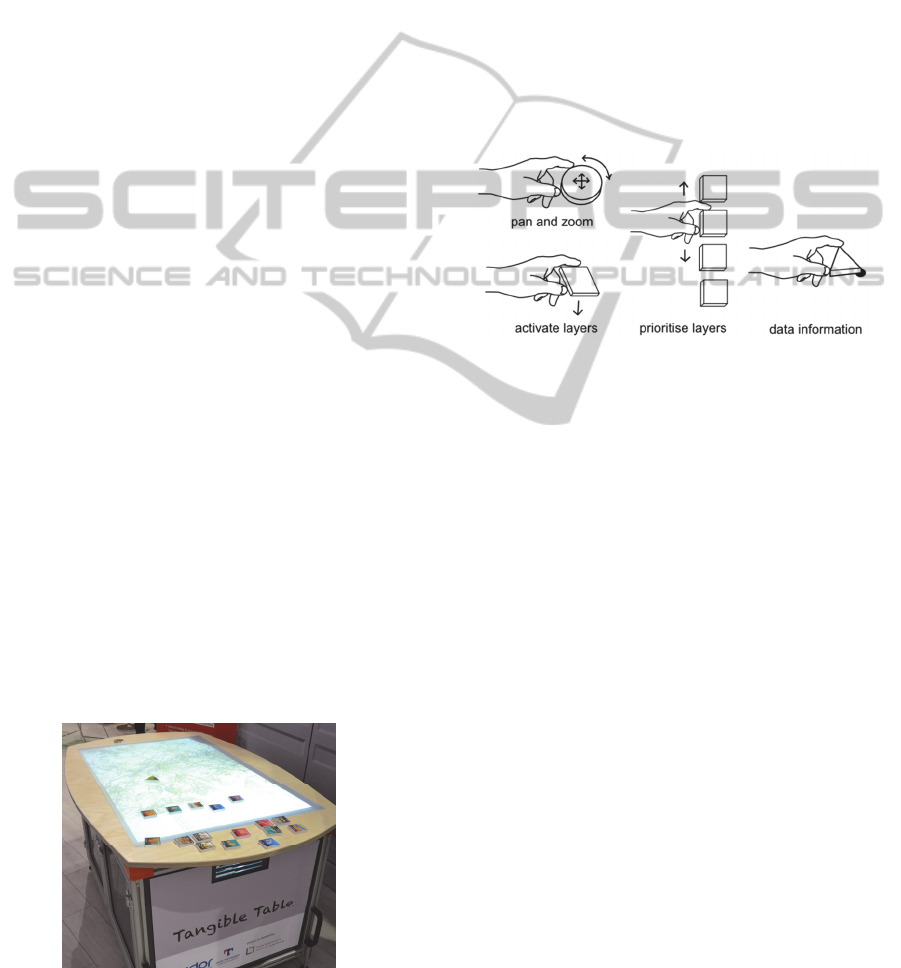
are described below (see Figure 2):
Figure 2: Basic cartographic interactions implemented
with tangible objects.
Panning: By dragging the circular object across the
table, the map view is moved in the same direction.
When lifted and dropped at another location, no
panning is performed.
Zooming: The same circular object is rotated to the
right to zoom in and to the left to zoom out.
Activate Layers: A set of square objects represent
different geographical data layers. To activate the
layer, the object is placed anywhere on the map. The
legend is then visualized in a box displayed on the
right of the placed object. When the object is
removed from the table, the layer is deactivated.
Prioritise Layers: The vertical position of each
layer object determines the order the layers are
drawn. Layer objects nearest the bottom of the table
are drawn first, while layers lying at the top are
drawn last – hence may occlude any layers
underneath.
Data Information: A triangular object shows a
black dot at one of its corners. This dot can be
placed on any graphical element. When the object
remains in a same position for 500ms, a description
is opened next to the graphical element, removing
the object closes the window.
Twist,Shift,orStack?-UsabilityAnalysisofGeospatialInteractionsonaTangibleTabletop
171

3 EXPERIMENT
METHODOLOGY
A qualitative approach was used to collect user
interaction data describing an enriched view of the
participants’ perspective of the tangible geospatial
interface. The study combined participant
observation (video and observer) together with the
Think Aloud protocol (ISO/TR 16982:2002). The
experiment had 6 tasks, taking about 30 minutes.
The tasks were designed around the basic
cartographic interactions patterns a new user would
be expected to learn (zoom, pan, adding layers,
rearranging layers, working with legends and
interpreting thematic maps). Complexity of tasks
increased as users completed the work sheet. The
tasks had the following themes:
Locating Luxembourg and its greater region
(zoom, pan & adding data layer).
Adding multiple data layers
Working with different information and
prioritising it (zoom, pan, switching data on and
off, rearranging layers to create visual hierarchy)
Interpreting meaning from the map (using
legends, working with the info tool)
Working with thematic maps and different layers
(zoom, pan, working with layers and legends).
A pilot experiment was conducted to test the
protocol for consistency, errors and timeliness. Prior
to commencing, participants were provided with an
information sheet outlining what they would be
doing and why, given the opportunity to ask
questions, informed about collected data and how it
would be used, asked to sign a consent form and
complete a brief general IT questionnaire to gauge
computer literacy and experience with GIS. An
experiment room was set up, comprising of the TUI,
objects, a camera and seating for observers (see
Figure 3). For each experiment the objects were set
in the same place and order. Participants were only
provided with the task sheet.
Eight participants (N=8) were recruited. There
were two pre-requisites: a) participants must never
have used a TUI before and b) they must be
comfortable Thinking Aloud in English. An equal
mix of genders participated (4 females and 4 males)
with an aged between 20 and 45. All were familiar
with online mapping websites such as Google Maps
(3 frequent and 5 occasional users).
No testers routinely used desktop GIS although 2
participants have used it: 1 described himself as a
novice with less than 1 years’ experience, the other
as an intermediate user with 1 to 3 years’
experience). All participants were IT literate with 4
participants stating they have experience in
application development.
Figure 3: Setup of the experiment room and initial position
of the objects.
There are many debates on the number of users
required for usability testing. The number of
recommended users range from 5 (Landauer and
Nielsen 1993), 10-20 (Faulkner 2003) to 10 +/-2
(Hwang and Salvendy 2010), justifying our sample
size, there are diminishing returns for discovering
additional issues.
4 ANALYSIS OF RESULTS
The purpose of our analysis was to understand issues
associated with ease of learning and ease of use. In
mid-term perspective, the results of this analysis
should provide input for an iterative research
revealing insight into the learnability and
intuitiveness of tangible mapping interfaces.
4.1 Getting Started: Making a Basic
Map with One Data Layer
Participants created a map, of one geographic
boundary, adding data for European country borders
onto the table to create their first, albeit simple,
vector map of Europe. To complete the task, which
all participants did, they had to place the correct
object on the table. They were uncertain how to
start. At first they showed confusion, bemusement
and wonder, “How do I start this?” (P2). Four
participants were observed shrugging shoulders
and/or waving hands or arms before either exploring
the objects or touching the table. After their initial
perplexity, users explored the table using prior
knowledge of other types of technology. Wondering
how to start, P7 touches the table, shrugs and says
“… am I supposed to click on something?”. P2 first
attempted a vertical stroke down the table with the
exclamation “OK, nothing happens…” where as P4
GISTAM2015-1stInternationalConferenceonGeographicalInformationSystemsTheory,ApplicationsandManagement
172

waggles the fingers on the table and says, “it seems
to me I should switch something”.
All users were surprised by and hesitant to use
the objects to create their map, believing that the
identification of the correct object was, “a lucky
shot, I guess!” (P1). Users unfamiliar with such
interaction objects, initially explored the objects
intently: scanning the objects, selecting one,
examining it by turning them around or upside
down.
4.2 Zoom and Pan
The next stage in the task sheet was to zoom to a
specific Country. In this case, we asked participants
to zoom to Luxembourg, recreating an example map
view. Experience with prior technology influenced
how participants investigated this interaction. On
their first attempt, all participants used the familiar
touch interactions common to mobile and tablet. We
observed vertical swipes of the table from top to
bottom (P1, P2) pinching thumb and forefinger
together (P2), using middle finger and forefinger
pinch to try and zoom (P3), touching the table by
moving two hands towards each other (see Figure 4).
Figure 4: First zoom and pan attempts with hand gestures:
(a) vertical swipe (b) pinching (c) using two hands (d)
middle and forefinger.
Panning, more than zoom, was the most intuitive
and easy to learn. Once the object was correctly
identified, all participants picked it up and dragged
it. Five participants took less than 10 seconds to
work out the functionality. To stop panning,
participants instinctively moved the object off the
table. The zoom functionality was less obvious and
more difficult to identify. We observed six
participants zooming when using the object to pan.
This was unintentional and unexpected because as
they panned, the object twisted a little causing the
map to change scale. This functionality led to
confusion and frustration, “it zooms but I don’t know
why?” (P2) or “I have no idea how to zoom,
sometimes it works a bit” (P3). Twisting the object
was not always the most intuitive action as the
functionality was hidden.
4.3 Working with Several Data Layers
The next task was to create a map with five different
data layers, switching on the reference map and then
to develop a visual hierarchy of the layers by
prioritising their displayed order.
All participants added new layers with ease and
confidence. P2, for instance, describes it as being
“straightforward”. They adopted the same
procedure, consisting of 1) reading the labels of the
objects lying on the border of the table, 2) grasping
the required object and 3) putting it onto the
interactive surface.
There were two distinct approaches to
completing this task. Four of the participants repeat
this procedure in a quick fashion until all layer
objects were lying on the table and their information
displayed. The remaining four carefully explored the
displayed information after having placed an object
on the surface. E.g. P2, who immediately reads and
analyses the legend after placing the object. Then
she tries to identify the information on the map, and
finally uses the zoom to view more detail: “at this
zoom level it is not very legible… but if I zoom in I
suppose I will be able to see more… ok, yes”.
All participants hesitated on where to place layer
objects on the table, assuming they had to be placed
in the area of interest. This was also observed during
the first map creation. Participants placed objects at
arms-length, just below the optical centre of the
map. Additional confusion arose as some layers
required several seconds to load, there was no
feedback to tell the users data was refreshing. For
instance, P4 takes the road object from the border,
“Let’s create a map with roads”, and first makes a
movement to place it inside UK, but then places it
west of UK, inside the sea, waits a short moment,
while looking at the map. Nothing is displayed, so
he lifts it again. “Maybe I should place it on the
ground somewhere”, and places it inside France.
Switching on the reference map, labelled full
map on the object, by twisting the country border
object turned out to be straightforward for some
participants whereas others needed additional time
or explanations. This was unexpected, as all had
previously used an object twist to change the map
state when zooming. The task of prioritising layers
for three users was quick and easily completed
whilst five users had trouble. Three participants
instinctively stacked the objects on top of each other.
P4, for instance, first stacks them with the first layer
Twist,Shift,orStack?-UsabilityAnalysisofGeospatialInteractionsonaTangibleTabletop
173
of the list lying at the bottom (see Figure 5: a), then,
being unhappy with the results, creates a second
stack with the last layer of the list lying at the
bottom.
Figure 5: Two approaches for prioritizing layers: a)
stacking objects, or b) putting them side by side.
An alternative approach was provided by P5 who
noticed small arrows on the labels, and interprets the
need of putting the layers side by side (see Figure
5b), “I realize that maybe the little symbol on the
objects is like the order of the priority of the
different objects in the map” (P5). This
demonstrates the misinterpretation of labelling and
semiology of the objects. Participants were unsure
whether they solved the task of prioritizing layers
correctly as they were expecting additional
feedback. “We can’t see that on the map. So I guess
something is missing, but I don’t know what.” (P7)
4.4 Interpreting Layers and Legends
Participants were asked to identify, between France
and UK, the shipping route with the most, and the
least amount of traffic. We observed differences in
how participants organized their workspace for
solving this task. P3 worked on the very left side of
the table, preventing her to see the surroundings.
However, she is not panning the map, nor
mentioning a limitation in her field of view. In
contrast, other participants make use of known
features to identify correct answers. For instance, P2
moves the line of objects one by one to the right.
“So that I can see something…” Then, she switches
between full map and country borders to be able to
identify the symbols.
A common procedure was also to remove
unnecessary information to obtain a better view. For
instance, P6 decides to remove some of objects. “I
will bring out everything which I don’t use, to have
something a bit more clear”.
Nevertheless, all participants were unable to
locate the shipping route with the least amount of
traffic. Participants were mentioning difficulties in
seeing the difference between the lower values. This
illustrates the need to improve the cartographic
representation of the data layers and the information
and visualisation of the legends.
4.5 Requesting More Information
Finally, participants were asked to find the names of
the ports using the info tool. This task turned out to
be particularly challenging. Only three participants
identified the correct information (38% completion
rate, very low), however, even those who completed
the task took a long time (average time was 03:53).
P8, for instance, first places it pointing down onto
the centre of the shipping route, waits a short
moment, and then turns it into the other direction,
pointing upwards onto the centre of the route. Then
she points onto one end of the route, and the other
end. Then she taps the object. She is prompted to
explain her action. While answering the question she
replaces the object and a window opens. This issue
can be explained by the fact that the table sends the
request for information when there is no action on
the object, and provides no hint when exactly this is
done. Users expected immediate feedback, and
without this feedback, they concluded that they have
made a manipulation mistake. They replaced the
object before the system sent the answer.
5 DISCUSSION
We have classified the observed issues into three
themes: a) understanding cartographic elements on
tangible tables; b) object manipulations; and c) use
of non-responsive “offline spaces”.
5.1 Understanding Cartographic
Elements
To aid the general spatial cognition of maps, there
are a number of well-defined map elements (like
scale and direction, title, inset maps and use of
legends) that should be integrated into the digital
mapping interface. The use of these simple well
established conventions can improve interpretability
and understanding of the information. At present,
only the use of the legend has been implemented on
the geo-tangible interface. This absence of map
elements led to confusion and reduced
understanding of the geographic information. The
use of these types of cartographic elements are not
new and have been clearly defined from research
with paper maps but what is required is in depth
understanding on how they can be integrated into the
GISTAM2015-1stInternationalConferenceonGeographicalInformationSystemsTheory,ApplicationsandManagement
174

TUI to ensure they enhance users geographic
understanding.
Currently, the zoom object is unrestricted.
Participants were able to zoom indiscriminately in or
out of the map. Frequently, we observed users
zooming so much that they ended up at the bottom
of the ocean, with no clear understanding associated
with what or why they were just seeing no data. This
lack of feedback with the map’s scale can be
improved with the following simple guidelines:
Restrict the zoom capacity according to the
scenario’s context and common sense.
Display feedback reflecting a change in the zoom
made by a user.
Provide an inset map so users can see how and
where they are navigating to on the map. To
avoid taking valuable space away from the map,
consider using a separate interface projected on
wall or via a smartphone, for example.
Provide a tangible to reset the map zoom.
Provide tighter control between the two
functionalities of zoom and pan. Explore
alternative tangible actions and objects for
zooming.
The legend is one of the most important map
elements, without a meaningful legend spatial
cognition is weak. As with many digital map
legends, the legend details can be derived by default
from the layer information, but default labels often
reduce the ability to interpret data classifications.
The legends used in this scenario were developed by
default from the external projects database. Legends
fell foul to system defaults that made sense only to
technical developers. The legend display, to the right
of the object placed on the table led to
misinterpretation. When only one piece of
information was displayed, some users did not
realise that this information was part of the legend
and interpreted it as a further location on the map,
certainly due to the absence of information to
identify the symbol and label as the legend. The
following suggestions would improve spatial
cognition of legends:
Consider projecting the legend in the offline
space or integrate it within a separate device
Differentiate the legend from the map using neat
lines and titles and visual cues.
Design legends for the user: labels and text
should reflect their mental models. Legend data
classes should be rounded to whole numbers and
arranged vertically with lowest numbers at the
bottom. The textual descriptions for the data
classes should add meaning for the user.
Enable to switch the legend on or off.
When working with layers consider:
The reorder of layers based on either horizontal
(left – right) or vertical hierarchy (top – bottom)
Automatically change the cartographic styles of
the layers based on where they are positioned in
the visually hierarchy.
5.2 Object Manipulations
Particular to interactions on TUIs are the physical
manipulations with tangible objects. In previous
work, the mapping of physical objects to digital
information has been seen as central (e.g., Ullmer,
2000), and aspects related to, e.g., embodiment and
metaphor have been discussed (Fishkin, 2004).
The way in which participants interacted with the
object varied considerably. We observed participants
shifting, dropping and lifting the objects. Some used
stacking, twisting, tapping to try and instigate a
change in the map, initiate, or cancel an action,
suggesting future versions of the interface could
make more of these natural interactions, and
conform to users’ natural expectations. Also
observed were very different ways of manipulating
the objects. Some work with two hands, other with
one. Some prefer to lift and drop, others shift the
object slowly around the table. Some make a lot of
quick and short movements, other read and reflect a
lot, then make only few considered movements.
The current implementation of the interface was
impacted by the different working practices which
led to unexpected changes in the map state for the
user: data not loading when quick movements were
made, the map moved unexpectedly when users tried
to move the zoom and pan object out of the area of
interest on the map. The following guidelines could
reduce the impact of unexpected results occurring
from different working styles with the objects.
Provide hints and tips to get started –a brief help
video could be shown if the users touch the table
when no objects are on it.
Provide user feedback if an object is moved too
quickly, like: “I think you are trying to move the
map, try again but slower”.
Enable users to go to their previous view by
providing an object or turn/action with an object
During panning, restrict the object to deactivate
the zoom action.
When the result of a geospatial interaction
cannot be provided immediately during the
Twist,Shift,orStack?-UsabilityAnalysisofGeospatialInteractionsonaTangibleTabletop
175

manipulation, provide a visual feedback ensuring
the user that the manipulation was correct and
that something is happening. For instance, a data
refreshing symbol.
Provide clear labelling of interactions on the
objects - arrow to show the need and direction of
rotation for zoom.
Ensure objects with different functions are
uniquely differentiated, enabling them to be
easily recognized. Make use of shape, colour,
sizes and heights and group objects of similar
functional types accordingly.
Where it makes sense consider the use of use of
objects that represent everyday metaphors (e.g.,
toy cars for a road layer or trains for the railway
network).
5.3 Non-responsive “Offline” Spaces
One of the inherent properties of TUIs is the intense
combination of the physical and the digital, enabling
a rich range of interactions. A large number of these
can be done offline, on non-responsive spaces. As
already previously observed, TUIs enable an “extra
layer of interaction” on spaces that are not recorded
into the system (Fernaeus et al., 2008). In
collaborative settings, these spaces were used to
make suggestions, demonstrate next steps, or set a
common focus (Maquil and Ras, 2007).
We have made similar observations with
participants of the geo-tangible interface. To fulfill
tasks participants made use of offline interactions to
reduce their mental load. In particular, they
organised the workspace in order to have a better
view on the map, as for instance, P2 who was
shifting layer objects outside her field of view.
Another type of offline interactions were used to aid
cognition in the stepwise following of the tasks, i.e.
P1, who was touching the object layers as soon he
has found them. Finally, we saw that participants
used non-responsive spaces to adopt another
perspective. P2 was bending herself multiple times
between two positions, as well as P6 who was
leaning himself onto the border of the table while he
felt stuck. Thus, the offline space is an important
feature of the geo-tangible interface and it should be
supported by the following features:
Support a change of perspective: enable users to
do a few steps, bend and stretch themselves, or
lean against the table. The tabletop should
provide a good view from different positions and
support actions not only at the middle of the
table, but also on the sides.
Allow users to customize their views: provide a
non-reactive area where objects can be placed
when removed, consider providing dedicated
repositories where users can place objects of
different types – to aid relocating of the objects
for future use. Also enable objects to be placed
on different positions on the interactive surface
to support users in customising their view.
Non-reactive touching: allow for touch
interactions that have no effect in the system,
hence allowing the users to use them for
externalising their cognition.
6 CONCLUSIONS
This paper has presented the first usability study of
our geo-tangible user interfaces. It was conducted
using established methodological practices designed
around the completion of predefined tasks and Think
Aloud protocol analysed using video analysis. The
result is a first set of insights into how the novice
user explores tangible interfaces to carry out specific
tasks. On first use with the objects, experiment
participants were cautious and object movements
were hesitant as they were uncertain of the interface.
However, we observed all participants quickly
becoming confident with using the objects to
manipulate the map, with various different working
styles emerging. Indeed, in the authors’ experience,
it would not be possible to learn so quickly to use a
conventional desktop mapping application. A
comparison with which would be a suitable topic for
a further study.
Based on this observation, we can conclude that
the geo-tangible user interface is particularly useful
in situations involving lay users. Typically such
situations appear in participatory approaches, such
as participatory urban planning. A geo-tangible table
could improve communication between
heterogeneous stakeholders by, on one hand,
allowing experts to explain geospatial phenomena to
novices, and, on the other hand, supporting novices
in sharing an own perspective with the expert. We
also see its potential for the development as a
teaching and learning platform for younger
audiences. As interaction is simplified in TUI
scenarios, complex GIS manipulations will be
limited. So this approach is less useful for situations
purely implicating geospatial expert users.
The results of our analysis highlight the necessity
to consider three different dimensions in the design
of geospatial tangible tables: cartographic elements,
GISTAM2015-1stInternationalConferenceonGeographicalInformationSystemsTheory,ApplicationsandManagement
176

object manipulations, and non-responsive spaces.
Observed issues dealt with the lack of cartographic
elements adding geographic meaning, such as a
cartographic scale or an inset overview map. We
also observed a series of issues related to feedback
in general. Although learned object movements
could be easily repeated, they appeared hidden to the
users at the beginning. Better and timely feedback,
informing the user of what is happening, would
allow him/her to appropriate the interactions more
effectively.
Based on our analysis we have formulated an
initial guidelines design for geospatial tangible
tables to ensure their ease and straightforward to
learn and use. In future work, we hope to investigate
the most intuitive and effective use of tangibles for
geographic interactions and understand how
different types of objects and their interactions can
be optimized for geospatial TUIs.
This study shows the real usefulness of user
studies to establish guidelines for the development
of novel interfaces such as the interactive tangible
table. To successfully interact with such a system,
special interactions are required, that, on one hand,
build upon fundamental principles and, on the other
hand, make use of new possibilities of emerging
technologies.
REFERENCES
Djajadiningrat, T., Wensveen, S., Frens, J., and
Overbeeke, K. (2004). Tangible products: re-dressing
the balance between appearance and action. Personal
and Ubiquitous Computing, 8(5): 294-309.
Faulkner, L. (2003). Beyond the five-user assumption:
Benefits of increased sample sizes in usability
testing. Behavior Research Methods, Instruments and
Computers, 35(3), 379-383.
Fernaeus, Y., Tholander, J., Jonsson, M. (2008). Towards
a new set of ideals: consequences of the practice turn
in tangible interaction. In Proc. of TEI ’08.
Fishkin, K. (2004). A taxonomy for and analysis of
tangible interfaces. Personal and Ubiquitous
Computing, 8(5), 347–358.
Fuhrmann, S. al., (2005). Making useful and useable
geovisualization: design and evaluation issues.
Exploring geovisualization, pp.553–566.
Goodchild, M.F., (2010). Twenty years of progress:
GIScience in 2010. J.of Spatial Info Science (1).
Haklay, M. & Tobón, C., (2003). Usability evaluation and
PPGIS: towards a user-centred design approach. Int. J.
of GIS, 17(6), pp.577–592.
Hornecker, E., & Buur, J. (2006). Getting a grip on
tangible interaction: a framework on physical space
and social interaction. In Proc. of the CHI 2006.
Hwang, W. & Salvendy, G. (2010). Number of people
required for usability evaluation: the 10±2 rule.
Commun. ACM 53, 5 (May 2010), 130-133.
Ishii, H., Ullmer, B., (1997). Tangible Bits: Towards
seamless interfaces between people, bits and atoms,
Proc. of CHI '97.
ISO/TR 16982:2002: ISO/TR 16982:2002, "Ergonomics
of human-system interaction -- Usability methods
supporting human-centred design," International
Standards for Business, Government and Society.
Jones, C.E., Haklay, M., Griffiths, S., Vaughan, L.,
(2009). A less-is-more approach to geovisualisation –
enhancing knowledge construction across
multidisciplinary teams. Int. J. Geog. Information
Systems. 23(8), pp 1077-93.
Jones, C.E., (2010) Practical Cartography. In Haklay, M.
(Ed), Interacting with Geospatial Technologies, Wiley
& Sons.
Jones, C.E and Weber, P., (2012). Towards usability
engineering for online editors of volunteered
geographic information: A perspective on learnability,
Transactions in GIS, 16(4) pp 523 – 544.
Landauer, T. K., & Nielsen, J. 1993. A mathematical
model of the finding of usability problems. Interchi
’93, ACM Computer–Human Interface Special Interest
Group.
MacEachren, A. M., Cai, G., Sharma, R., Rauschert, I.,
Brewer, I., Bolelli, L., Wang, H., (2005). Enabling
collaborative geoinformation access and decision-
making through a natural, multimodal interface. Int. J.
of GIS, 19(3), pp 293-317.
Maquil V., De Sousa L., Leopold U., Tobias E. (2015) A
geospatial tangible user interface to support
stakeholder participation in urban planning..
Proc. of
GISTAM 2015 (to be published).
Maquil V., Psik T., Wagner I., Wagner M. (2007)
Expressive Interactions Supporting Collaboration in
Urban Design. Proc. of GROUP 2007.
Maquil, V., and Ras, E., (2012). Collaborative Problem
Solving with Objects: Physical Aspects of a Tangible
Tabletop in Technology-Based Assessment. In Proc.
of COOP 2012.
Marshall, P., (2007). Do tangible interfaces enhance
learning In: Proc. of TEI ‘07, Baton Rouge, LA, USA,
Nagel, T., Maitan, M., Duval, E., Moere, A. V., Klerkx, J.,
Kloeckl, K., & Ratti, C., (2014). Touching Transport-
A Case Study on Visualizing Metropolitan Public
Transit on Interactive Tabletops.
Parsons, E., (2013). The Map of the Future May Not Be a
Map! The Cartographic Review, 50(2), pp 182-186.
Scott, S., Allavena, Cerar, K, Mcclelland, Cheung, V.,
2010. Designing and assessing a multi-user tabletop
interface to support collaborative decision-making
involving dynamic geospatial data. Tech rept, Uni of
Waterloo, Canada.
Ullmer, B. (2000). Emerging frameworks for tangible user
interfaces. IBM Systems Journal, 39, pp 915–931.
Twist,Shift,orStack?-UsabilityAnalysisofGeospatialInteractionsonaTangibleTabletop
177
