
Real-time Cargo Volume Recognition
using Internet-connected 3D Scanners
Felix Föcker
1
, Adrian Neubauer
1
, Andreas Metzger
1
, Gerd Gröner
2
and Klaus Pohl
1
1
Paluno - The Ruhr Institute for Software Technology, University of Duisburg-Essen, Gerlingstr. 16, 45127 Essen, Germany
2
Carl Zeiss Vision GmbH, Turnstr. 27, 73430 Aalen, Germany
Keywords: 3D Volume Recognition, Mobile Devices, Internet-connected Sensors, Transport and Logistics.
Abstract: Transport and logistics faces fluctuations in cargo volume that statistically can only be captured with a large
error. Observing and managing such dynamic volume fluctuations more effectively promises many benefits
such as reducing unused transport capacity and ensuring timely delivery of cargo. This paper introduces an
approach that combines user-friendly mobile devices with internet-connected sensors to deliver up-to-date,
timely, and precise information about parcel volumes inside containers. In particular, we present (1) RCM, a
mobile app for unique identification of containers, and (2) SNAP, a novel approach for employing internet-
connected low-cost, off-the-shelf 3D scanners for capturing and analyzing actual cargo volumes. We have
evaluated the accuracy of SNAP in controlled experiments indicating that cargo volume can be measured
with high accuracy. We have further evaluated RCM together with SNAP by means of a survey study with
domain experts, revealing its high potential for practical use.
1 INTRODUCTION
The execution and management of transport and
logistics processes strongly benefits from up-to-date,
timely, and precise information about transported
goods. Current technology developments such as
internet-connected devices (Internet of Things),
mobile and cloud computing, as well as software-
based web services provide unprecedented opportu-
nities for collecting relevant information in real-
time. For example, sensors can be placed at relevant
positions along a transport chain and even be at-
tached to the transport containers and transported
goods, thereby delivering real-time data about cargo.
Such data can in turn be conveyed to downstream
logistics partners, allowing them to better plan and
manage the delivery of goods, match the actual car-
go volume to the cargo capacity more precisely,
consolidate shipments to benefit from better freight
rates or increased cargo security, and, in general,
more effectively plan transport and handling activi-
ties for the enterprise (Metzger et al. 2014).
This paper focusses on parcel transport and lo-
gistics as one area where real-time information fos-
ters better, even proactive, reaction to deviations.
Parcel transport faces frequent volume fluctuations.
For example, the amount of parcels that should be
transported from an online reseller to its customers
may deviate from the planned amount of parcels for
that day, as actual parcel volumes can statistically be
captured only with large error. Observing and man-
aging such dynamic volume fluctuations more effec-
tively promises many benefits for a transport and
logistics enterprise, such as reducing unused
transport capacity and ensuring timely delivery of
goods.
Our contribution is to combine user-friendly mo-
bile devices with internet-connected sensors for
delivering up-to-date, timely, and precise infor-
mation about parcel volumes. In particular, we pre-
sent
1
(1) RCM (Roll Container Manager), an An-
droid app for the unique identification of parcel-
containers, and (2) SNAP (Scan and Analyse Parcel-
Containers), a novel approach for employing inter-
net-connected low-cost, off-the-shelf 3D scanners to
measure parcel volumes. RCM matches data ob-
served by the 3D scanner to the parcel-container,
thus providing unique identification of the container
for effective process management
.
3D scanners are one promising class of sensors
that can be applied to “estimate” volumes of spatial
1
Additional information about RCM, SNAP
and its quantitatively evaluation is provided at
https://sites.google.com/site/snaprcm
323
Föcker F., Neubauer A., Metzger A., Gröner G. and Pohl K..
Real-time Cargo Volume Recognition using Internet-connected 3D Scanners.
DOI: 10.5220/0005377203230330
In Proceedings of the 10th International Conference on Evaluation of Novel Approaches to Software Engineering (ENASE-2015), pages 323-330
ISBN: 978-989-758-100-7
Copyright
c
2015 SCITEPRESS (Science and Technology Publications, Lda.)

objects. Volume scanning using 3D has been applied
in various areas but mostly using proprietary, com-
plex, and costly 3D scanning devices. Therefore,
systems using low-cost 3D scanners promise to be
an attractive alternative to industrial sensor systems
due to their lower capital expenditures and their
capability of efficient process integration (Kückel-
haus et al. 2013). The quality of existing low cost
3D scanners has reached a level that makes it feasi-
ble to apply them in industrial settings. Successful
applications of such scanners have been reported in
cases such as warehouse picking operations (Xing-
yan Li et al. 2012), humanoid driving (Rasmussen et
al. 2013), or object reconstruction (Izadi, New-
combe, et al. 2011; Zhou and Koltun 2013; Xu et al.
2012; Bondarev et al. 2013; Kainz et al. 2012).
To quantitatively assess the accuracy of parcel
volume recognition as facilitated by SNAP, we per-
formed controlled experiments. Results indicate that
the position of the parcel-container and its payload
influence the accuracy. In the best case, we were
able to achieve accuracy with an average error rate
of about -15%. Complementing this quantitative
evaluation of our solutions, we performed qualitative
evaluations of SNAP and RCM through a survey
study with domain experts, indicating its high poten-
tial for practical use. Especially, knowledge about
the container volume in operative transport man-
agement was perceived as high importance.
The remainder of the paper is structured as fol-
lows. Section 2 gives an overview of the foundations
for 3D scanning. Section 3 relates our contribution
to the state of the art. Section 4 describes the imple-
mentation of SNAP and RCM. Section 5 presents
and discusses the design, execution, and results of
our quantitative evaluation. Section 6 describes our
qualitative evaluation.
2 FOUNDATIONS
We employ Microsoft Kinect as 3D scanner (con-
cretely, Microsoft Kinect for Windows v1 (Mi-
crosoft 2014)) and therefore present its main founda-
tions as basis for the remainder of the paper.
Kinect solutions have previously been experi-
mentally evaluated against professional solutions
concerning accuracy, effective field of view, and
object detection (Smisek et al. 2011; Khoshelham
2011; Dutta 2012). In (Dutta 2012) Kinect solutions
have been reported to perform better in some aspects
than professional solutions.
With the release of the Kinect for Windows SDK
v1.7, Kinect Fusion was introduced, enabling the
calculation of 3D-volume from depth stream data
(Izadi, Newcombe, et al. 2011; Izadi, Kim, et al.
2011; Microsoft Developer Network 2013). Several
depth-pictures are integrated step-by-step to obtain a
3D representation of the depth information (New-
combe et al. 2011; Freedman et al. 2012), and then
can be exported as a 3D-object. The raw-data of
such a 3D-object can be exported in form of a point-
cloud, an accumulation of points in a 3D space with
x, y and z coordinates, and can be processed further.
For example, raw-data is used to identify objects in a
scene by comparing two point-clouds and identify-
ing the changed points (Litomisky and Bhanu 2013)
or by creating silhouettes from the color and depth
data to separate objects from the scene (Xu et al.
2012). We use both ideas in our work to separate
parcel-containers from their background.
The Kinect device is very cost effective, but has
its own limitations. First, Kinect Fusion requires a
graphics processor for real time image processing,
which means the graphics hardware and memory can
become a restrictive factor (Microsoft Developer
Network 2014). Depending on the point cloud reso-
lution, scenes up to multiple cubic meters can be
scanned. Second, the depth sensor has noise and a
limited range. Several algorithms address these limi-
tations, e.g., (Bondarev et al. 2013; Roth & Vona
2012; Whelan et al. 2012; Zeng et al. 2012).
3 RELATED WORK
In this section, we describe approaches related to our
work.
With depth data available from 3D scanners, var-
ious application problems can be addressed. For
example, (Xingyan Li et al. 2012) present an imple-
mentation for the visual detection of objects in a
warehouse order picking process. A Kinect sensor is
used to identify goods each time an item is placed in
a basket. Both the basket and the goods are static.
The color images and depth images of the Kinect are
used to compare textures and geometric shapes of
detected objects against known objects in a database.
Recognition rates approaching 100% have been
achieved. However, the solutions does not employ
the new Kinect Fusion APIs. The authors use a
method for calculating the volume of objects located
within the basket. The depth of the container is
compared with the height of the measured object
points and the difference represents the height of the
object, which is then multiplied by the convex hull.
A project similar to our work was carried out by
DHL. Two low-cost depth sensors (similar to Kinect
ENASE2015-10thInternationalConferenceonEvaluationofNovelSoftwareApproachestoSoftwareEngineering
324
sensors) were used to measure the volume of cargo
on pallets. The results of the pilot phase indicated
high accuracy (Kückelhaus et al. 2013). Although
the project of DHL is a very similar scenario, it is
significantly different in structure from the applica-
tion considered in our work. In the project, the load-
ing volume of pallets is measured. Pallets have the
advantage that all sides are open. Due to the fact that
two sensors are used, a complete 3D capture of the
objects to be measured can be performed. From the
data, for example, the volume of the point cloud can
be calculated with the Delaunay triangulation (De-
launay 1934). In our work, only one sensor and
parcel-containers with only one open side are used.
Thereby, the Delaunay triangulation cannot be ap-
plied to the cloud point, because a full coverage
cannot be ensured, yet the space has to be calculated
within the container. These circumstances make it
more difficult to capture volume in our case.
4 IMPLEMENTATION
In this section, we briefly describe the implementa-
tion of the 3D scanning solution SNAP and the An-
droid App RCM.
Overview of SNAP. Our implementation for
volume scanning employs a Microsoft Kinect 3D
scanner for real-time volume recognition of parcel-
containers, called SNAP (Scan and Analyze Parcel-
Containers). For the technical setting, the Kinect
sensor is mounted on a tripod slightly above the
parcel-container to attain a complete overview of the
payload. The key idea for the volume calculation is
to use the point cloud of the scene, provided by the
Kinect Fusion algorithm and based upon the depth
stream of the Kinect sensor, to extract the point
cloud of the parcel-container and calculate its vol-
ume.
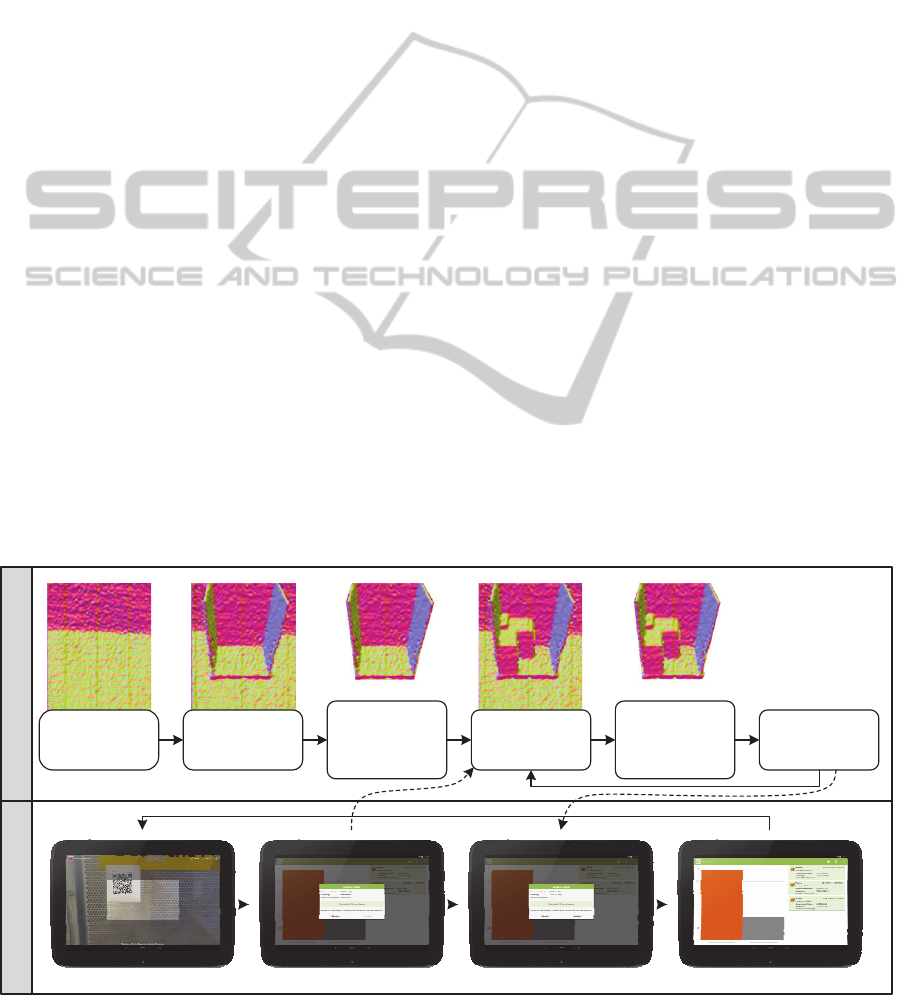
Our process for volume recognition consists of
two activities with three steps each: (cal) calibration
and (scan) actual scanning (see Figure 1). During
the calibration activity, the background and also an
empty parcel-container are scanned as baseline. The
calibration of the background is a simple snapshot of
the point cloud of the scene without a parcel-
container in it (see cal-1 in Figure 1), and is used for
the algorithms for volume recognition, as described
in detail below.
To achieve precise measurements of volumes,
our algorithm performs two essential steps both
during calibration and scanning. First, the point
cloud of the parcel-container is scanned (cal-2 /
scan-1). Second, the points of the container are
extracted from the scene by filtering out the back-
ground (cal-3 / scan-2). Based on these intermediate
steps, the volume of a loaded parcel-container can
finally be calculated by simply subtracting the vol-
ume of the empty parcel-container from the volume
of the loaded container (scan-3).
Overview of RCM. In addition to SNAP, we
developed the Android application Roll Container
Manager (RCM) to control the Kinect and to inte-
grate the prototype in a user-friendly way into given
business processes to perform the scan process. As
mentioned above, such integration requires a unique
identification of the parcel-containers. This can be
cal-1
scan background
cal-2
scan empty
roll container
cal-3
extract empty roll
container and
calculate volume
scan-1
scan loaded
container
scan-2
extract loade d roll
container and
calculate volume
scan-3
calculate cargo
volume
rcm-1 ide ntify container
rcm-2 start scan rcm-3 confirm results rcm-4 scans overview
SNAPRCM
Figure 1: Abstract process for volume recognition.
Real-timeCargoVolumeRecognitionusingInternet-connected3DScanners
325

done via the app by leveraging human-in-the-loop
knowledge (e.g., to make sure that the 3D scanner
indeed scans the parcel-container of interest).
To integrate volume recognition into a given
business process, users are able to control the scan-
ning of a loaded parcel-container by performing
three steps within the RCM-App. First, they identify
the container by scanning a QR-Code (rcm-1 in
Figure 1) to ensure correct data-matching to the
business-process. Following this, SNAP can be
started from the app to scan and analyze the volume
of the payload of the parcel-container (rcm-2). This
also ensures that the containers are only scanned
after their loading has been completed. The results
of volume scanning are directly sent to the RCM and
is visualized for immediate confirmation by users.
By confirming the results (rcm-3), users indicate
they have checked the correctness of results. Results
are then made available to the dispatcher responsible
for process management (dispatchers in turn may
employ control centers for process management). In
addition, users may access an overview of the scans
(rcm-4) where they can compare planned and
scanned container amounts in a chart and review the
details of past scans in a card view.
5 QUANTITATIVE EVALUATION
In the following, we discuss the design, execution,
and results of the conducted quantitative evaluation
of SNAP.
5.1 Experimental Design
We follow the definition of (Prechelt 2001) and
distinguish between dependent, independent, and
confounding variables. Our goal is to measure accu-
racy (relative error of measurement). We will inves-
tigate how the dependent variables are influenced by
(variations of) the independent variables and wheth-
er there are confounding variables that might indi-
cate wrong estimations.
5.1.1 Variables in the Experiment
Dependent Variable. We observe one dependent
variable during our experiment:
Accuracy of the recognition results. It is meas-
ured in the form of the relative error of meas-
urement:
error
measuredvolume realvolume
realvolume
(1)
Independent variables. During the experiment,
three independent variables are systematically varied
to analyze their influence on the dependent variable:
Horizontal distance between the parcel-container
and the Kinect sensor. The analysis of this varia-
ble is crucial in practical settings since it takes
some effort for the user to take care of the exact
position when containers are scanned.
Angle of the parcel-container to the Kinect sen-
sor. This is measured as follows: The vertical
line from the Kinect to the ground is the basis.
From this point, we build a radian measure to
span the field of view of the Kinect sensor. The
angle from orthogonal lines of the radian meas-
ure to the container front is the independent vari-
able. For the sake of simplicity, we took only one
line in the center of the Kinect field of view.
Loading volume, i.e., we want to measure wheth-
er and how the actual loading volume influences
the accuracy of volume recognition.
5.1.2 Variation of Independent Variables
In order to control the variation of the independent
variables, we determined the granularity of changes
and the order in which the variables are modified.
Granularity. For each of the independent varia-
bles, we determined the levels for which we want to
observe the influence on the dependent variable. The
number of levels has been chosen such that we ob-
tain high significance along with feasible experi-
mental efforts (see Table 1).
For the horizontal distance of the container, the
maximal and minimal levels have been restricted by
the Kinect environment and the available space.
Concerning the angle of the container for settings
with 20° and -20° the internal space of the container
is completely visible for the Kinect. For the actual
loading volume, further variations beyond the ones
used did not lead to new or different results.
Ordering of variable variation. According to
the previously described granularities, each combi-
nation of the different levels has been evaluated,
leading to 100 combinations in total. Each round
consists of 35 measurements, which makes 3500
measurements in total.
Table 1: Independent Variables and Assignments.
Horiz. Distance [m] 2.58, 2.1, 1.62, 1.3
Angle [°] 0, 10, 20, –10, –20
Loading Volume [m³] 0.001, 0.131, 0.262, 0.481, 0.642
ENASE2015-10thInternationalConferenceonEvaluationofNovelSoftwareApproachestoSoftwareEngineering
326
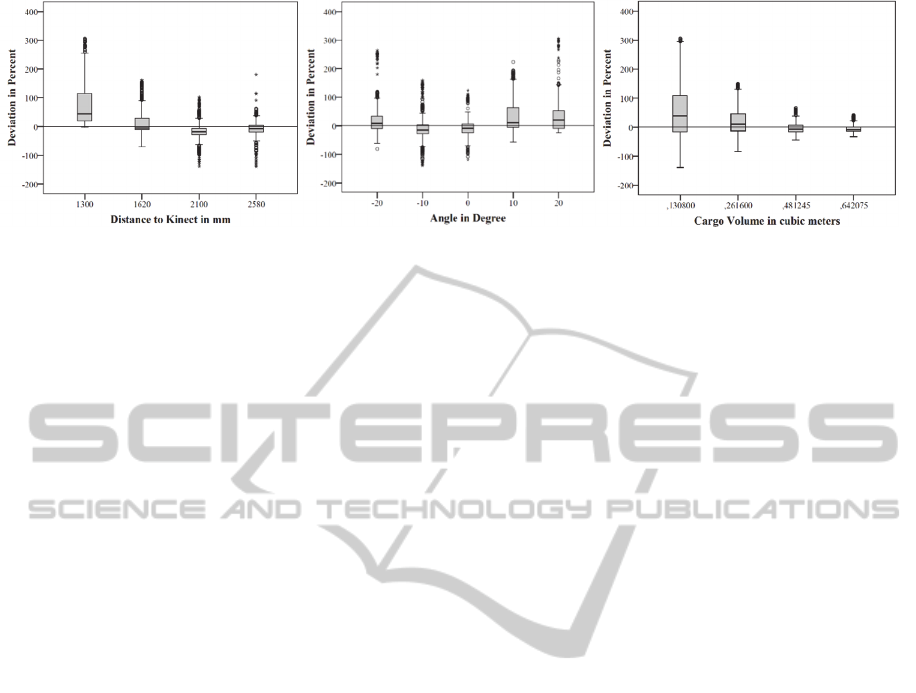
Figure 2: Distance and Deviation. Figure 3: Angle and Deviation. Figure 4: Cargo Volume and Deviation.
5.1.3 Confounding Variables
During the experiment, we observed three main
confounding variables:
The background and changes in the background
might cause wrong volume estimations. To avoid
this, a static background must be guaranteed dur-
ing the experiment.
The infrared sensor of the Kinect is sensitive to
daylight. Hence, the experiment location has
been protected from daylight.
The surface of the parcel-container either reflects
or refracts the infrared light. To remedy this, the
inner container surface has been covered with
cardboard.
5.1.4 Technical Setting and Constraints
The Kinect is located on a tripod at a height of 2.9m,
the inclination angle is -38°. The range of the view-
ing area of the Kinect is 57° horizontal and 43° ver-
tical. The data are processed by a computer equipped
with Intel i7 3770, nVidia GT630, 16GB of memory,
and Windows 7 Professional x64 SP1 as the operat-
ing system. As software, we use Microsoft Visual
Studio 2012, .Net Framework 4.5, Microsoft Kinect
SDK 1.8 including the Developer Toolkit, and XNA
Gamestudio 4.0.
The parcel-container must be located completely
in the viewing area. The size of the parcel-container
is 0.92m * 1.13m * 1.67m (inside) and 0.95m *
1.2m * 1.9m (outside). The open side of the contain-
er is in front of the Kinect such that the inner space
of the container is visible. The parcel-container must
be optimally loaded, i.e., without empty spaces be-
tween parcels. Settings of the Kinect such as resolu-
tion, transformations, and algorithms are fixed.
5.1.5 Expected Effects
When designing the experiment, we identified ex-
pected effects caused by the variation of the inde-
pendent variables, leading us to formulate three
hypotheses (H1 – H3):
H1/H2: “Variations of the distance/angle have no
influence on the error of measured loading vol-
ume and real loading volume.” The dis-
tance/angle determine the geometric position of
objects. Variations of them are variable factors
that are handled by Kinect algorithms.
H3: “The larger the real loading volume is the
less are the relative measurement errors.” The
volume is computed as the difference between
the volume of the loaded container and the vol-
ume of the empty container. Due to some general
variations in the scanning, lower volume has
higher impact on deviations.
5.2 Experimental Results
In total, we collected 3.5GB of raw data during ex-
periment execution, covering 3345 out of 3500 pos-
sible measurements. For the analytics, we used IBM
SPSS Statistics v22.0.0.0 x64.
First, we analyzed the influence of the geomet-
rical position of the container on the accuracy
(measurement error).
Figure 2 and Figure 3 show the influence of the
distance and the angle of the container to the Kinect.
Figure 2 indicates that the Kinect delivers a low
error in the 2100mm and 2580mm range. However,
the error increases as the container gets closer to the
Kinect sensor (1620mm and 1300mm). The angle
analysis (Figure 3) shows a similar picture, with the
smallest error being at -10° and 0° and increasing
the further it moves away from the zero point.
We also analyzed the influence of the amount of
payload. Figure 4 shows that the more payload is
used, the less relative measurement error we have,
starting from a very high error for lowest payload up
to a very small error for highest payload.
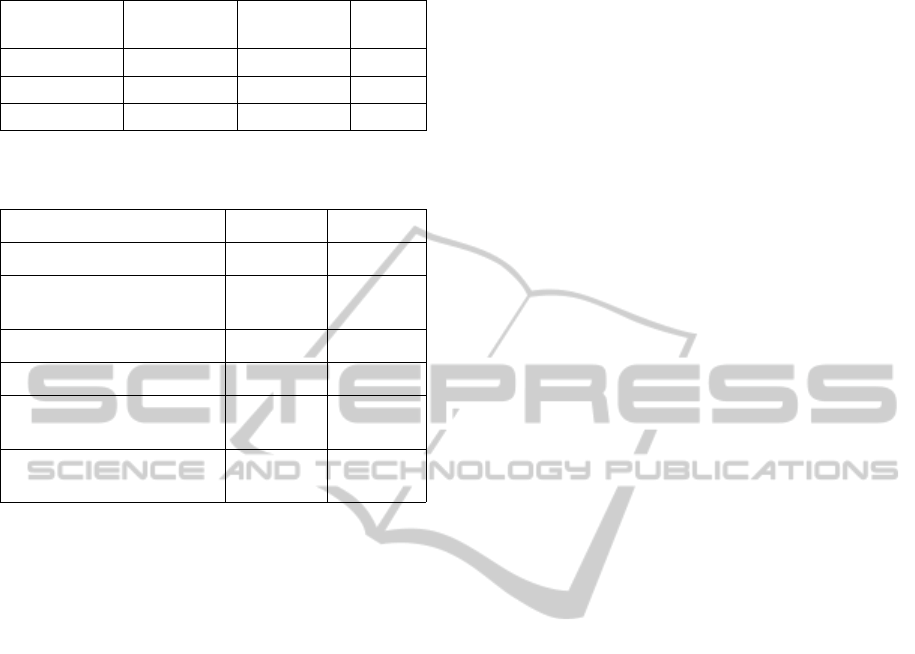
In general, statistical influence of the independ-
ent variables is highly significant. Table 2 shows a
more detailed analysis. Based on these results, we
Real-timeCargoVolumeRecognitionusingInternet-connected3DScanners
327
constructed a best case scenario where we only
picked the best values for the independent variables
(see Table 3).
Comparing the results of the best case with the
average case, a significant lower standard deviation
can be identified in the best case. This means that
with the choice of optimal variables, it is possible to
heavily reduce the deviation to a minimum. Even if
an optimal position for the container (angle and
distance) cannot be ensured, a low level of deviation
can be observed for high amounts of payload. Com-
paring a 14.90 standard deviation of the average case
for the maximum payload (0.642m³) used and a 7.31
standard deviation in the best case with the same
amount of payload, which compares to a 28.84 std.
deviation in the average case with distance set to
2.58m and 37.59 std. deviation in the average case
with angle set to 0°.
5.3 Discussion
While error values showed a variance of only 15%
in the best case scenario, error and variance in gen-
eral showed a significant movement off the desired
zero baseline. This behavior is mainly caused by the
distance variables to the Kinect and the angle of the
container, leading to a stronger geometrical distor-
tion. The more the container moves off the optimal
orthogonal view, the more SNAP has problems with
recognizing the front surface, leading to faulty vol-
ume measurements. Therefore, the user is advised to
place the container as close to the optimal spot as
possible to ensure accurate measurements.
Also, the amount of payload has a high influence
on deviation. The more payload was used, the lower
the deviation was. This leads to more results that are
accurate the higher the payload is. In practice, users
strive to pack the parcel-containers as full as possi-
ble, thus we can expect relatively ideal situations for
this independent variable.
Considering internal validity, in total, three con-
founding variables have been detected. After the
experiment, a manual review was performed to ex-
hibit evidence of further confounding variables, but
none with noticeable impact on the results have been
observed. Considering external validity, a couple of
adjustments had to be done to ensure a feasible
workload and functionality. This includes using a
fixed set of configuration parameters for the volume
algorithms whose effects have yet to be determined.
Also, the container had to be lined with cardboard,
which is a very unlikely preparation for a practical
use. This is yet an unlikely scenario, so either easy
to apply methods or sensing technologies without
this weakness need to be tested. The Kinect also
needs to be placed in a static environment as chang-
ing of objects within the environment makes a recal-
ibration of the background necessary.
6 QUALITATIVE EVALUATION
We evaluated our approach regarding usefulness,
usability, and adoption by performing a survey study
(questionnaire-based) with domain experts from the
parcel logistics domain during a live demonstration
of our prototype.
For each question of the questionnaire, we of-
fered five choices reflecting the degree of approval,
ranging from “strongly disagree”, “disagree”, “neu-
tral”, and “agree” to “strongly agree”. A partici-
pant’s choice was quantified (1 for strongly agree,
0.75 for agree, 0.5 for neutral, 0.25 for disagree and
0 for strongly disagree), summarized and divided by
the mean value, ending up with a single degree of
approval. The result is summarized in Table 4.
The responses from domain experts indicate the
usefulness of our approach. Especially, knowing the
container volume in operative transport management
(79.2%) was perceived of high importance.
Also, the usability of our volume scanning solu-
tion in practical environments has been confirmed,
e.g., by a high approval of the fact that only a short
training period and only few instructions are neces-
sary. Finally, the analysis of potential adoption indi-
Table 2: Significance analysis.
Independent
Variable
t Significance Sign.
Level
Distance -33.4492941 2.3527E-205 **
Angel 9.877020051 1.26671E-22 **
Cargo Volume -24.4620010 1.8005E-119 **
Table 3: Accuracy (measurement error) for the best case
and the average case.
best case avg. case
std. deviation 7.31 61.41
std. error
(95% confidence interval)
0.61 1.18
mean value -16.68 17.44
median -17.94 -1.87
minimum level
(95% confidence interval)
-17.90 15.12
maximum level
(95% confidence interval)
-15.46 19.76
ENASE2015-10thInternationalConferenceonEvaluationofNovelSoftwareApproachestoSoftwareEngineering
328

cated that there is a high interest to apply our Kinect
approach in general (63.9%).
However, the appropriateness of the provided
functionality for the expert’s individual businesses
received an agreement of only 54.2 %. This may
partially be attributed to the fact that the IT permea-
tion of transport and logistics industry is still quite
low in many areas and thus it may be difficult for
domain individuals to relate to their current state of
practice. Another mentioned aspect was an eventual
vulnerability of the approach to soiled sensors.
Table 4: Results of expert evaluation.
Usefulness
The amount of roll containers is important
for operative transport management.
72.2 %
The used capacity (volume) of each roll
container is important for operative transport
management.
79.2 %
The interaction with the Kinect via mobile
apps is useful.
70.8 %
Usability
Using the automatic volume scan (e.g., with
the Kinect) would only require a short train-
ing period.
76.7 %
Using the automatic volume scan (e.g., with
the Kinect) would require some instructions.
68.3 %
Adoption
I would like to work with the automatic
volume scan (e.g., with the Kinect).
63.9 %
The provided functionality of the automatic
volume scan (e.g., Kinect) is appropriate for
my business.
54.2 %
7 SUMMARY AND CONCLUSION
This paper presented an approach for using Mi-
crosoft Kinect, a low-cost, off-the-shelf 3D scanner,
to measure the cargo volume of a parcel-container in
real-time. To quantitatively assess accuracy of pay-
load volume recognition, we performed controlled
experiments. The evaluation showed a high accuracy
with only 15% relative error under optimal circum-
stances. However, it also revealed some weaknesses
when the geometrical position of the container dif-
fers from the optimal position. Complementing this
quantitative evaluation of our solutions, we per-
formed qualitative evaluations through a survey
study with domain experts, which indicated the
usefulness and applicability of our approach. It thus
has a high potential for practical use.
In the meantime, Kinect for Windows v2 was re-
leased and promises further improvement of our
approach, especially concerning overall accuracy,
noise-reduction. Furthermore, we are evaluating
several other parameters to help improve accuracy
and performance of volume recognition. As an on-
going step, we implement a second algorithm with
Euclidean Cluster Extraction and repeat the experi-
ments for comparison. An interesting further aspect
might be to apply our solution to the Food Supply
Chain, e.g., Big Box
2
. This would allow scanning
parcel-containers containing objects with the same
size and thus calculate the exact amount of objects.
Finally, we are going to bring our solution into
the cloud, using distributed thin-clients with con-
nected Kinect for Windows v2. This facilitates scal-
ing our solution to extend the visible space and scan
multiple containers as well as outsourcing computa-
tional-intensive algorithms.
ACKNOWLEDGEMENTS
The research leading to these results has received
funding from the European Union's Seventh Frame-
work Program FP7/2007-2013 under grant agree-
ment 604123 (FIspace) and from the EFRE co-
financed operational program NRW.Ziel2 under
grant agreement 005-1010-0012 (LoFIP).
REFERENCES
Bondarev, E. et al., 2013. On photo-realistic 3D recon-
struction of large-scale and arbitrary-shaped environ-
ments. In 2013 IEEE Consumer Communications and
Networking Conference (CCNC). 2013 IEEE Con-
sumer Communications and Networking Conference
(CCNC). pp. 621–624.
Delaunay, B., 1934. Sur la sphère vide. Bulletin of Acade-
my of Sciences of the USSR, (6), pp.793–800.
Dutta, T., 2012. Evaluation of the Kinect
TM
sensor for 3-D
kinematic measurement in the workplace. Applied er-
gonomics, 43(4), pp.645–649.
Freedman, B. et al., 2012. Depth mapping using projected
patterns, Google Patents. Available at:
https://www.google.com/patents/US8150142.
Izadi, S., Kim, D., et al., 2011. KinectFusion: Real-time
3D Reconstruction and Interaction Using a Moving
Depth Camera. In Proceedings of the 24th Annual
ACM Symposium on User Interface Software and
Technology. UIST ’11. New York, NY, USA: ACM,
pp. 559–568. Available at: http://doi.acm.org/
2
http://www.europoolsystem.com/128/Big-Box
Real-timeCargoVolumeRecognitionusingInternet-connected3DScanners
329

10.1145/2047196.2047270 (Accessed June 11, 2014).
Izadi, S., Newcombe, R.A., et al., 2011. KinectFusion:
real-time dynamic 3D surface reconstruction and in-
teraction. In ACM SIGGRAPH 2011 Talks. SIG-
GRAPH ’11. New York, NY, USA: ACM, pp. 23:1–
23:1. Available at: http://doi.acm.org/10.1145/
2037826.2037857 (Accessed October 10, 2013).
Kainz, B. et al., 2012. OmniKinect: real-time dense volu-
metric data acquisition and applications. In Proceed-
ings of the 18th ACM symposium on Virtual reality
software and technology. VRST ’12. New York, NY,
USA: ACM, pp. 25–32. Available at:
http://doi.acm.org/10.1145/2407336.2407342 (Ac-
cessed October 10, 2013).
Khoshelham, K., 2011. Accuracy Analysis of Kinect
Depth Data. ISPRS Journal of Photogrammetry and
Remote Sensing, (XXXVIII - 5/W12), p.6.
Kückelhaus, M. et al., 2013. Low-cost sensor technology -
A DHL perspective on implications and use cases for
the logistics industry M. Wegner, ed. Available at:
http://www.dhl.com/content/dam/downloads/g0/about
_us/innovation/CSI_Studie_Low_Sensor.PDF.
Litomisky, K. & Bhanu, B., 2013. Removing Moving
Objects from Point Cloud Scenes. In X. Jiang et al.,
eds. Advances in Depth Image Analysis and Applica-
tions. Lecture Notes in Computer Science. Springer
Berlin Heidelberg, pp. 50–58. Available at:
http://link.springer.com/chapter/10.1007/978-3-642-
40303-3_6 (Accessed June 25, 2014).
Metzger, A. et al., 2014. Comparing and Combining Pre-
dictive Business Process Monitoring Techniques.
IEEE Transactions on Systems, Man, and Cybernetics:
Systems, Early Access Online.
Microsoft, 2014. Kinect for Windows. Available at:
https://www.microsoft.com/en-us/kinectforwindows/.
Microsoft Developer Network, 2014. Kinect Fusion.
Available at: http://msdn.microsoft.com/en-
us/library/dn188670.aspx.
Microsoft Developer Network, 2013. Kinect SDK with
Kinect Fusion. Available at: http://blogs.msdn.com/b/
kinectforwindows/archive/2013/03/18/the-latest-
kinect-for-windows-sdk-is-here.aspx.
Newcombe, R.A. et al., 2011. KinectFusion: Real-time
dense surface mapping and tracking. In 2011 10th
IEEE International Symposium on Mixed and Aug-
mented Reality (ISMAR). 2011 10th IEEE Internation-
al Symposium on Mixed and Augmented Reality (IS-
MAR). pp. 127–136.
Prechelt, L., 2001. Kontrollierte Experimente in der Soft-
waretechnik: Potenzial und Methodik, Springer-Verlag
GmbH.
Rasmussen, C. et al., 2013. Towards functional labeling of
utility vehicle point clouds for humanoid driving. In
2013 IEEE International Conference on Technologies
for Practical Robot Applications (TePRA). 2013 IEEE
International Conference on Technologies for Practical
Robot Applications (TePRA). pp. 1–6.
Roth, H. & Vona, M., 2012. Moving Volume KinectFu-
sion. In British Machine Vision Association, pp.
112.1–112.11. Available at: http://www.bmva.org/
bmvc/2012/BMVC/paper112/index.html (Accessed
June 23, 2014).
Smisek, J., Jancosek, M. & Pajdla, T., 2011. 3D with
Kinect. In 2011 IEEE International Conference on
Computer Vision Workshops (ICCV Workshops). 2011
IEEE International Conference on Computer Vision
Workshops (ICCV Workshops). pp. 1154–1160.
Whelan, T. et al., 2012. Kintinuous: Spatially Extended
KinectFusion. Available at: http://dspace.mit.edu/
handle/1721.1/71756 (Accessed June 23, 2014).
Xingyan Li et al., 2012. Using Kinect for monitoring
warehouse order picking operations. In Proceedings of
Australasian Conference on Robotics and Automation.
Australasian Conference on Robotics and Automation.
Victoria University of Wellington, New Zealand.
Xu, D. et al., 2012. Kinect-Based Easy 3D Object Recon-
struction. In W. Lin et al., eds. Advances in Multime-
dia Information Processing – PCM 2012. Lecture
Notes in Computer Science. Springer Berlin Heidel-
berg, pp. 476–483. Available at:
http://link.springer.com/chapter/10.1007/978-3-642 -
34778-8_44 (Accessed October 10, 2013).
Zeng, M. et al., 2012. A Memory-Efficient KinectFusion
Using Octree. In S.-M. Hu & R. R. Martin, eds. Com-
putational Visual Media. Lecture Notes in Computer
Science. Springer Berlin Heidelberg, pp. 234–241.
Available at: http://link.springer.com/chapter/
10.1007/978-3-642-34263-9_30 (Accessed October
10, 2013).
Zhou, Q.-Y. & Koltun, V., 2013. Dense scene reconstruc-
tion with points of interest. ACM Trans. Graph., 32(4),
pp.112:1–112:8.
ENASE2015-10thInternationalConferenceonEvaluationofNovelSoftwareApproachestoSoftwareEngineering
330
