GOTA
Using the Google Similarity Distance for OLAP Textual Aggregation
Mustapha Bouakkaz
1
, Sabine Loudcher
2
and Youcef Ouinten
1
1
LIM Laboratory, University of Laghouat, Laghouat, Algeria
2
ERIC Laboratory, University of Lyon 2, Lyon, France
Keywords:
OLAP, Textual Data, Aggregation Function, Google Similrity.
Abstract:
With the tremendous growth of unstructured data in the Business Intelligence, there is a need for incorporating
textual data into data warehouses, to provide an appropriate multidimensional analysis (OLAP) and develop
new approaches that take into account the textual content of data. This will provide textual measures to users
who wish to analyse documents online. In this paper, we propose a new aggregation function for textual data
in an OLAP context. For aggregating keywords, our contribution is to use a data mining technique, such as k-
means, but with a distance based on the Google similarity distance. Thus our approach considers the semantic
similarity of keywords for their aggregation. The performance of our approach is analyzed and compared to
another method using the k-bisecting clustering algorithm and based on the Jensen-Shannon divergence for
the probability distributions. The experimental study shows that our approach achieves better performances in
terms of recall, precision,F-measure complexity and runtime.
1 INTRODUCTION
The decision process in many sectors such as health,
safety, security and transport is complex process with
many uncertainties. In a such cases, the decision mak-
ers require appropriate tools for diagnosis so as to
perform, validate, justify, evaluate and correct the de-
cisions they must make. Online Analytical Process-
ing (OLAP) has emerged to assist users in the deci-
sion making process. The model building in OLAP
is based on the multidimensional structure which fa-
cilitates the visualization and the aggregation of data.
This model represents both the subjects to analysis
(facts), the indicators to assess the facts (measures)
and the features to be analysed (dimensions). A di-
mension can also have a hierarchy with different lev-
els. In order to navigate into data, there are OLAP
operations such as roll-up and drill-down. With a roll-
up operation a user can change the granularity of data
and an aggregation function is needed to aggregate the
measure. Many functions, such as maximum, mini-
mum, average are applied to aggregate data according
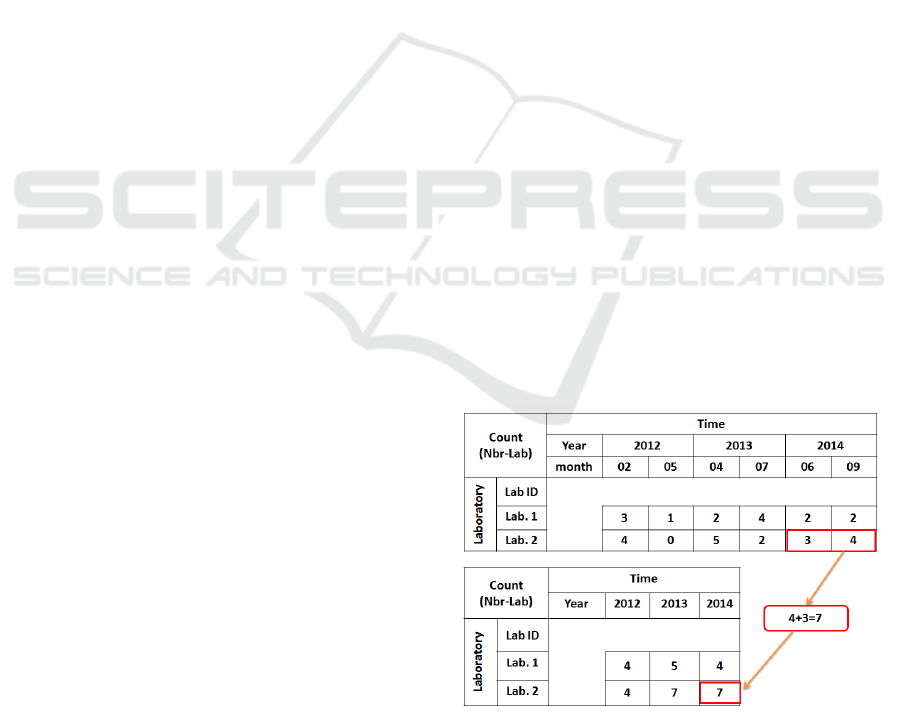
to the level of detail, by changing the granularity. As
shown in the example of the figure 1, a decision maker
analyses the number of scientific papers published by
laboratories in each month. In order to have a top
level view, he changes the granularity level by pre-
Figure 1: Multidimensional analysis of scientific papers.
senting them per each year. That means, the monthly
values are aggregated into a value for each year.
According to (Sullivan, 2001), OLAP has robust
solutions for numerical data. However, (Tseng and
Chou, 2006) and (Ravat et al., 2007) proved that only
20% of corporate information system data are used
and exploited, whereas the rest of useful information
is non-additive data such as textual data. These evo-
lutions in the characteristics and in the nature of data
make OLAP tools unsuitable for most new types of
data. For example textual data are out of reach of
121
Bouakkaz M., Loudcher S. and Ouinten Y..
GOTA - Using the Google Similarity Distance for OLAP Textual Aggregation.
DOI: 10.5220/0005357201210127
In Proceedings of the 17th International Conference on Enterprise Information Systems (ICEIS-2015), pages 121-127
ISBN: 978-989-758-096-3
Copyright
c
2015 SCITEPRESS (Science and Technology Publications, Lda.)

OLAP analysis. Recently, document warehousing (a
set of approaches for analysis, sharing, and reusing
unstructured data, such as textual data or documents)
has become an important research field. Many issues
are still open but we are more interested in taking into
account the textual content of data in the OLAP anal-
ysis. In this context the measure can be textual (like
a list of keywords), so adapted aggregation functions
for textual measure are needed.
In this paper, the main contribution is to provide
an OLAP aggregation function for textual measure.
This function allows an analysis based on keyword
measures for a multidimensional document analysis.
From the literature of keywords aggregation, we clus-
ter the existing methods into four groups. The first
one is based on linguistic knowledge, the second one
on external knowledge, the third is based on graphs,
while the last one is based on statistical methods.
Our approach falls in the latter category. The exist-
ing approaches using statistical methods focus mainly
on the frequencies of keywords. However, the ap-
proach that we propose uses a well known data min-
ing technique, which is the k-means algorithm, with
a distance based on the Google similarity distance.
The Google similarity distance has been proposed by
Google and has been tested in more than eight bil-
lion of web pages (Cilibrasi and Vitanyi, 2007). The
choice of this distance is motivate by the fact that
it takes into account the semantic similarity of key-
words. We name our approach GOTA Google sim-
ilarity distance in OLAP Textual Aggregation. The
performance of our approach is analyzed and com-
pared to another method using the k-bisecting cluster-
ing algorithm with the Jensen-Shannon divergence for
the probability distributions (Wartena and Brussee,
2008). The rest of the paper is organized as follows:
Section 2 is devoted to related work to textual ag-
gregation. In Section 3, we introduce our proposed
approach. In Section 4, we present the experimental
study which includes a comparison with another ap-
proach. Finally, Section 5 concludes the paper and
provides future developments.
2 RELATED WORK
In literature, there are many approaches for aggregat-
ing keywords. We cluster them into four categories,
the first one is based on linguistic knowledge; the sec-
ond one is based on the use of external knowledge, the
third one is based on graphs, and the last one uses sta-
tistical methods.
The approaches based on linguistic knowledge
consider a corpus as a set of the vocabulary mentioned
in the documents; but the results in this case are some-
times ambiguous. To overcome this obstacle, few
techniques based on lexical knowledge and syntactic
knowledge previews have been introduced. In (Pou-
dat et al., 2006) and (Kohomban and Lee, 2007), the
authors proposed a classification of textual documents
based on scientific lexical variables of the discourse.
Among these lexical variables, they chose nouns be-
cause they are more likely to emphasize the scientific
concepts, rather than adverbs, verbs or adjectives.
The approaches based on the use of external
knowledge select certain keywords that represent a
domain. These approaches often use knowledge such
as an ontology. The authors in (Ravat et al., 2007)
proposed an aggregation function that takes a set of
keywords as input and the output is another set of ag-
gregated keywords. They assumed that both the ontol-
ogy and the corpus of documents belong to the same
domain. The authors in (Oukid et al., 2013) , pro-
posed an aggregation operator Orank (OLAP rank)
that aggregated a set of documents by ranking them
in a descending order, they used a vector space rep-
resentation. In (Subhabrata and Sachindra, 2014), the
authors developed a textual aggregation model using
ontology and they build keywords ontology tree.
The approaches based on graphs used keywords
to construct the keywords-graph. The nodes represent
keywords obtained after pre-processing, candidate se-
lection and edge representation. After the graph rep-
resentation step, different types of keywords-ranking
approaches have been applied. The first proposed
approach in (Mihalcea and Tarau, 2004) is called
TextRank, where graph nodes are the keywords and
edges represent the co-occurrence relations between
the keywords. The idea is, if a keyword gets linked
from a large number of other keywords, then that key-
word is considered as important.
The approaches based on statistical methods, used
the occurrence frequencies of terms and the correla-
tion between terms. In (Kimball, 2003), the author
proposed the method LSA (Latent Semantic Anal-
ysis) in which the corpus is represented by a ma-
trix where the rows represent the documents and the
columns represent the keywords. An element of the
matrix represents the number of occurrences of a
word in a document. After decomposition and reduc-
tion, this method provides a set of keywords that rep-
resent the corpus. The authors of (Hady et al., 2007)
proposed an approach called TUBE (Text-cUBE) to
discover the associations among entities. The cells of
the cube contain keywords, and they attach to each
keyword an interestingness value. (Bringay et al.,
2010) proposed an aggregation function based on a
new adaptive measure of t f .id f which takes into ac-
ICEIS2015-17thInternationalConferenceonEnterpriseInformationSystems
122
count the hierarchies associated to the dimensions.
(Wartena and Brussee, 2008) used the k-bisecting
clustering algorithm based on the Jensen-Shannon di-
vergence of probability distributions described in (Fu-
glede and Topsoe, 2004). Their method starts by se-
lecting two elements that are far apart as the seeds
of the two first clusters. Each one of the other el-
ements is then assigned to the cluster of the closest
seed. Once all the elements have been assigned to
clusters, the centres of both clusters are computed.
The new centres are used as new seeds for finding
new two clusters and the process is repeated until
each of the two new centres converge up to some
predefined precision. If the diameter of a cluster is
larger than a specified threshold value, the whole pro-
cedure is applied recursively to that cluster. In (Ravat
et al., 2008) the authors proposed a second aggrega-
tion function called TOP-Keywords to aggregate key-
words. They computed the frequencies of terms using
the t f .id f function, and then they selected the first k
most frequent terms. The authors of (Frantziy et al.,
2000) proposed the C-Value algorithm, which creates
a ranking for potential keywords by using the length
of the phrases which contain keywords, and their fre-
quencies. In (Elghannam and Elshishtawy, 2013) the
authors proposed a technique for extracting summary
sentences for multi-document using the weight of sen-
tences and documents.
The approaches in the first three categories use ad-
ditional information (linguistic and external knowl-
edge). In an OLAP analysis we don’t have system-
atically knowledge about the studied domain. So we
choose to propose an aggregation function without us-
ing additional information. We use a well-known data
mining technique which is the k-means algorithm but
with a new distance : the Google similarity distance
introduced by Google Lab and (Cilibrasi and Vitanyi,
2007). The Google similarity distance is a semantic
distance, it has been tested in more than eight billion
of web pages. In this paper, we are applying it for se-
mantic textual aggregation of keywords in an OLAP
context.
3 PROPOSED METHOD
We want to create a suitable environment for the on-
line analysis of documents by taking into account the
textual content of data. In Text OLAP, the measure
can be textual such as a list of keywords. When a user
wants to obtain a more aggregate view of data, he does
a roll-up operation which needs an adapted aggrega-
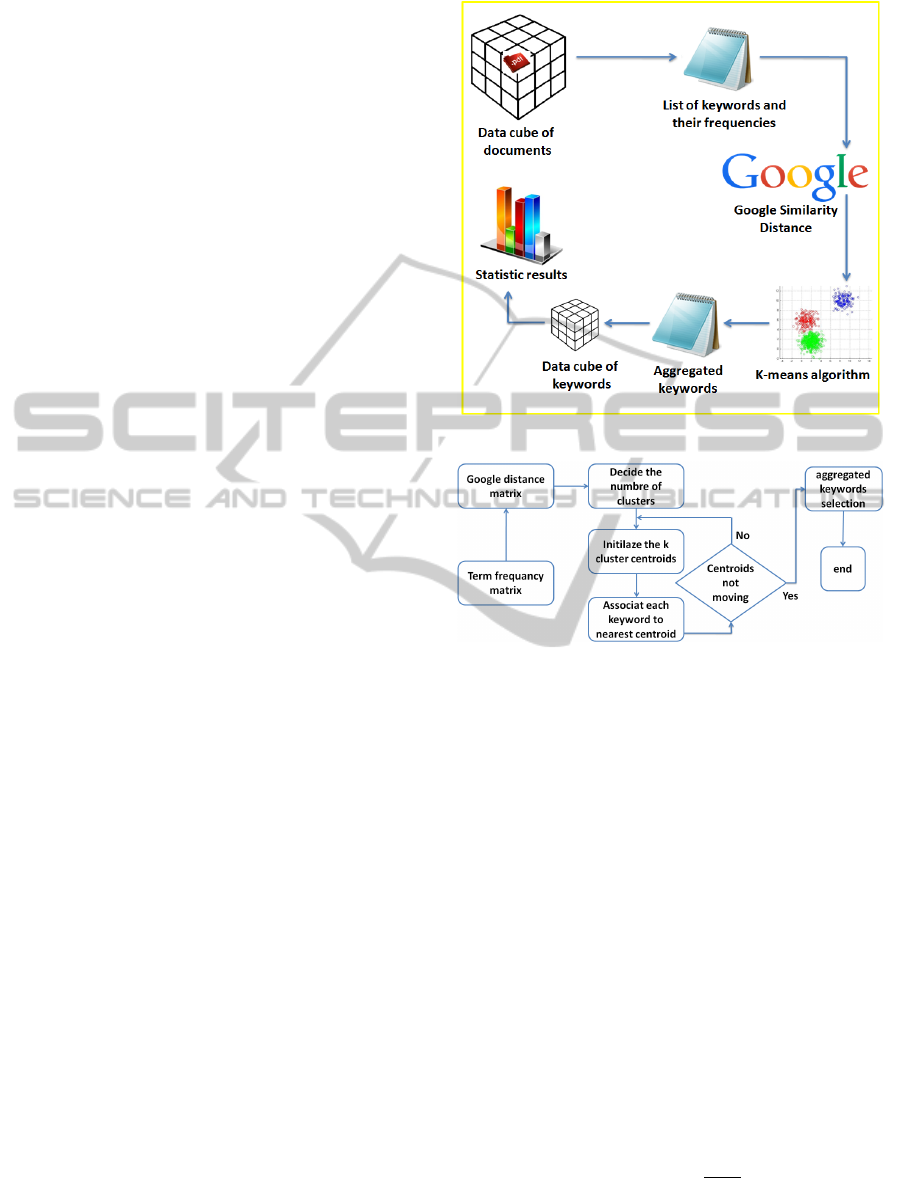
tion function. We introduce our approach step-by-
step to layout our design and implementation meth-
Figure 2: System architecture.
Figure 3: Steps of GOTA run.
ods. Our approach is composed of three main parts,
including: (1) extraction of keywords with their fre-
quencies; (2) construction of the distance matrix be-
tween words using the Google similarity distance;
(3) applying the k-means algorithm to distribute key-
words according to their distance, and finally (4) se-
lection the k aggregated keywords. Figure 2 illustrates
our system architecture.
3.1 Extraction of Keywords
The set of terms T is obtained after cleaning stop
words, the lemmatization and the selection of the
most significant terms. There are different ways to
select such terms, we use the weight (frequency) of
the term because it represents the degree of its impor-
tance in the document. Customary in this step, only
words with a frequency greater than 30% are taken.
In our case we take the same threshold to extract per-
tinent terms. This weights are defined as follows:
∀t
i
∈ T, w
i
=
t f
i
∑
t f
i
(1)
Where w
i
is the weight of term t
i
, t f
i
is the fre-
quency of occurrence of term t
i
in the corpus.
GOTA-UsingtheGoogleSimilarityDistanceforOLAPTextualAggregation
123
3.2 Construction of the Google Distance
Matrix
With a collection of many documents, their corre-
sponding vectors can be stacked into a matrix. By
convention, document vectors form the rows, while
the vector elements (called keywords) form the ma-
trix columns. With n documents and m keywords,
we have an nxm matrix and we will use the nota-
tion DT M[n,m]. An element of the matrix repre-
sents the frequency of a term j in a document i. Let
DT M(i, j) = t f
i j
where t f
i j
is the frequency of occur-
rence of term t
j
in document d
i
.
We use the Google Similarity Distance (GSD) pro-
posed by (Cilibrasi and Vitanyi, 2007) to construct
the distance matrix (GDM) between keywords. It is
a symmetric square matrix where rows and columns
represent the keywords. The Google Similarity Dis-
tance, GSD(x, y) is defined as follows:
Max(logH(x), logH(y)) − logH(x, y)
logN − min(logH(x), logH(y))
(2)
The attributes H(x) and H(y) represent the number of
term frequency of the keywords x and y, respectively.
The attribute H(x, y) represents the number of docu-
ments containing both x and y and N is the number of
documents in the corpus.
3.3 Clustering
We use the k-means algorithm for clustering key-
words into clusters. The number of clusters k is de-
fined by the user, and it also gives the number of ag-
gregated keywords. The first step is to define k cen-
troids, one for each cluster, by choosing k keywords
that are as far apart as possible. The next step is to
take each point belonging to the given data set and
to associate it to the nearest centroid according to
their distance in the Google distance matrix. When
no point is pending, the first step is completed and we
re-calculate the k new centroids of the clusters. The
process is then repeated with the k new centroids. The
k centroids change their location step by step until no
more changes are done. The process ends up with the
k clusters.
3.4 Aggregated Keyword Selection
After the clustering, we select from each cluster the
keyword that has the highest value of H as an aggre-
gated keyword. H is defined in the Google Similarity
Distance (GSD)and represents the number of docu-
ments containing the keyword. Figure 3 describes the
different steps of our algorithm.
3.5 Example
In our running example of scientific articles, the mea-
sure is a list of keywords. There are thirteen (13) doc-
uments D
1
, ..., D
13
and ten (10) terms: {XML, OLAP,
Datamining, Query, Datawarehouse, Document, Sys-
tem, Cube, Function, Network}. The frequency ma-
trix is defined in Table 1. The Google Similarity Dis-
tance between keywords is given in Table 2. The use
of k-means clustering produces the following results:
C1{M2, M5}, C2{M4, M8, M10}, C3{M1, M3, M6,
M7, M9}.
Table 1: Document Term Matrix.
M1 M2 M3 M4 M5 M6 M7 M8 M9 M10
D1 10 9 22 15 9 20 15 9 28 39
D2 15 22 26 0 9 16 11 0 25 0
D3 5 15 0 15 22 0 15 0 0 0
D4 0 16 0 0 15 10 0 0 0 0
D5 16 12 2 13 16 12 0 12 2 0
D6 21 0 19 21 17 9 0 0 10 0
D7 13 0 14 0 0 15 1 0 17 0
D8 17 0 8 0 0 8 0 18 20 0
D9 22 14 0 0 14 21 0 17 0 0
D10 0 7 0 0 7 0 15 18 20 0
D11 5 18 10 5 15 15 15 18 20 0
D12 20 4 7 17 4 7 0 5 3 105
D13 1 10 11 1 10 17 0 16 10 0
Table 2: Google Similarity Distance Matrix.
M1 M2 M3 M4 M5 M6 M7 M8 M9 M10
M1 0
M2 1.2 0
M3 0.5 1.6 0
M4 0.7 0.8 0.7 0
M5 1.2 0.0 1.4 0.8 0
M6 0.0 1.2 0.5 1.0 1.2 0
M7 0.8 1.4 0.8 0.9 1.0 1.1 0
M8 1.0 0.6 0.9 0.5 0.6 0.6 1.3 0
M9 0.4 1.4 0.3 0.8 1.4 0.4 1.0 0.8 0
M10 0.9 0.9 0.8 0.7 0.9 0.9 0.5 0.7 0.9 0
After that, we select one keyword from each clus-
ter that has the highest value of H. If two or more key-
words belonging to the same cluster have the same
value of H, then we take one of them that has the
highest t f ∗ id f score. The thirteen documents of
the example are thus represented by the following
keywords: {M5=Data Warehouse, M6=Document
M8=Cube}.
ICEIS2015-17thInternationalConferenceonEnterpriseInformationSystems
124
4 EXPERIMENTAL STUDY
4.1 Textual Benchmark
There are several available benchmarks for evaluating
aggregated keywords approaches. Authors in (Hulth,
2003) used a dataset to test their approach containing
800 journal article abstracts from Inspec
1
, published
between 1998 and 2002. In (Nguyen and Kan, 2007)
the authors compiled a dataset containing 120 com-
puter science articles from 4 to 12 pages. in (Wan
and Xiao, 2008) the authors developed a dataset of
308 documents taken from DUC 2001. Authors in
(Schutz, 2013) compiled a collection of 500 medical
articles from PubMed
2
. In (Krapivin and Marchese,
2009) the authors used 680 articles from the same
source for years 2003 to 2005, with author assigned
keywords. The authors in (SuNam et al., 2013) col-
lected a dataset of 100 articles from the ACM Digital
Library (conference and workshop papers), ranging
from 6 to 8 pages, including tables and figures. In
(Medelyan et al., 2009) the authors proposed a tool
that generates automatically a dataset using keywords
assigned by users of the collaborative citation plat-
form CiteULike
3
. These corpuses are summarized in
Table 3.
Table 3: Existing benchmarks.
References Corpus size
A.Hulth (2003) 800
T.Nguyen (2007) 120
X.Wan (2008) 308
A.Schutz (2013) 500
M.Krapivin (2009) 680
K.SuNam (2013) 100
In this work we compiled a corpus from the IIT
conference
4
(conference and workshop papers) for
the years 2008 to 2012. It consists of 600 papers rang-
ing from 7 to 8 pages in IEEE format, including tables
and figures. The keywords are extracted from the full
words using Microsoft Academic Search
5
keywords.
The keywords extraction function is based on the
Microsoft Academic Search web site (MAS). MAS
classifies scientific articles according to fifteen scien-
tific fields by extracting the scientific keywords from
articles and ordering them according to their frequen-
cies. We use the lists of keywords produced by MAS
1
http://www.theiet.org/resources/inspec/
2
http://www.ncbi.nlm.nih.gov/pubmed/
3
http://www.citeulike.org/
4
http://www.it-innovations.ae
5
academic.research.microsoft.com/
and we choose 2000 most frequent keywords form
each flied. The extraction of keyword from our corpus
is performed according to these chosen lists. At the
end we keep only the keywords with a t f ∗ id f higher
then 30%. The output of this process is the two fold
matrix of Documents x Keywords, which is used by
our platform to compare between our approach and
the other textual aggregation approaches.
For the evaluation task of the keyword aggrega-
tion, many type of measures have been proposed in
(Sutcliffe, 1992; Jones and Willett, 1997; Trec, 2013).
But the most used are the recall, the precision, and
the F-measure. The recall is the ratio of the number
of documents to the total number of retrieved docu-
ments.
Recall =
{RelevantDoc} ∩ {RetrievedDoc}
{RelevantDoc}
(3)
The precision is the ratio of the number of rele-
vant documents to the total number of retrieved docu-
ments.
Precision =
{RelevantDoc} ∩ {RetrievedDoc}
{RetrievedDoc}
(4)
The F-measure or balanced F-score, which com-
bines precision and recall, is the harmonic mean of
precision and recall.
4.2 Results
In this section, we report an empirical study to evalu-
ate our aggregated keyword function using a real cor-
pus. We also compare its performance with those
of (Wartena and Brussee, 2008). We choose the ap-
proach of (Wartena and Brussee, 2008) , because it
uses a clustering technique for textual aggregation. In
order to simplify the result presentation, we called this
method TOPIC.
The experimentation has been performed on a PC
running the Microsoft Windows 7 Edition operating
system, with a 2.62 GHz Pentium Dual-core CPU, 1.0
GB main memory, and a 300 GB hard disk. To test
and compare the different approaches we have com-
piled a real corpus prepared in Section 4.1 with 600
articles, 800000 words and 2182 keywords extracted.
To perform this comparison, we use four evalu-
ation metrics : recall, precision, F-measure and the
run time for different values of k . We also give a
comparison of the complexity for the two algorithms.
The results are summarized in Figures 5 to 7. Overall,
our approach produces higher values of the recall, the
precision and F-measure. We obtain a powerful recall
with 100%, this means that the aggregated keywords
generated by our approach, figure in all documents.
For instance, for TOPIC we obtained a recall of 8%,
GOTA-UsingtheGoogleSimilarityDistanceforOLAPTextualAggregation
125
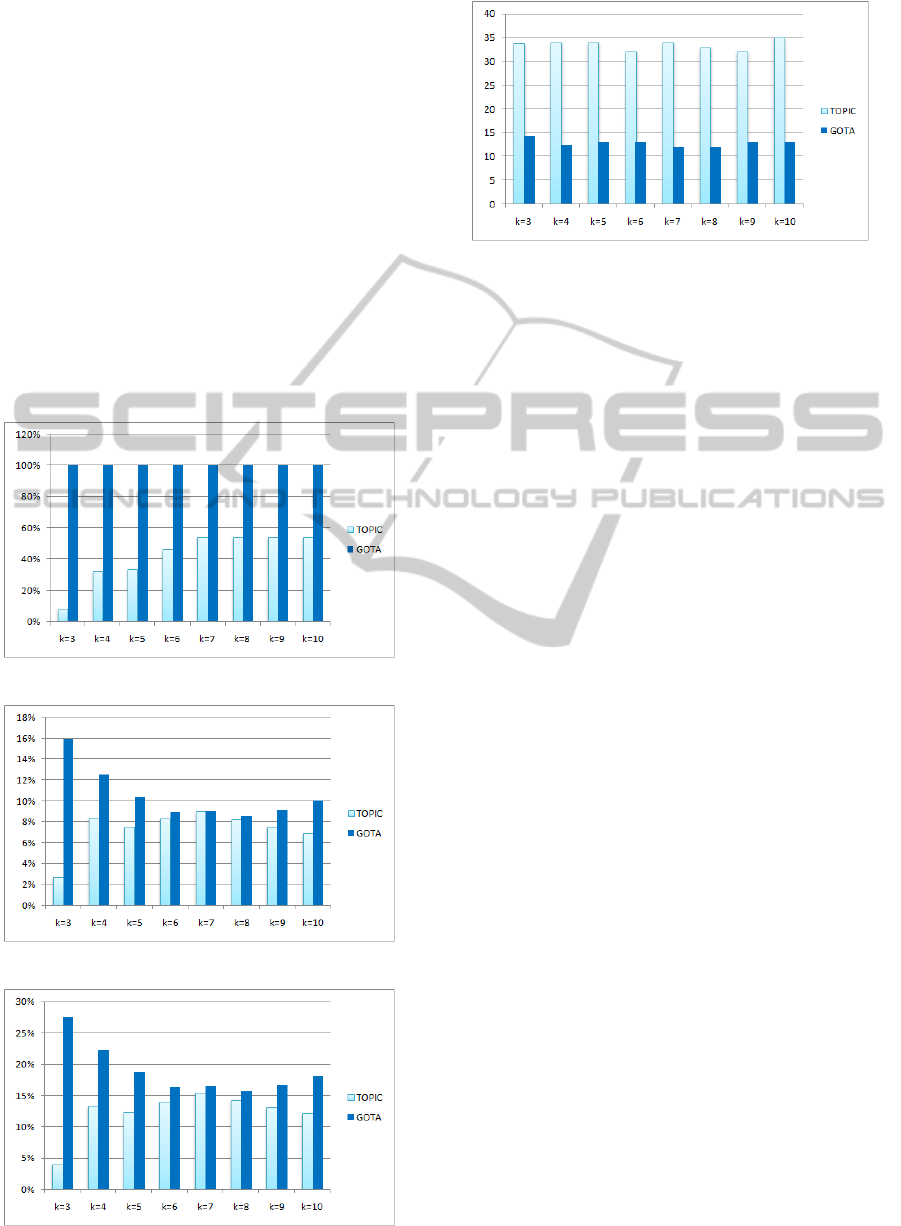
46% and 54% for k=3, k=6 and k=10 respectively, this
means that the obtained aggregated keywords do not
exist in the majority of documents.
For the precision, we obtained a value of 16%, 9%
and 10%, compared with 3%, 8% and 7% obtained
by TOPIC in the cases of k=3, k=6 and k=10. As for
the F-measure, we obtained a value of 28%, 16% and
18% compared with 4%, 14% and 12% obtained by
TOPIC approach.
In order to determine the runtime for each ap-
proach, we carried out 10 executions of each ap-
proach. The difference between the two approaches
is highly noticeable (Figure 7). This is due to the
difference in the complexities of the two approaches.
Our approach GOTA is based on k-means which has
a complexity of O(N). On the other hand TOPIC
is based on the k-bisecting clustering which has a
complexity of O((k − 1)kN). where k is the number
Figure 4: Comparaison of the Recall.
Figure 5: Comparaison of the Precision.
Figure 6: Comparaison of the F-measur.
Figure 7: Comparaison of the Runtime.
of clusters and N the number of terms (Wartena and
Brussee, 2008).
5 CONCLUSIONS
We have presented in this paper, an OLAP aggrega-
tion function for textual data. which aggregates key-
words using the k-means algorithm with the Google
Similarity Distance to measure semantic distances be-
tween keywords. The proposed approach was then
compared with that of (Wartena and Brussee, 2008).
The obtained results show that, overall, our approach
achieves better performances in terms of recall, pre-
cision, F-measure and runtime. Future efforts should
give more emphases to the semantic aspect of key-
words as well using other corpus.
ACKNOWLEDGEMENTS
This research paper is made possible through
the support of the IMAGIWEB project
(http://mediamining.univ-lyon2.fr/velcin/imagiweb/).
We also thank some project colleagues for their
scientific discussion.
REFERENCES
Bringay, S., Laurent, A., Poncelet, P., Roche, M., and Teis-
seir, M. (2010). Bien cube: les donnees textuelles
peuvent s’agreger. confrence internationale sur
l’extraction et la gestion des connaissances, pages
585–596.
Cilibrasi, R. and Vitanyi, P. (2007). The google similarity
distance. IEEE Transactions on Knowledge and Data
Engineering, pages 370–383.
Elghannam and Elshishtawy (2013). Multi-topic multi-
document summarizer. International Journal of Com-
puter Science and Information Technology, pages
117–132.
ICEIS2015-17thInternationalConferenceonEnterpriseInformationSystems
126

Frantziy, K., Ananiadou, S., and Mimaz, H. (2000). Au-
tomatic recognition of multi-word terms: the c-
value/nc-value method. International Journal on Dig-
ital Libraries, pages 117–132.
Fuglede, B. and Topsoe, F. (2004). Jensen-shannon di-
vergence and hilbert space embedding. International
Symposium on Information Theory, pages 31–37.
Hady, W., EcPeng, L., and HweeHua, P. (2007). Tube (text-
cube) for discovering documentary evidence of asso-
ciations among entities. Symposium on Applied Com-
puting, pages 824–828.
Hulth, A. (2003). Improved automatic keyword extraction
given more linguistic knowledge. Empirical Methods
in Natural Language Processing, pages 216–223.
Jones, K. and Willett, P. (1997). Readings in Information
Retrieval. Morgan Kaufmann Publishing.
Kimball, R. (2003). The data warehouse toolkit. John Wiley
and Sons.
Kohomban, U. and Lee, W. S. (2007). Optimizing classifier
performance in word sense disambiguation by redefin-
ing sense classes. International Joint Conference on
Artificial Intelligence, pages 1635–1640.
Krapivin, M. and Marchese, M. (2009). Large Dataset for
Keyphrases Extraction. Technical report, University
of Trento.
Medelyan, Frank, and Witten (2009). Human-competitive
tagging using automatic keyphrase extraction. Empir-
ical Methods in Natural Language Processing, pages
1318–1327.
Mihalcea, R. and Tarau, P. (2004). Textrank: Bringing order
into texts. Empirical Methods in Natural Language
Processing, pages 26–31.
Nguyen, T. and Kan, M. (2007). Key phrase extraction in
scientific publications. International Conference on
Asian Digital Libraries, pages 317–326.
Oukid, L., Asfari, O., Bentayeb, F., Benblidia, N., and
Boussaid, O. (2013). Cxt-cube: Contextual text cube
model and aggregation operator for text olap. Inter-
national Workshop On Data Warehousing and OLAP,
pages 56–61.
Poudat, C., Cleuziou, G., and Clavier, V. (2006). Cleuziou
g., and clavier v., categorisation de textes en domaines
et genres. complementarite des indexations lexicale et
morpho syntaxique. Lexique et morphosyntaxe en RI,
9:61–76.
Ravat, F., Teste, O., and Tournier, R. (2007). Olap aggrega-
tion function for textual data warehouse. In Interna-
tional Conference on Enterprise Information Systems,
pages 151–156.
Ravat, F., Teste, O., Tournier, R., and Zurfluh, G. (2008).
Top keyword extraction method for olap document. In
International Conference on Data Warehousing and
Knowledge Discovery, pages 257–269.
Schutz, A. (2013). Keyphrase Extraction from Single Doc-
uments in the Open Domain Exploiting Linguistic and
Statistical Methods. Master thesis, National Univer-
sity of Ireland.
Subhabrata, M. and Sachindra, J. (2014). Cxt-cube: Con-
textual text cube model and aggregation operator for
text olap. The Language Resources and Evaluation
Conference, pages 26–31.
Sullivan, D. (2001). Document Warehousing and Text Min-
ing. John Wiley and Sons.
SuNam, K., Medelyan, O., and Kan, M.-Y. (2013). Auto-
matic keyphrase extraction from scientific articles. In
Language Resources and Evaluation, pages 723–742.
Sutcliffe, T. (1992). Measuring the informativeness of a
retrieval process. Proc. of SIGIR, pages 23–36.
Trec (2013). Common evaluation measures. The
Twenty-Second Text REtrieval Conference, page
(http://trec.nist.gov/pubs/trec22/trec2013.html).
Tseng, F. and Chou, A. (2006). The concept of docu-
ment warehousing for multi-dimensional modeling of
textual-based business intelligence. journal of Deci-
sion Support Systems, 42:727–744.
Wan, X. and Xiao, J. (2008). Collabrank: Towards a col-
laborative approach to single document keyphrase ex-
traction. International Conference on Computational
Linguistics, pages 317–326.
Wartena, C. and Brussee, R. (2008). Topic detection by
clustering keywords. International Conference on
Database and Expert Systems Applications, pages 54–
58.
GOTA-UsingtheGoogleSimilarityDistanceforOLAPTextualAggregation
127
