
Local Deforestation Patterns in Mexico
An Approach using Geographiccally Weighted Regression
Jean Francois Mas and Gabriela Cuevas
Centro de Investigaciones en Geografía Ambiental, Universidad Nacional Autónoma de México,
Antigua carretera a Pátzcuaro # 8701, Col. Ex Hacienda de San José de la Huerta,
C.P. 58190, Morelia, Michoacán, Mexico
{jfmas, gcuevas}@ciga.unam.mx
Keywords: Deforestation, Geographically Weighted Regression, Mexico.
Abstract: This study identifies drivers of deforestation in Mexico by applying Geographically Weighted Regression
(GWR) models to cartographic and statistical data. A wall-to-wall multitemporal GIS database was
constructed incorporating digital data from Global Forest Change (2000-2012); along with ancillary data
(road network, settlements, topography, socio-economical parameters and government policies). The
database analysis allowed assessing the spatial distribution of deforestation at the municipal level. The
statistical analysis of deforestation drivers presented here was focused on the rate of deforestation during the
period 2007-2011 as dependent variable. In comparison with the global model, the use of GWR increased
the goodness-of-fit (adjusted R
2
) from 0.46 (global model) to 0.58 (average R
2
of GWR local models), with
individual GWR models ranging from 0.52 to 0.64. The GWR model highlighted the spatial variation of the
relationship between the rate of deforestation and its drivers. Factors identified as having a major impact on
deforestation were related to topography (slope), accessibility (road and settlement density) and
marginalization. Results indicate that some of the drivers explaining deforestation vary over space, and that
the same driver can exhibit opposite effects depending on the region.
1 INTRODUCTION
Mexico, with a total area of about two million
square kilometres, is a megadiverse country, but it
presents high rates of deforestation (FAO, 2001).
Various studies have attempted to assess land use /
cover change (LUCC) over the last decades (Mas et
al., 2004) but there have been few attempts to assess
the main causes of deforestation at national level
(Figueroa et al., 2009); (Pineda Jaimes et al., 2010);
(Bonilla-Moheno et al., 2013). Given the complexity
of Mexico territory, the processes of change and its
factors are expected to be different depending on the
region. Geographically Weighted Regression
(GWR) has been applied in exploring spatial data in
the social, health and environmental sciences. The
goal of this study is to evaluate the spatial patterns
of deforestation with respect to drivers reported to
influence LUCC using Geographically Weighted
Regression (GWR).
2 MATERIAL AND METHODS
2.1 Material
In order to elaborate the GIS database, the following
data were used:
Map of forest loss from the Global Forest
Change 2000–2012 data base at 30 m resolution
(Hansen et al., 2013).
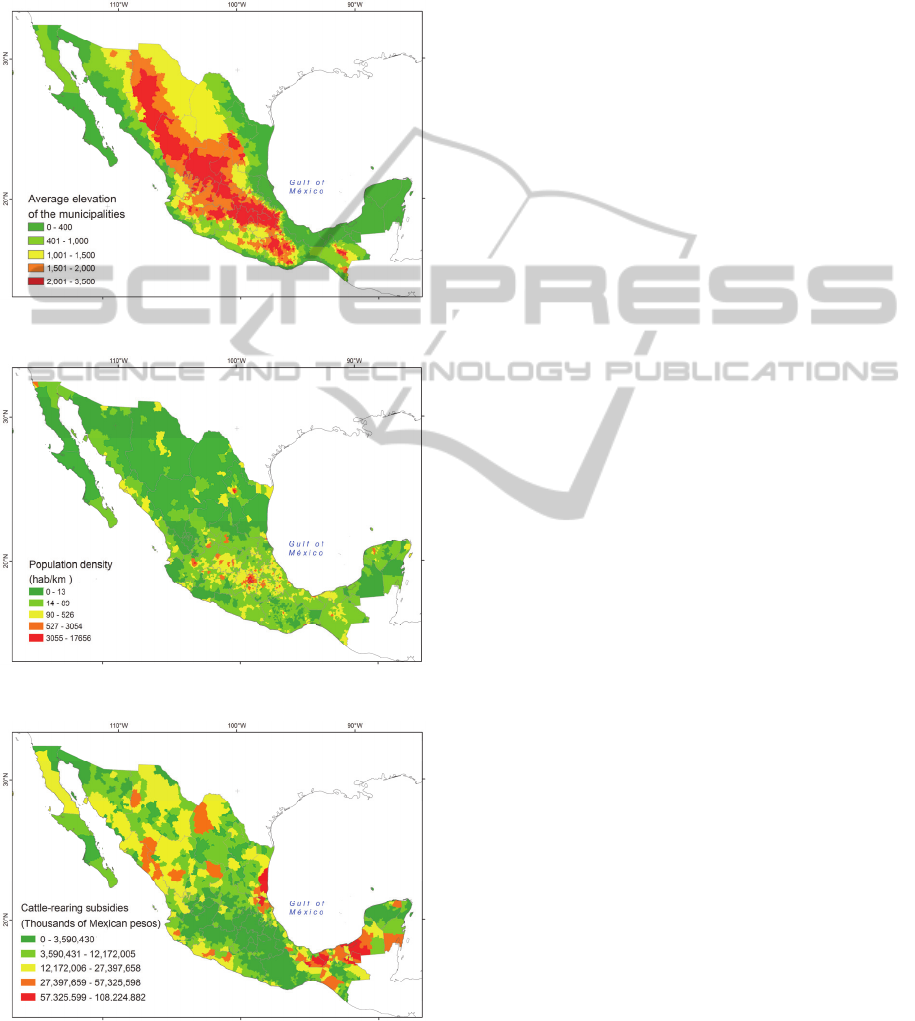
Maps of ancillary data (digital elevation model,
slope, roads maps, human settlements, climate,
soils, municipal boundaries). (Figure 1)
Socio-economic data from the National Institute
of Geography, Statistics and Informatics (INEGI
for its Spanish acronym) organized by
municipality (Population census for 2005 and
2010). (Figure 2)
Government policies (rural and cattle-rearing
subsidies, and protected areas). (Figure 3)
GIS operations were carried out with the following
programs: ArcGIS (ESRI, 2011) and Q-GIS
(www.qgis.org/). Statistical analysis and graphs
54
Mas J. and Cuevas G..
Local Deforestation Patterns in Mexico - An Approach using Geographiccally Weighted Regression.
DOI: 10.5220/0005349000540060
In Proceedings of the 1st International Conference on Geographical Information Systems Theory, Applications and Management (GISTAM-2015), pages
54-60
ISBN: 978-989-758-099-4
Copyright
c
2015 SCITEPRESS (Science and Technology Publications, Lda.)
were created using R (R Development Core Team,
2009). Geographically weighted regressions (GWR)
were carried out using the packages: gwrr (Wheeler,
2007 and 2012) and spgwr (Bivand and Yu, 2012) in
R.
Figure 1: Average elevation of the municipalities.
Figure 2: Municipal population density in 2010.
Figure 3: Cattle-rearing subsidies (2007-2011).
2.2 Deforestation Rates and GIS
Database Elaboration
Deforestation rates were calculated at municipality
level (2456 municipalities) based in the Global
Forest Change 2000-2012 database (Hansen et al.,
2013). In this study, the rate of deforestation was
computed as the total area of forest loss during
2007-2011 normalized by the municipality area.
In order to determine which ancillary variables
are most likely to be indirect drivers of
deforestation, we calculated, for each municipality
various indices describing: population, economic
activities and the resources accessibility. These
indices were: a) Population density in 2010 (people
per km
2
); b) Density settlements (number of
settlements per km
2
); c) Index of marginalization,
which takes into account incomes, level of schooling
and housing conditions (CONAPO, 2010), d) Cattle
density, e) Goat density, f) Mean slope (degrees), g)
Mean elevation, h) Road density (km of road per
km
2
), i)Amount of governmental subsidies for
agriculture and cattle ranching (thousand of Mexican
pesos per km
2
), j) Proportion of municipality with
protected areas.
2.3 Statistical Analysis
Geographically Weighted Regression is a local
spatial statistical technique for exploring spatial
nonstationarity (Fotheringham et al., 2002). It
supports locally modelling of spatial relationships by
fitting regression models. Regression parameters are
estimated using a weighting function based on
distance in order to assign larger weights to closer
locations. Different from the usual global regression,
which produces a single regression equation by
summarizing the overall relationships among the
explanatory and dependent variables (for the whole
Mexican territory in that case), GWR produces
spatial data that express the spatial variation in the
relationships among variables. Maps that present the
spatial distribution of the regression coefficient
estimates along with the level of significance (e.g. t-
values) have an essential role in exploring and
interpreting spatial nonstationarity. Fotheringham et
al., (2002) provide with a full description of GWR,
and Mennis (2006) gives useful suggestions to map
GWR results.
The first stage of the study was correlation
analysis between explanatory variables using the
Spearman coefficient in order to discard highly
correlated variables. Due to the uneven distribution
and size of the municipalities, the weighting
LocalDeforestationPatternsinMexico-AnApproachusingGeographiccallyWeightedRegression
55
function used an adaptive kernel which selects a
proportion of the observations (k-nearest
neighbours) assigned to each municipality and
calculates the weights using a Gaussian model. The
optimal size of the bandwidth (in this case the
proportion of observations) was evaluated by
minimizing the root mean square error. A map was
elaborated for each explanatory variable showing the
value of the regression’s coefficients (color scaling
of the symbol) and statistical significance (gray
mask).
3 RESULTS
3.1 LUCC Monitoring
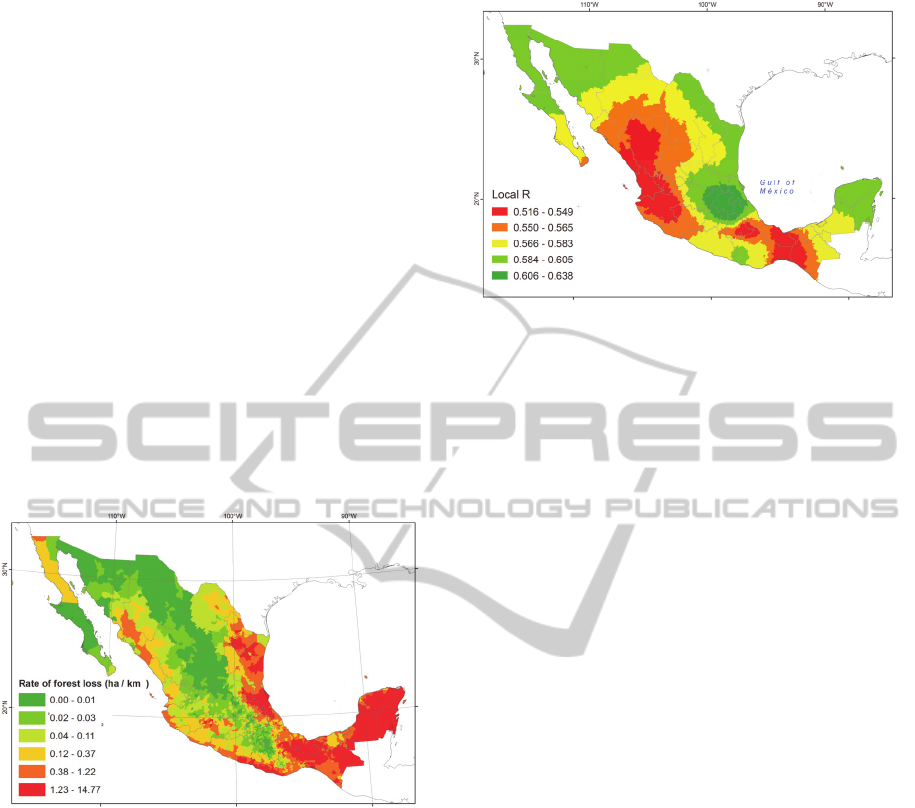
As shown in Figure 4: The rate of deforestation
varies over space. The coastal floodplains of the
Gulf of Mexico and the southern part of the country
exhibits high rates of deforestation.
Figure 4: Per municipality deforestation (2007-2011).
3.2 Geographically Weighted
Regression (GWR)
In this paper, we report the results of the GWR using
as dependent variable the rate of deforestation in the
period of 2007-2011. The weighting function was
based on a 5% of the observations. A global model
was fitted and obtained an adjusted-R
2
of 0.46. The
use of GWR slightly increased the strength in the
relationship in terms of the goodness-of-fit (adjusted
R
2
) to 0.58 (average R
2
of GWR local models), with
local GWR models with adjusted R
2
ranging from
0.52 to 0.64. Figure 5 presents the spatial
distribution of the goodness of fit.
Figure 5: Distribution of local R
2
.
Some variables such as population and road
density and slope exhibit a significant relationship
with the rate of deforestation for the whole territory.
As expected, the first two variables have a positive
effect on this proportion while slope presents a
negative relationship (steeper slope less
deforestation) also there is a "stronger" relationship
in flat regions, or with more recent deforestation
(Figure 6). Other explanatory variables have a more
contrasted pattern. In example, the marginalization
index presents a significant relationship with the rate
of deforestation. It presents a positive relationship in
the Baja California states, the border with the USA
and the north strip along the Gulf of Mexico and a
negative relationship in the center of Mexico (Figure
7).
Many studies have associated poverty and
deforestation (Rudel and Horowitz, 2013). The
region in the center south, where the relationship
between marginalization and deforestation is
negative is related to indigenous regions where
municipalities with higher marginalization indices
present lower deforestation rates. Previous
researches have reported that the most conserved
natural areas in Mexico are often located in poor
rural areas and/or community lands (Klooster 2000);
(Alix-Garcia de Janvry and Sadoulet, 2005);
(Figueroa et al., 2009); (García-Barrios et al., 2009).
With respect to the government policy variables,
protected areas (PAs) have no relationship to
deforestation in most of the territory, but where the
relation exists, it indicates that there is less
deforestation in municipalities with more protected
areas (Figure 8). Various studies reported
contrasting effects of PAs on changes (Pineda et al.,
2010); (Bray et al., 2008).
GISTAM2015-1stInternationalConferenceonGeographicalInformationSystemsTheory,ApplicationsandManagement
56
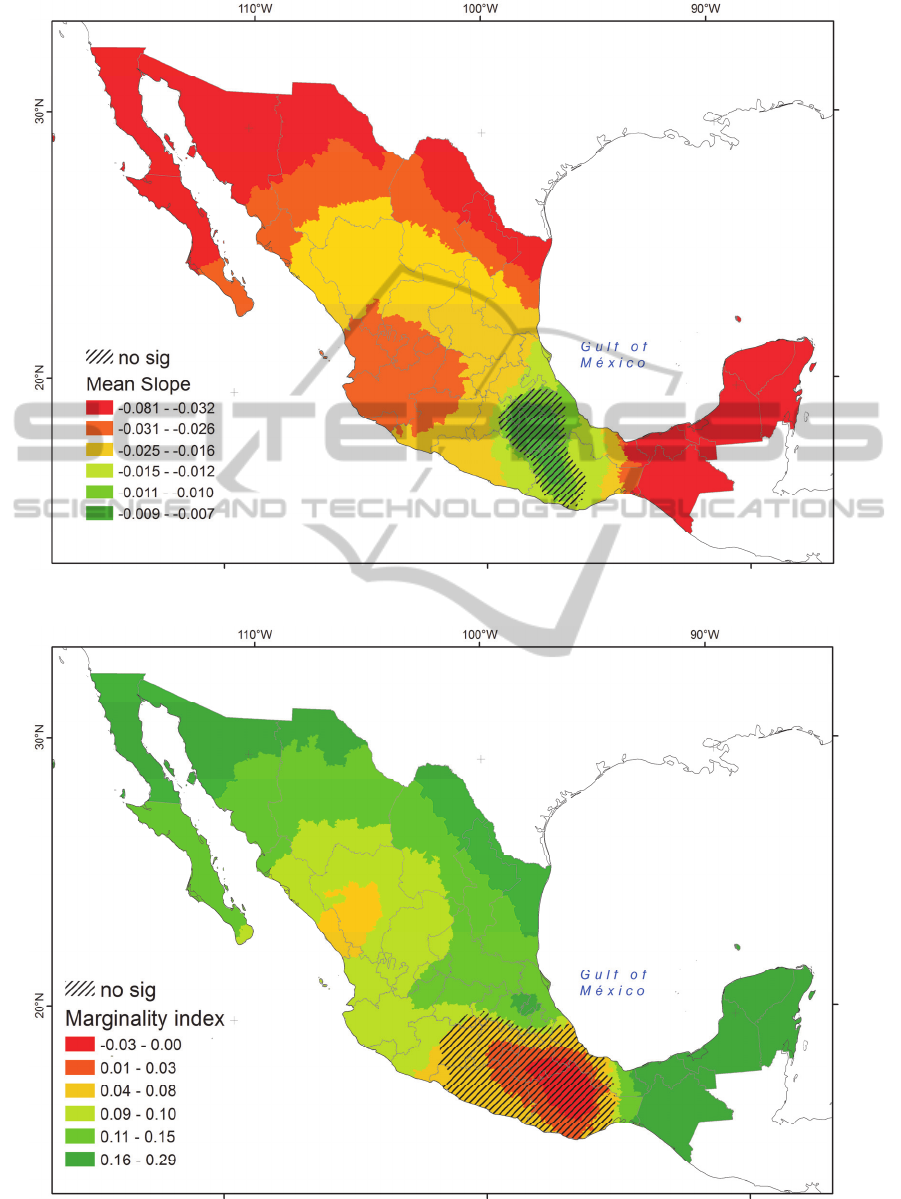
Figure 6: GWR coefficient and significance values for mean slope.
Figure 7: GWR coefficient and significance values for marginalization.
LocalDeforestationPatternsinMexico-AnApproachusingGeographiccallyWeightedRegression
57
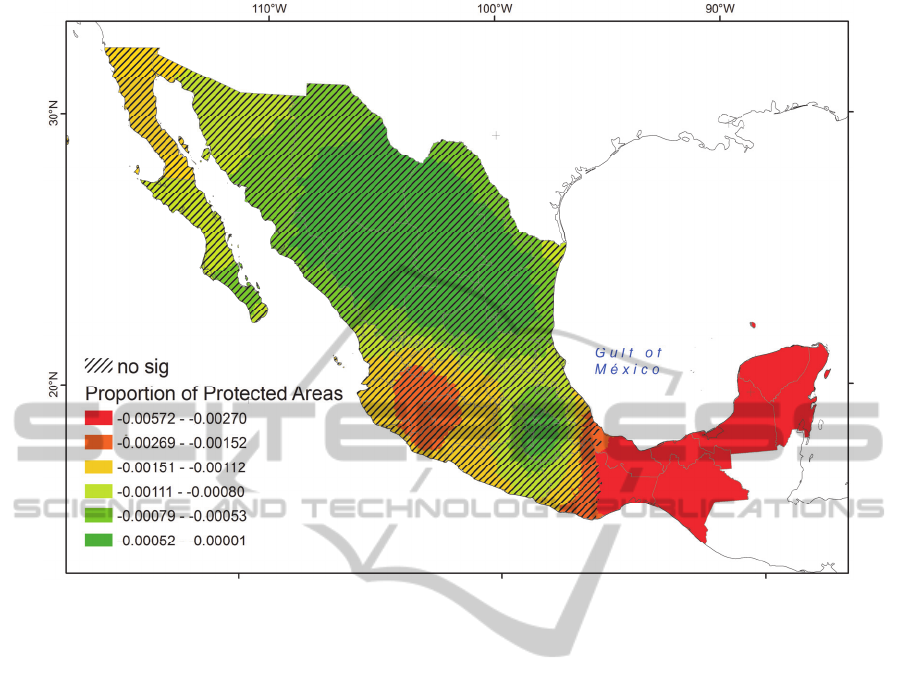
Figure 8: GWR coefficient and significance values for protected areas.
4 DISCUSSION
Some limitations of this study have been identified.
Some of them are related with input data and with
the way information is summarized at municipality
level: i) Change data is based only on a drastic
change of land cover (forest loss), it does not
consider cover degradation. This factor has to be
considered during the results interpretation. For
example in some regions goat density is associated
with lower levels of deforestation, however it is
likely related with vegetation cover degradation
rather than deforestation. ii) The rate of
deforestation shows change from 2007 to 2011, but
the drivers variables (population, marginalization,
government subsidies) are from a particular date at
different times of the period depending on data
availability. The temporal issue cannot be totally
addressed due to the lack of information.
Additionally, in some cases, it could be interesting
to calculate rates of change of these indices. For
instance deforestation may be more related to the
increase of population density than to population
itself, iii) Another limitation is the averaging of
indices at municipality level which may end up with
a figure that does not reflect the actual situation over
much of the area. For instance, a municipality with
flat and steep slopes will present the average value
corresponding to moderate slope. Moreover,
deforestation can occur in small regions which
present very different features from the average
figure. A way to minimize those effect could be to
calculate the indices taking into account only the
forested area. For instance, average slope of
municipality forest area is used to explain
deforestation instead of the slope average over the
entire municipality, iv) Finally, as depicted in figure
4, the set of explanatory variables we used did not
allow to explain the dependent variable in a
satisfactory manner for the entire territory. More
drivers have to be taken into account for future
analysis.
Other limitations are related with the method
used and the deforestation process itself:
Deforestation is a complex process that depends on
interacting environmental, social, economic and,
cultural drivers. Some of them cannot be used into
the model because they are unable to be mapped.
Moreover, the GWR uses municipality information
to explain deforestation but is unable to take into
account shifting effects (deforestation in a given
GISTAM2015-1stInternationalConferenceonGeographicalInformationSystemsTheory,ApplicationsandManagement
58

municipality is due to the actions from inhabitants
from other municipalities) and effects at different
scale (as the GWR use the same bandwidth for all
the explanatory variables). It worth noting that some
drivers cannot act with very fuzzy spatial pattern or
no pattern at all (e.g. global economy effect such as
import/export of agriculture goods).
It is likely that the effect of a driver on a given
region is related to the time such driver has been
shaping the landscape and that different drivers have
affect at different temporal and spatial scales, which
makes the interpretation of the results difficult.
Considering the rate of deforestation during different
past periods of time will enable us to analyze the
dynamic of deforestation in its temporal and spatial
dimensions.
5 CONCLUSIONS
Some limitations of this study have been identified
and will be addressed in forthcoming researches.
However, results clearly show the advantages of a
local approach (GWR) over a global one, to assess
different drivers’ effect on LUCC over such a
complex and diverse territory as Mexico.
In future researches, alternative deforestation
rates will be computed, new explanatory variables
such as land tenure will be integrated into the model,
the effect of correlation between explanatory
variables at local scale will be tested and a workshop
will be organized to carry out deep interpretation of
the results.
ACKNOWLEDGEMENTS
This research has been funded by the Consejo
Nacional de Ciencia y Tecnología (CONACyT) and
the Secretaría de Educación Pública (grant
CONACYT-SEP CB-2012-01-178816) and
CONAFOR project: “Construcción de las bases para
la propuesta de un nivel nacional de referencia de las
emisiones forestales y análisis de políticas públicas”.
The authors would like to thank the four reviewers
for their careful review of our manuscript and
providing us with their comments and suggestion to
improve the quality of the manuscript.
REFERENCES
Alix-Garcia, J., de Janvry, A., Sadoulet, E. (2005) 'A Tale
of Two Communities: Explaining Deforestation in
Mexico', World Development, 33(2): pp. 219-235.
Bivand R., Yu D. (2012) Package ‘spgwr’, Geographically
weighted regression. Available at: http://cran.open-
source-solution.org/web/packages/spgwr/spgwr.pdf
(Accessed: 12 April 2013)
Bonilla-Moheno, M., Redo, D. J., Mitchell Aide T., Clark,
M. L., Grau, H. R. (2013) 'Vegetation change and land
tenure in Mexico: A country-wide analysis', Land Use
Policy, 30(1), pp. 355-364.
Bray, D. B., Duran, E., Ramos, V. H., Mas, J. F.,
Velázquez, A., McNab, R. B., Barry, D. and
Radachowsky, J. (2008) 'Tropical deforestation,
community forests, and protected areas in the Maya
Forest', Ecology and Society, 13(2), p. 56.
Bezaury Creel J. E., Torres, J. F., Ochoa-Ochoa, L., Castro
Campos, M., Moreno Díaz, N. G. (2011) Bases de
datos georeferenciadas de áreas naturales protegidas
y otros espacios dedicados y destinados a la
conservación y uso sustentable de la biodiversisad en
México. The Nature Conservancy.
CONAPO (2010) 'Índices de marginación por localidad'.
Available at: http://www.conapo.gob.mx/es/CONA
PO/Indice_de_Marginacion_por_Localidad_2010
(Accessed: 15 April 2013)
ESRI (2011) ArcGIS Desktop: Release 10. Redlands, CA:
Environmental Systems Research Institute.
FAO (2001) 'Global resources assessment', Forestry paper
140.
Figueroa, F., Sánchez-Cordero, V., Meave, J. A., Trejo, I.
(2009) 'Socioeconomic context of land use and land
cover change in Mexican biosphere reserves',
Environmental Conservation, 36 (3), pp. 180–191.
Fotheringham, S. A., Brunsdon, C., Charlton, M. (2002)
Geographically Weighted Regression: the analysis of
spatially varying relationships. John Wiley & Sons.
García-Barrios, L., Galván-Miyoshi, Y. M., Valdivieso
Pérez, I. A., Masera, O. R., Bocco, G., Vandermeer, J.
(2009) 'Neotropical forest conservation, agricultural
intensification and rural outmigration: The Mexican
Experience', BioScience, 59(10), pp. 863-873.
Hansen, M. C., Potapov, P. V., Moore, R., Hancher, M.,
Turubanova, S. A., Tyukavina, A., Thau, D. ,
Stehman, S. V., Goetz, S. J., Loveland, T. R.,
Kommareddy, A., Egorov, A., Chini, L., Justice, C. O.
and Townshend, J. R.G. (2013) 'High-Resolution
Global Maps of 21st-Century Forest Cover Change'
Science 342 (15 November), pp. 850–53. Available at:
http://earthenginepartners.appspot.com/science-2013-
global-forest.
INEGI (2004) 'Carta topográfica escala 1: 250000'. Ed.
INEGI, México.
INEGI (2005) 'Conteo de población y vivienda 2005.
Indicadores del censo de Población y vivienda'. Ed.
INEGI, México.
INEGI (2010) 'Censo de población y vivienda 2010'. Ed.
INEGI, México.
Klooster, D. (2000) 'Beyond Deforestation: The Social
Context of Forest Change in Two Indigenous
Communities in Highland Mexico', Journal of Latin
LocalDeforestationPatternsinMexico-AnApproachusingGeographiccallyWeightedRegression
59

American Geography, 26, pp. 47-59.
Mas, J. F., Velázquez, A., Díaz-Gallegos, J. R., Mayorga-
Saucedo, R., Alcántara, C., Bocco, G., Castro, R.,
Fernández, T., Pérez-Vega, A. (2004) 'Assessing
land/use cover changes: a nationwide multidate spatial
database for Mexico', International Journal of Applied
Earth Observation Geoinformatics, 5, pp. 249–261.
Mennis, J. L. (2006) 'Mapping the results of
geographically weighted regression' The Cartographic
Journal 43(2), pp. 171-179.
Pineda-Jaimes, N. B., Bosque Sendra, J., Gómez Delgado,
M., Franco Plata, R. (2010) 'Exploring the driving
forces behind deforestation in the state of
Mexico(Mexico) using geographically weighted
regression' Applied Geography, 30, pp. 576–591.
GIS Development Team, QGIS Geographic Information
System. Open Source Geospatial Foundation Project.
http://qgis.osgeo.org
R Development Core Team (2009) 'R: A language and
environment for statistical computing', R Foundation
for Statistical Computing,Vienna, Austria. Available
at: http://www.R-project.org (Accessed 9 April 2013)
Rudel, T. A., Horowitz, B. (2013) Tropical Deforestation:
Small Farmers and Local Clearing in the Ecuadorian
Amazon. Columbia University Press.
SAGARPA (2007-2011) Listas de beneficierios de
PROCAMPO y PROGAN.
Wheeler, D. C. (2007) 'Diagnostic tools and a remedial
method for collinearity in geographically weighted
regression', Environment and Planning, 39, pp. 2464-
2481.
Wheeler, D. C. (2012) 'Package ‘gwrr’, Geographically
weighted regression with penalties and diagnostic
tools', Austria. Available at: http://cran.r-
project.org/web/packages/gwrr/gwrr.pdf (Accessed 9
April 2013).
GISTAM2015-1stInternationalConferenceonGeographicalInformationSystemsTheory,ApplicationsandManagement
60
