Temperature Effect on Intermediate Band Solar Cells (IBSCs)
M. Esgandari, H. Heydarzadeh, A. Rostami, M. Dolatyari and G. Rostami
OIC Research Group, School of Engineering-Emerging Technologies, University of Tabriz, Tabriz 5166614761, Iran
Keywords: Efficiency, IBSCs, Temperature Effects, Detailed Balance Model, Varshni Model.
Abstract: Temperature has profound effect on the performance of solar cells. Most of the electrical processes in the
semiconductor devices depend on the temperature and revealed in dramatically variations in their
characteristics such as open circuit voltage, short circuit current, power conversion efficiency and the band
gap of semiconductor. The aim of this paper is investigation of temperature effects on the Intermediate Band
Solar Cells (IBSCs). The theoretical results indicate that performance of this type of the solar cells is low at
high temperatures. Increasing in temperature from 300K to 600K decreases the efficiency of solar cell from
63% to 59 % and this decrement continues with temperature increment. This is while temperature can decrease
the open circuit voltage and increase the short circuit current.
INTRODUCTION
Photovoltaic phenomenon is the most interesting field
that converts the solar radiation to the electrical
energy. In order to studying this filed of science some
parameters should be considered and influence of the
power conversion efficiency such as temperature
effect is one of the important parameters. Generally,
solar cells operate under terrestrial temperature
conditions below than 350K (Sze and Ng, 1981) and
in the temperatures higher than room temperature, we
obvious different behaviours. For increasing the
intensity of solar irradiance the concentrators and
mirrors on the solar cell have been used that increases
the power conversion efficiency. However, these
methods have negative effects on solar cell. For
example they have thermalization effects on the cell.
Thermalization of cell can be created by photons
with energy higher than the band gap (
T
akeda and
Motohiro ,2013 , Singh, Lal and Husain, 2008)
and it
can effect on the performance of solar cells and
optoelectronic characteristics such as carrier mobility
and the optical band gap (Landis, Raffaelle, and
Merritt, 2004). For overcoming this effect the
materials with broad band gap can operate as best
candidates. The Silicon Carbide (SiC) can be used for
this aim due to its wider band gap, which harvests
high energy photons. Another advantage of SiC is the
high stability of the material (Rostami, Heidarzadeh,
Baghban, Dolatyari, and Rasooli, 2013).
In a single junction solar cell the limiting efficiency
calculated by detailed balance model is 40.7% which
is achievable by a material with the band gap of 1.12
eV (Shockley and Queisser, 1961
).
With existing an
Intermediate band between the valance band and
conduction band (Luque and Marti, 1997), the
limiting efficiency obtains as 63.2% for a host
material with the band gap of 1.95 eV (Henry, 1980).
However, in the higher temperatures these values
change. The important parameters that can be defined
for a solar cell are the open circuit voltage, short
circuit current and efficiency and their temperature
dependency can be studied. This paper investigates
the temperature dependency of intermediate band
solar cells based on 3C-SiC.
THEORETICAL BASIS
Effect of temperature on the band gap has been
studied by Varshni model (Varshni, 1967,
Sarswat
and
Free, 2012).
2
() (0)
CV CV
T
T
T
(1)
Where ε
cv
(T) is the band gap of semiconductor at
temperature T, ε
cv
(0) is the band gap at 0K and ,
are constants and their values for 3C-SiC are 6×10
-4
eVK
-1
and 1200K respectively (Levinshtein,
Rumyantsev and Shur , 2001).
96
Esgandari M., Heydarzadeh H., Rostami A., Dolatyari M. and Rostami G..
Temperature Effect on Intermediate Band Solar Cells (IBSCs).
DOI: 10.5220/0005335300960100
In Proceedings of the 3rd International Conference on Photonics, Optics and Laser Technology (PHOTOPTICS-2015), pages 96-100
ISBN: 978-989-758-093-2
Copyright
c
2015 SCITEPRESS (Science and Technology Publications, Lda.)
For analysing the cell, the detailed balance model has
been used. In calculation, we use blackbody
modelling of the sun. Therefore, the photon and
emitted energy flux density respectively is derived
from Planck’s law over the energy range
l
and
h
(Shockley and Queisser, 1961).
2
32
2
(, ,,)
exp(( ) / ) 1
h
lh
l
d
NT
KT
hc
(2)
where µ is the chemical potential, h is the Plank
constant, K is the Boltzmann constant, c is the speed
of light and
l
and
h
are lowest and highest energy,
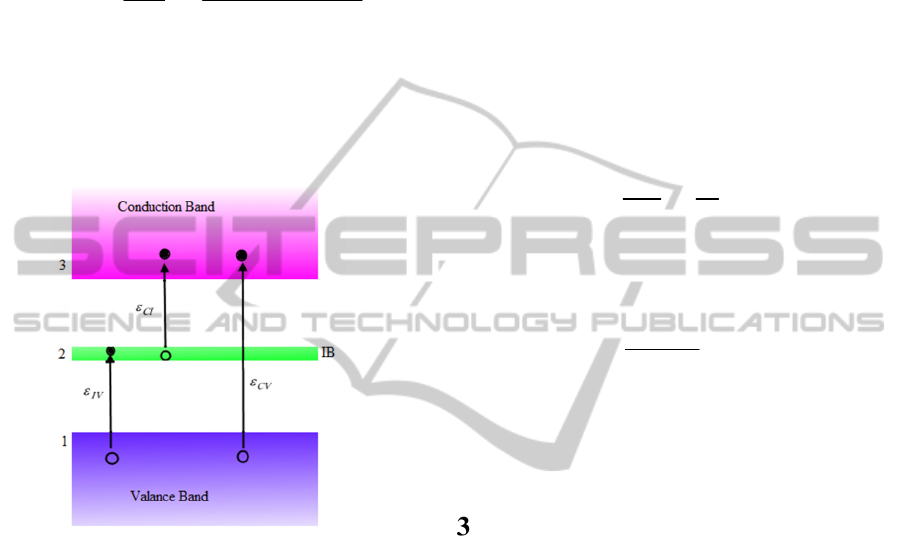
respectively. The schematic diagram for an IBSC is
shown in Figure 1.
Figure 1: Schematic band diagram of an IBSC.
To develop the limiting efficiency of the IBSC we use
detailed balance model and try to model the output
current that extracted from contacts as:
.,,0, .,,0,
.,,0, .,,,
SlhSSlhC
ClhCClhC
out
J
qf N T f N T
fN T fN T
.,,0,
.,,0,
.,,,
SlhS
CS lh C
ClhC
qf N T
ffN T
fN T
(3)
Where q is the charge of electron, f
c
and f
s
is
geometrical factors that depends on the angle of the
cell that subtended by the sun (Mruczkiewicz, Kłos,
and Krawczyk, 2008, Shockley and Queisser, 1961).
In one sun concentration, values of f
c
and f
s
are
2.18×10
-5
and in maximum concentration that implies
for 46050 suns their values is 1. (Quan, Zhi-Hua,
Chun-Lai, Yu-Hua and Qi-Min, 2011, Green, 2001).
Now with considering maximum concentration and
applying to the last equation, we have the output
current density as:
,,0, ,,,
,,0, ,, ,
CI CV S CI CV CI C
CV S CV CV C
JqN TN T
NTN T
out
(4)
Where
CI
,
IV
and µ
CV
are the difference between
quasi Fermi levels and we have:
µ
C
V
= qV (5)
V is the output voltage that takes account from Carnot
factor (Green, 2001):
(1 )
CV
c
out
s
T
V
qT
(6)
Where T
c
and
T
s
is the cell and the sun temperature
that equals to 300K and 6000K respectively and in
final the efficiency can be calculated from this:
4
.
out out
ss
VJ
fT
(7)
Where σ is the Stephan-Boltzmann constant and
equals to 5.67×10
-8
W.m
-2
.K
-4
(Quinn and Martin,
1985, Blevin and Brown, 1971).
SIMULATION RESULTS AND
DISCUSSION
In this work, we evaluate the IBSC based on SiC at
different temperatures. At first we simulate the
current-voltage characteristics in temperature of
300K and 600K and the results are shown in Figure 2 .
As shown in Figure 2, in the temperature of 600K,
voltage and current are changed. In this temperature
the band gap decreases and consequentially the
voltage due to its dependency on the band gap
decreases, while the current increases. However, an
important point that can be revealed is the output
power that these decrement and increment can change
it. In this way increasing in temperature results
decreasing in efficiency.
Figure 3 shows this phenomenon that in
temperature 300 K, the efficiency is about 63% and
in temperature 1500K it drops to 33%.
The position of IB is an important case to
achieving the optimal and maximum efficiency in an
IBSC. Efficiency variations versus sub band gaps
have been shown in Figure 4 in 300K.
TemperatureEffectonIntermediateBandSolarCells(IBSCs)
97
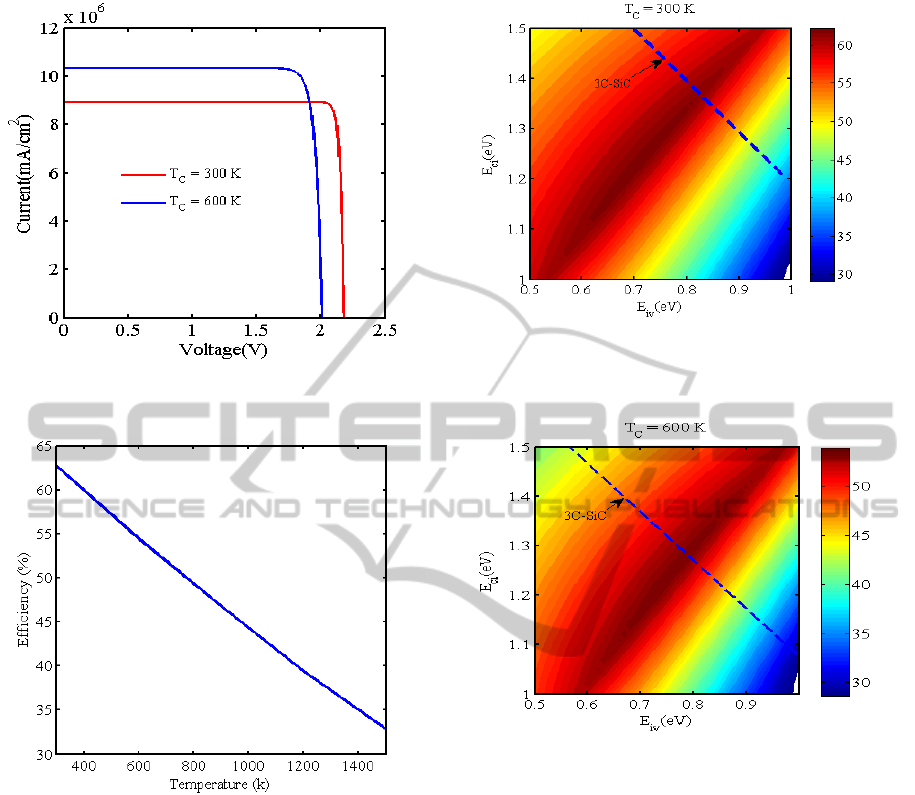
Figure 2: I-V characteristics of an IBSC in two different
temperatures; 300K and 600 K.
Figure 3: Efficiency versus temperature variation.
As seen in this figure, for the darker region contains
from 0.6 eV to 0.8 eV for E
iv
and from 1 eV to 1.5 eV
for E
ci,
the maximum efficiency is about 63%. In this
case we have larger region for choosing the IB
position. Here the introduced material is the 3C-SiC
with band gap of 2.2 eV and location of this band gap
is traced with dashed line. Using these information we
can choose the best sub band gaps (E
iv
and E
ci
) to have
the maximum efficiency. In this case when, the value
of E
iv
and E
ci
is about 0.84 eV and 1.36 eV, we
achieve the maximum efficiency that is about 60%.
Figure 4: The influence of the position of IB on the
efficiency in the temperature of 300K and location of the
3C-SiC band gap in dashed line.
Figure 5: The influence of the position of IB on the
efficiency in the temperature of 600k location of the 3C-
SiC band gap in dashed line.
If the temperature increases, the total band gap
changes. So the sub band gaps and position of IB
change too.In the temperature of 600K (that has been
shown in
Figure
5) the values of E
iv
and E
ci
has been changed
and the maximum efficiency is about 59% that occur
in the ranges between 0.65 eV to 0.85 eV for E
iv
and
between 1.1 eV to 1.35 eV for E
ci
. In this case the
ranges of E
iv
and E
ci
become smaller compared to
Figure 4 and the band gap of 3C-SiC is reduced and
is equals to 2.08 eV (dashed line shows the location
and value of it). If we choose the IB position at 0.8
eV upper than the valance and 1.28eV lower than the
conduction band
the efficiency is
maximized which is
equals to 54 %.
PHOTOPTICS2015-InternationalConferenceonPhotonics,OpticsandLaserTechnology
98
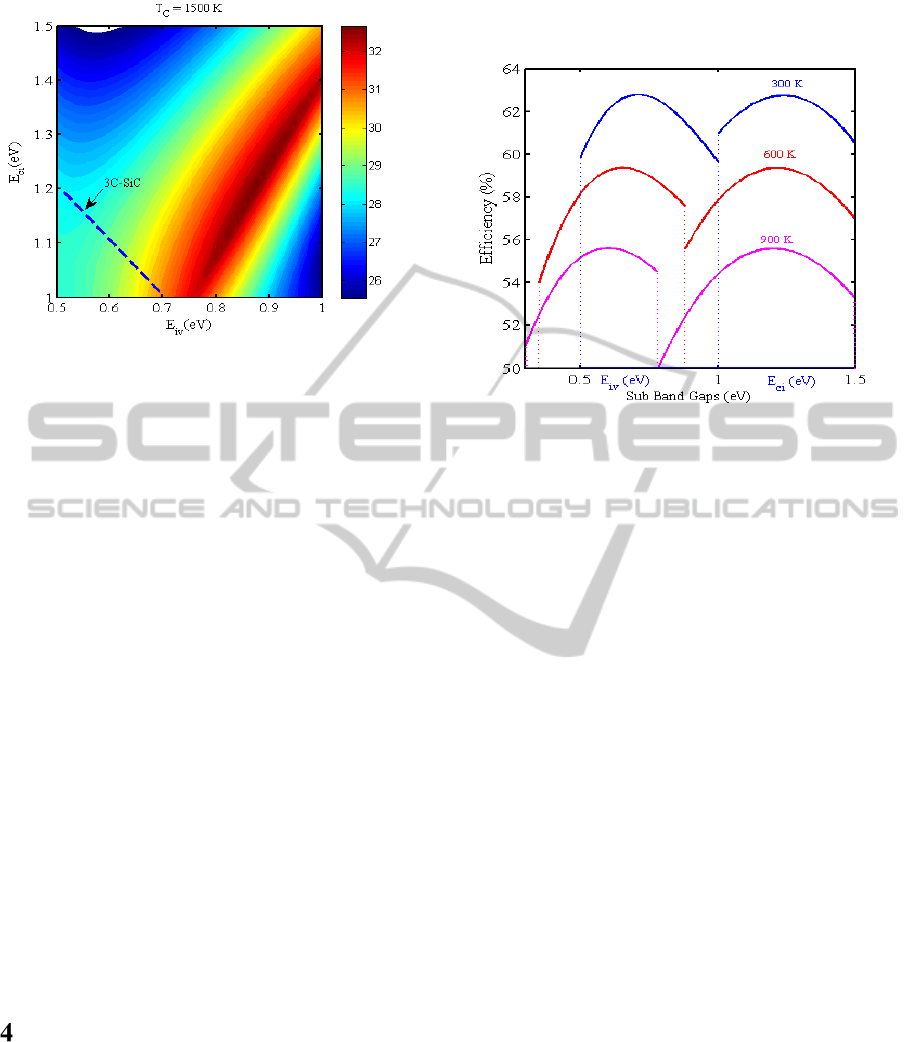
Figure 6: The influence of the position of IB on the
efficiency in the temperature of 1500K.
In the temperatures of 1500K that is shown in the
Figure 6, the maximum efficiency decreases to about
33% and the location of the IB has been changed. The
darker region is limited in this condition and it means
that we have a limit to choosing the best IB position.
Another occurred event is reducing of the band gap of
3C-SiC and its value is 1.7 eV (the dashed line). The
best position of IB for achieving the maximum
efficiency is 0.7 eV upper than the valance band or 1
eV lower than the conduction band.
Efficiency variation with temperature for the sub
band gaps, E
iv
and E
ci
, are shown in the Figure 7. The
efficiency decreases with increasing the temperature.
So at 300K, we have the maximum efficiency that has
been occurred in the 0.71 eV for E
iv
and 1.24 eV for
E
ci
while in 900K it’s drops to 55% and the value of
E
iv
and E
ci
is about 0.6 eV and 1.2 eV respectively.
These are due to the variations in the output current
and voltage that results in the variation of the output
power. If the temperature increases the band gap of
semiconductor decreases and the voltage decreases
due to its dependency to band gap but the current has
increases and finally the voltage decrement plays an
effective role in the efficiency decrement.
CONCLUSIONS
In this paper, we evaluate the IBSCs based on 3C-
SiC. Our simulation shows that the open circuit
voltage, short circuit current and efficiency vary with
temperature increment. So in the temperature 300K
the efficiency is about 63% and for example in the
temperature 600K the efficiency drops to 59% and
this decrement continues with temperature increment.
In this regard, the open circuit voltage decreases and
short circuit current increases and results in changing
of the output power.
Figure 7: Efficiency versus sub band gaps (E
iv
and E
ci
)in
three different temperatures (blue curve in 300K, red curve
in 600K and cyan curve in 900K).
REFERENCES
Blevin, W. R., & Brown, W. J., 1971. A precise
measurement of the Stefan-Boltzmann constant.
Metrologia, 7(1), 15.
Green, M. A., 2001. Third generation photovoltaics: Ultra
high conversion efficiency at low cost. Progress in
Photovoltaics: Research and Applications, 9(2), 123-
135.
Henry, C. H. ,1980. Limiting efficiencies of ideal single and
multiple energy gap terrestrial solar cells. Journal of
applied physics, 51(8), 4494-4500.
Landis, G. A., Raffaelle, R. P., & Merritt, D., 2004. High-
temperature solar cell development, 19th European
Photovoltaic Science and Engineering Conference,
June7–11, 2004, Paris, France.
Levinshtein, M. E., Rumyantsev, S. L., & Shur, M. S.
(Eds.). 2001. Properties of Advanced Semiconductor
Materials: GaN, AIN, InN, BN, SiC, SiGe. John Wiley
& Sons.
Luque, A., & Martí, A.,1997. Increasing the efficiency of
ideal solar cells by photon induced transitions at
intermediate levels. Physical Review Letters, 78(26),
5014.
Mruczkiewicz, M., Kłos, J. W., & Krawczyk, M., 2008.
Semiconductor Super lattice-Based Intermediate-Band
Solar Cells.
Quan, C., Zhi-Hua, M., Chun-Lai, X., Yu-Hua, Z., & Qi-
Ming, W., 2011. Detailed balance limit efficiency of
silicon intermediate band solar cells. Chinese Physics
B, 20(9), 097103.
Rostami, A., Heidarzadeh, H., Baghban, H., Dolatyari, M.,
& Rasooli, H., 2013. Thermal stability analysis of
TemperatureEffectonIntermediateBandSolarCells(IBSCs)
99

concentrating single-junction silicon and SiC-based
solar cells. J. Optoelectron. Adv. Mater, 15(1-2), 1-3.
Sarswat, P. K., & Free, M. L., 2011. A Study of Energy
Band Gap Temperature Relationships for Cu2ZnSnS4
Thin Films. ArXiv preprint arXiv: 1107.3890.
Shockley, W., & Queisser, H. J., 1961. Detailed balance
limit of efficiency of p-n junction solar cells. Journal of
applied physics, 32(3), 510-519.
Singh, P., Singh, S. N., Lal, M., & Husain, M., 2008.
Temperature dependence of< i> I</i>–< i> V</i>
characteristics and performance parameters of silicon
solar cell. Solar Energy Materials and Solar Cells,
92(12), 1611-1616.
Sze, S. M., & Ng, K. K., 1981. Physics of semiconductor
devices. Creator/Author, Sze, sm. Publication Date,
1981 Jan 01. OSTI Identifier, OSTI ID: 5381484...
Takeda, Y., & Motohiro, T., 2013. Intermediate band
assisted hot carrier solar cells using indirect band gap
absorbers. Progress in Photovoltaics: Research and
Applications, 21(6), 1308-1318.
Varshni, Y. P., 1967. Temperature dependence of the
energy gap in semiconductors. Physica, 34(1), 149-154.
PHOTOPTICS2015-InternationalConferenceonPhotonics,OpticsandLaserTechnology
100
