
A New Kernel for Outlier Detection in WSNs Minimizing MISE
Rohit Jain, C. P. Gupta and Seema Sharma
Department of Computer Science and Engineering, Rajasthan Technical University, Kota, India
Keywords: Kernel, Kernel Density Estimation, Mean Integrated Squared Error, Outlier Detection.
Abstract: In sensor network, data generated by various sensors deployed at different locations need to be analyzed in
order to identify interesting events correspond to outliers. The presence of outliers may distort contained
information. To ensure that the information is correctly extracted, it is necessary to identify the outliers and
isolate them during knowledge extraction phase. In this paper, we propose a novel unsupervised algorithm
for detecting outliers based on density by coupling two principles: first, kernel density estimation and
second assigning an outlier score to each object. A new kernel function building a smoother version of
density estimate is proposed. An outlier score is assigned to each object by comparing local density estimate
of each object to its neighbors. The two steps provide a framework for outlier detection that can be easily
applied to discover new or unusual types of outliers. Experiments performed on synthetic and real datasets
suggest that the proposed approach can detect outliers precisely and achieve high recall rates which in turn
demonstrate the potency of the proposed approach.
1 INTRODUCTION
Tremendous growths in wireless sensor network
technology have enabled the decentralized processing
of enormous data generated in network, scientific and
environmental sensing applications at low
communication and computational cost. Generated
sensor data may pertain to physical phenomenon
(like temperature, humidity, and ambient light),
network traffic, spatiotemporal data about weather
pattern, climate change or land cover pattern etc.
Availability of vast amount of sensor data and
imminent need for transforming such data into true
knowledge or into useful information require
continuous monitoring and analysis as they are
highly sensitive to various error sources. True
knowledge provides useful application-specific
insight and gives access to interesting patterns in
data; the discovered pattern can be used for
applications such as fraud detection, intrusion
detection, earth science etc. Sudden changes in the
underlying pattern may represent rare events of
interest or may be because of errors in the data.
Outlier detection refers to detecting such abnormal
patterns in the data.
Several definitions have been proposed, but none
of them is universally accepted because, the
measures and definition of outliers vary widely.
Barnett et al. (Barnett and Lewis 1994) defined
outliers as “an observation or subset of observations
which appears to be inconsistent with the remainder
of that set of data”.
Outliers may arise due to fraudulent behavior,
human error, malfunctioning or injection in sensing
devices, faults in computing system and uncontrolled
environment. Outlier shows deviation from normal
behavior. Declaration of outlier based on observed
deviation in the values is a subjective judgement and
may vary depending upon application.
Several approaches for detecting outliers have been
proposed (Chandola, Bannerjee and Kumar 2009;
Hodge and Austin 2004; Gupta, Aggarwal and Han
2013). Techniques for outlier detection can be
classified as either statistical approach (Knorr and
Raymond 1997), distance based approaches, density
based approaches, profiling methods, or model based
approaches. In statistical approach, data points are
first modeled using stochastic distribution, and then
are labeled as outliers based on their fitness with the
distribution model. An outlier score is assigned to
each object based on their nearest neighbor distances
by distance based outlier detection technique. In
density based approach, an outlier score is computed
by comparing the local density estimate of each
object to the local density estimate of its neighbors,
and the objects are flagged as outliers based on their
169
Jain R., Gupta C. and Sharma S..
A New Kernel for Outlier Detection in WSNs Minimizing MISE.
DOI: 10.5220/0005318401690175
In Proceedings of the 4th International Conference on Sensor Networks (SENSORNETS-2015), pages 169-175
ISBN: 978-989-758-086-4
Copyright
c
2015 SCITEPRESS (Science and Technology Publications, Lda.)

outlier score. In profiling methods, different
techniques of data mining are used to build profiles
of normal behavior, and deviations from these
underlying profiles are flagged as outliers. In model-
based approaches, first, by using some predictive
models, the normal behavior is characterized, and
then the deviations from the normal behavior are
flagged as outliers.
In this paper, we propose an outlier detection
algorithm combining statistical and the density based
approaches. Our proposed approach uses kernel
density estimators to approximate the data
distribution and then computes the local density
estimate of each data point, and thus detects potential
outliers. Experiments performed on both synthetic
and real data sets shows that the proposed approach
can detect outliers precisely and achieve high recall
rates, which in turn demonstrate the potency of the
proposed approach.
Rest of the paper is organized as follows: Section
II describe the literature review of the work. Section
III explains the kernel density estimators. Section IV
presents the proposed work. Section V provides the
discussion on results. Section VI concludes the work.
2 RELATED WORK
Breunig et al. (Breunig, Kriehel, Raymond and
Sander 2000) introduced Local Outlier Factor (LOF)
for detecting outliers in a multidimensional dataset.
In the proposed scheme, local density estimate of
each object were compared with average density
estimate for MinPts-nearest neighbors. The resulted
density ratio was referred as local outlier factor.
Local outlier factor was computed in order to
determine the physical location of each object in
feature space. An object lied deep inside a cluster
when its local outlier factor was approximately 1
whereas an object that got higher value of local
outlier factor corresponds to low neighborhood
density. An object with higher local outlier factor
was flagged as an outlier. The proposed method was
free from local density problem but dependent on the
choice of MinPts.
Local Outlier Correlation Integral (LOCI)
(Papadimitriou, Kitagawa, Gibbons and Faloutsos
2003) was based on the concept of multi-granularity
deviation factor (MDEF) and dealt with both local
density and multi-granularity successfully. The
scheme had lower sensitivity to chosen parameters.
The proposed scheme strictly relied on counts and
needed to test arbitrary
radii
ε
−
. An automatic,
data-dedicated cut-off was provided to determine
whether a point is an outlier. In the proposed scheme,
MDEF was computed for each data point in feature
space. A data point with MDEF of 0 signified that it
got neighborhood density equal to average local
neighborhood density whereas a data point with large
MDEF was flagged as an outlier.
A variant of LOF was proposed by Latecki et al.
(Latecki, Lazarevic, Pokrajac 2007) combining the
LOF and kernel density estimation in order to utilize
the strength of both in density based outlier detection,
which was referred as outlier detection with kernel
density function. In this approach, first, a robust local
density estimate was generated with kernel density
estimator and then by comparing the local density
estimate of each data point to the local density
estimate of all of its neighbors, the outliers were
detected. Local density factor (LDF) is computed for
each data point in feature space and the data points
with higher LDF values were flagged as outliers.
Kriegel et al. (Kriegel, Kröger, Schubert Zimek
2009) proposed a method for local density based
outlier detection referred as Local Outlier Probability
(LoOP) which was more robust to the choice of
MinPts. The proposed method combined the local
density based outlier scoring with probability and
statistics based methods. An outlier probability in the
range of (0, 1) was assigned to each data point as
outlier score signifying severity of outlierness. More
specifically, higher the outlier score meant more
severe a point to be declared as outlier.
Most of the density based outlier detection
methods were bounded to detect specific type of
outliers. Schubert et al. (Schubert, Zimek, Kriegel
2014) proposed a general framework for density
based outlier detection referred as KDEOS and could
be adjusted to detect any specified types of density-
based outliers. In KDEOS, the density estimation and
the outlier detection steps were decoupled in order to
maintain the strength of both.
Several Non-parametric estimators were
presented in (Zucchini, Berzel, Nenadic 2005).
Histogram was the simplest non-parametric estimator
used for density estimation but generated density
estimates were highly dependent on the starting point
of bins. Kernel Density Estimators (Aggarwal 2013;
Silverman 1986) were used as an alternative to
histograms. KDE were superior in terms of accuracy
and hence, had attracted a great deal of attention. A
smoother version of density profile was constructed
by kernel density estimator.
Sheng et al. (Sheng, Li, Mao and Jin 2007)
introduced Outlier Detection in Wireless Sensor
Network based on histogram method to detect
distance based outliers. In the proposed method, to
SENSORNETS2015-4thInternationalConferenceonSensorNetworks
170

filter out unnecessary observations correspond to
potential outlier the collected hints about data
distribution are modeled as histogram.
The problem associated with unsupervised outlier
detection in WSN was addressed by Branch et al.
(Branch, Giannella, Szymanski, Wolf and Kargupta
2013). The proposed algorithm for outlier detection
was generic evidenced by its suitability to various
outlier detection heuristics and it does not require, for
a data source, any prior assumption about global
model.
Kernel density estimation was coupled with the
various outlier detection methods in order to build a
framework for detecting density based outliers and
the resulted quality of density based outlier detection
was improved. Outlier score is dependent on the
choice of approach used to detect outliers. Several
approaches are used for detecting outliers using
kernel density estimation. In all these schemes, the
density estimate is constructed with previously
available kernel functions (Zucchini, Berzel, Nenadic
2005). Most of these works considered performance
measure for outlier detection while ignoring accuracy
of density estimate. We propose a kernel function
that can improve the accuracy of the density estimate
quantified by Mean Integrated Squared Error
(MISE), and then incorporate these density estimates
in the computation of outlier score in order to
improve the efficiency of outlier detection method.
3 KERNEL DENSITY
ESTIMATOR
Kernel density estimators belong to non-parametric
(Zucchini, Berzel, Nenadic 2005) class of density
estimators. The non-parametric estimators
incorporate all data points to reach an estimate.
Contribution of each data point in an estimate is
smoothed out by kernel estimator. Kernel density
estimators place a kernel K on each data point
x
i
in
the sample. Let, x
1
, x
2
,…,x
n
be the sample of size
n
and dimensionality
dim which are identically and
independently distributed according to some
unknown density
()
f
x . Expected density
estimate
()
ˆ
f
x
is the convolution of true unknown
density
()
f
x with kernel
K
is computed as follows:
()
()
()
11
ˆ
dim
1
n
x
x
i
fx K
i
nhx
i
hx
i
−
=
∑
=
⎛⎞
⎜⎟
⎜⎟
⎝⎠
(1)
where,
K
is a non-negative, real-valued kernel
function of order-
p
(degree of polynomial), and
()hx
i
is the bandwidth applied at each data point
i
x
.
A univariate kernel function
K
of order-2 must
satisfy the requirements of (i) unit area under the
curve, 9ii) symmetry, (iii) zero odd moments, and
(iv) finite even moments.
Quality of estimated density is determined by the
choice of both the smoothing parameter and the
kernel. A kernel may exhibit either finite or infinite
support. A kernel with finite support is considered as
optimal. The accuracy of the kernel is quantified by
Mean Integrated Squared Error (MISE) (Marron and
Wand 1992). The MISE between the estimated
density
ˆ
()
f
x and the actual density ()
f
x is
computed using:
1/5
5
24 4/5
ˆ
(, ) ( ) ( )( '')
2
4
MISE f f K R K R f n
μ
−
=
⎡⎤
⎣⎦
(2)
In other words,
1/5
24
() ()
2
MISE K R K
αμ
⎡
⎤
⎣
⎦
where,
2
(K) K (u)Rdu=
∫
is the roughness,
K
2
(K) (u)
2
u du
μ
=
∫
is second moment of
K(u) and
''
f
is second derivative of f.
4 PROPOSED WORK
1. Kernel Function
We propose a kernel function of order-2 as follows:
()
1
2
32 3/2
,
1.56
forKuu
proposed h
π
=− <
(3)
It satisfies all the requirements of being a kernel
function which are described below:
(i)
Area under Curve
()
()
3/2
1
2
.32
1.56
3/2
duKudu u
π
=−
∫∫
−
3/2
3
22
31
1.56 3
0
u
u
π
=− =
⎡⎤
⎢⎥
⎣⎦
(ii)
Symmetry
() ( )
K
uKu=−
(iii)
Odd Moment
()
()
3/2
1
2
32
1.56
3/2
uK u du u u du
π
=−
∫∫
−
ANewKernelforOutlierDetectioninWSNsMinimizingMISE
171

3/2
13 2
24
0
1.56 2 4
3/2
uu
π
=−=
−
⎡⎤
⎢⎥
⎣⎦
(iv)
Even Moment
()
2
uKudu
∫
()
3/2
1
22
32
1.56
3/2
uudu
π
=−
∫
−
3/2
13 2
35
1.56 3 5
3/2
uu
π
=−
−
⎡⎤
⎢⎥
⎣⎦
0.2999=
(v)
Roughness
()
2
K
udu
∫
()
2
2
2
3/2
1
1.56
3/2
32 duu
π
=
∫
−
⎛⎞
−
⎜⎟
⎝⎠
23/2
1412
53
29
1.56 5 3
0
uu u
π
=+−
⎛⎞⎡ ⎤
⎜⎟
⎢⎥
⎝⎠⎣ ⎦
0.4899=
2. Outlier Detection
Outlier detection using kernel density estimation
involves two principled and clear steps, which are
described as follows:
Step 1: Density Estimation- In this step, the density
estimate is constructed with a non-parametric
estimator which is superior in terms of accuracy is
the kernel. The kernel function is taken as an input
parameter to the algorithm. We will use our
proposed kernel function of bandwidth
h
and
dimensionality
d
for density estimation:
2
1
32
,
2
1.56
u
K
proposed h
d
h
h
π
=−
⎛⎞
⎜⎟
⎜⎟
⎝⎠
(4)
The balloon estimator (Branch, Giannella,
Szymanski, Wolf and Kargupta 2013) is:
1
() ( ).
,()
K
DE o K o p
balloon h h o
p
n
=−
∑
(5)
In our approach, we will use balloon estimator
for constructing the density estimates because it
optimizes
M
ISE
pointwise (Terell and Scott 1992).
The smoothing parameter applied to the data
controls the smoothness of the constructed density
estimate. A nearest-neighbor distance (Loftsgaarden
and Quesenberry 1965) is a classic approach to
calculate local kernel bandwidth. Sheather and Jones
(Sheather and Jones 1991) proposed a data-driven
procedure for selecting the kernel bandwidths
known as “plug-in bandwidth estimator”. To prevent
from division by 0 we
use
() min{ ( , ),}ho mean d po
pkNN
ε
=
∈
.
Selection of parameter
k
is non-trivial. In our
proposed scheme, instead of choosing a single value
of
k
a range of
......
max
min
kk k=
is employed that
produces a series of density estimate, one for each
k
.
The proposed scheme is elegant, computationally
efficient, and produces stable and reliable results.
Step 2: Density Comparison- In this step, the local
density estimate of each object
o
is compared to the
local density estimate of all of its nearest
neighbors
()pkNNo∈ . Let,
ρ
be the local density
estimate and
(, )Nok be the number of objects in
the
k
-neighborhood of object
o
. The resulted
density ratio which is referred as Local Outlier
Factor (LOF) is computed using:
()
()
()
()
(, )
p
o
pkNNo
LOF o
Nok
ρ
ρ
∑
∈
=
(6)
An LOF value corresponding to each value of
k
in
min max
...kk
is computed and then mean of LOFs is
taken over the range in order to produce more
stabilized LOF value for each object
o
.
Z
score−
Transformation is utilized to standardize the outlier
scores and objects with
3Zscore−≥
are declared
outliers.
5 RESULTS
1. Kernel Density Estimator
Table 1 shows statistics and comparison of our
proposed kernel against various previously available
kernel functions. Our proposed kernel function has
minimum
M
ISE . The value of efficiency is relative
efficiency computed using
() ()
{
}
ˆˆ
using using
M
ISE f K MISE f K
opt proposed opt
.
For example, the efficiency of Gaussian kernel is
approximately 96%. That is the
()
ˆ
M
ISE f
opt
obtained using proposed kernel function with
96n =
is approximately equal to the
()
ˆ
M
ISE f
opt
obtained using a Gaussian kernel function
with 100
n = .
SENSORNETS2015-4thInternationalConferenceonSensorNetworks
172
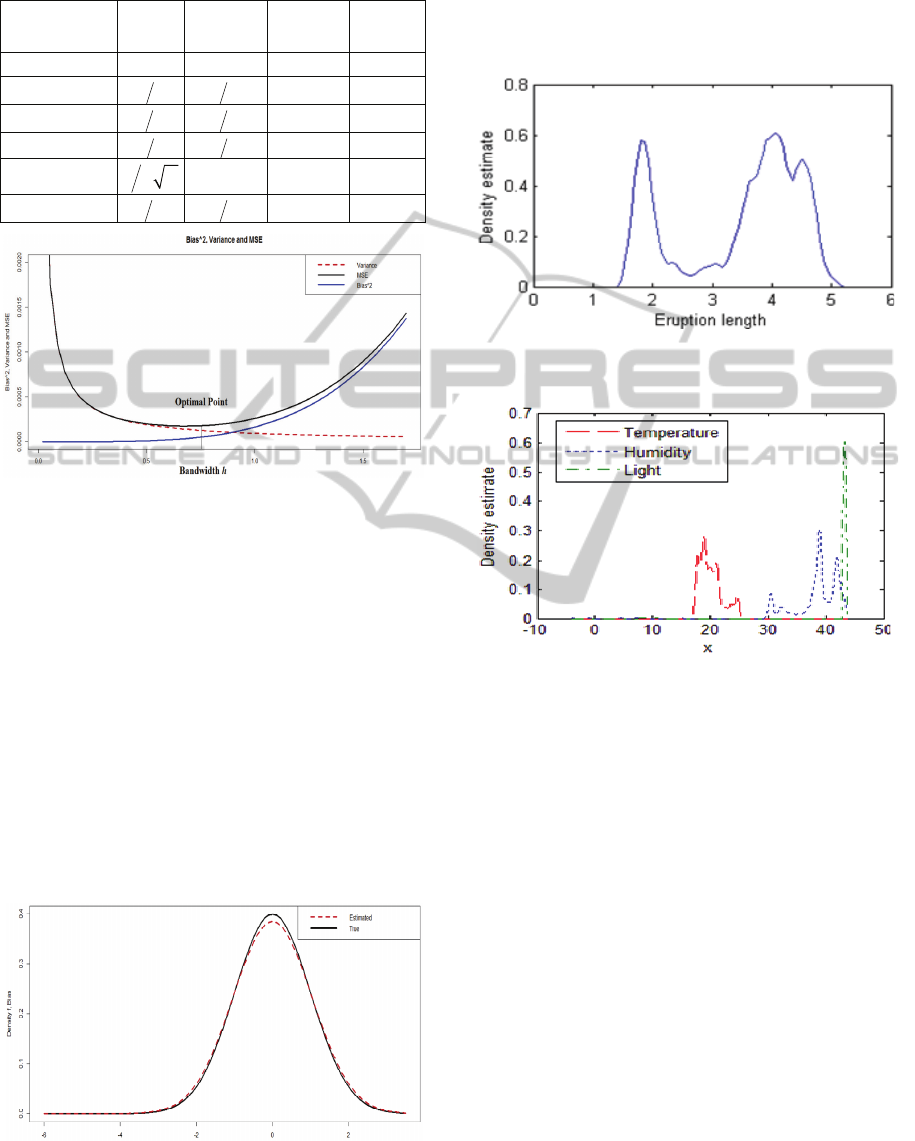
Table 1: statistics and comparison of various kernel
functions.
Kernels
()
R
K
()
2
K
μ
MISE Efficiency
Proposed
0.4899 0.2999 0.34904
1
Epanechnikov
35 15
0.34908
0.9998
Biweight
57 17
0.35079
0.9950
Triangular
23 16
0.35307
0.9885
Gaussian
12
π
1
0.36341 0.9604
Box
12 13
0.37010
0.9430
Figure 1: Analysis of statistical properties.
Figure 1 shows the variation of statistical properties
of the proposed KDE with bandwidth. Bias and
variance, the two subcomponents of prediction
errors are unable to give appropriate understanding
about prediction model behavior as there is always a
tradeoff between bias and variance. So, instead of
relying on specific decomposition (viz. bias and
variance) we relied on overall error that takes into
account both the sources of error i.e. error due to
bias and variance (Zucchini, Berzel, Nenadic 2005).
The optimal point drew in figure 1 refers to the
optimal bandwidth
h
opt
at which the overall error is
minimized.
Figure 2 reflects the bias effects for a kernel
density estimate.
Figure 2: Visualization of bias effects.
2. Kernel Density Estimation and Outlier Detection
Datasets:
To evaluate the proposed kernel and
outlier detection method, experiments were carried
out on real as well as synthetic datasets. In our
experiments, we used two real datasets.
Figure 3: Density estimate constructed from old faithful
geyser data
0.25h =
.
Figure 4: Density estimate constructed from Intel Lab
data
0.5h =
.
The first dataset contains the data about
eruptions of old faithful geyser taken from
Weisberg (1980) and the second datasets
contains the data about temperature, humidity,
light, and voltage collected between February
28th and April 5th, 2004 from 54 Mica2Dot
motes deployed in the Intel Berkeley Research
Lab (Intel Lab Data).
(i) Evaluation of Outlier Detection Technique: We
have applied the kernel density estimation step
to approximate the density at various kernel
points. Figures 3 and 4 shows the density
estimate constructed from the observations of
eruptions of old faithful geyser and Intel lab
data.
These density estimates are incorporated in
outlier detection method to calculate Local Outlier
Factor (LOF) of each data point present in the
particular dataset. Computed LOF values will
expose the indices of potential outliers. We have
ANewKernelforOutlierDetectioninWSNsMinimizingMISE
173

also applied both of these steps to the synthetic
datasets and have evaluated the impact of
kvalues−
on LOF. Figure 5 shows the impact of
k value−
on Local Outlier Factor (LOF). It
demonstrates a simple scenario where the data
objects belong to a Gaussian cluster i.e. all the data
objects within a cluster follows a Gaussian
distribution. For each
k value−
ranging from 3 to
100, the mean, minimum and maximum LOF values
are drawn. It can be observed that, with
increasing
k value−
, the LOF neither increases nor
decreases monotonically. For example, as shown in
Figure 5, the maximum LOF value is fluctuating as
k value−
increases continuously and eventually
stabilizes to some value showing that a single value
of
k
is inefficient to produce a more accurate LOF
value. So, mean of LOFs is taken over the range of
......
max
min
kk k=
in order to produce more
stabilized LOF values. These are shown in Figure 5.
Figure 5: Fluctuation of outlier factors within a Gaussian
cluster.
6 CONCLUSIONS
In this paper, we have proposed a symmetric and
computationally efficient kernel of order-2. Our
proposed kernel obtained lower MISE than the
previously available kernels and hence, produced a
more accurate density estimate. We have also
proposed an outlier detection method that uses our
proposed kernel function in order to construct density
estimates. We have decoupled the density estimation
and the local density based outlier detection steps in
order to preserve the strength of both. As a
consequence, the resulted framework can be easily
adjusted to any application-specific environment.
Experiments performed on both real and synthetic
datasets indicate that the proposed techniques can
detect outliers efficiently. As future work, we will be
focusing on classification of transient faults in
wireless sensor networks using outlier scores.
REFERENCES
Aggarwal C. C., 2013. Outlier analysis, Springer,
doi:10.1007/978-1-4614-6396-2.
Barnett, V. and Lewis, T., 1994. Outliers in statistical
data, Wiley, vol. 3, New York.
Branch J. W., Giannella C., Szymanski B., Wolf R. and
Kargupta H., 2013. “In-Network Outlier Detection in
Wireless Sensor Networks,” Knowledge and
Information System, vol. 34 no. 1, pp. 23-54.
Breunig M. M.,. Kriegel H. P., Raymond T. Ng. and
Sander J., 2000. “LOF: identifying density-based local
outliers,” ACM Sigmod Record, vol. 29 no. 2, pp. 93-
104, doi:10.1145/335191.335388.
Chandola V., Banerjee A. and Kumar V., 2009. “Anomaly
detection: A survey”, ACM Computing Surveys
(CSUR), vol. 41 no. 3: 15, pp. 1-58,
doi:10.1145/1541880.1541882.
Gupta M., Gao J., Aggarwal C.C. and Han J., 2013.
“Outlier detection for temporal data: A survey”, IEEE
Transaction on Knowledge and Data Engineering, vol.
25 no. 1, doi:10.1109/TKDE.2013.184.
Hodge V. J., Austin J., 2004. “A survey of outlier
detection methodologies,” Artificial Intelligence
Review, vol. 22 no. 2, pp. 85-126, doi:10.1007/
s10462-004-4304-y.
Intel Lab Data downloaded from http://db.csail.mit.edu/
labdata/labdata.html.
Jin W., Tung A. KH, Han J. and Wang W., 2006.
“Ranking outliers using symmetric neighborhood
relationship,” Advances in Knowledge Discovery and
Data Mining, Springer Berlin Heidelberg, pp. 577-
593, doi:10.1007/11731139_68.
Knorr E. M. and Raymond T. Ng., 1997. “A Unified
Notion of Outliers: Properties and Computation,”
Proc. KDD. Available at: http://www.aaai.org/Papers/
KDD/1997/ KDD97-044.pdf.
Kriegel H. P., Kröger P., Schubert E., Zimek A., 2009.
“LoOP: local outlier probabilities,” Proc. of the 18th
ACM conference on Information and knowledge
management (CIKM 09), ACM, pp. 1649-1652,
doi:10.1145/1645953.1646195.
Latecki L. J., Lazarevic A. and Pokrajac D., 2007. “Outlier
detection with kernel density functions,” Machine
Learning and Data Mining in Pattern Recognition,
Springer Berlin Heidelberg, pp. 61-75,
doi:10.1007/978-3-540-73499-4_6.
Loftsgaarden D. O. and Quesenberry C. P., 1965. “A
nonparametric estimate of a multivariate density
functions,” The Annals of Mathematical Statistics, vol.
36 no. 3, pp. 1049-1051. Available at:
http://projecteuclid.org/euclid.aoms/1177700079.
Marron J. S. and Wand M. P., 1992. “Exact mean
integrated squared error,” The Annals of Statistics,
vol. 20 no. 2, pp. 712-736. Available at:
http://projecteuclid.org/download/pdf_1/euclid.aos/11
76348653.
Papadimitriou S., Kitagawa H., Gibbons P. B. and
Faloutsos C.,2003. “Loci: Fast outlier detection using
the local correlation integral,” Proc. of the 19th
SENSORNETS2015-4thInternationalConferenceonSensorNetworks
174

International Conference on Data Engineering (ICDE
03), IEEE, Bangalore, India, pp. 315-326,
doi:10.1109/ICDE.2003.1260802.
Schubert E., Zimek A. and Kriegel H.P., 2014.
“Generalized Outlier Detection with Flexible Kernel
Density Estimates”, Proc. of the 14
th
SIAM
Conference on Data Mining (SDM 14), 2014.
Available at: http://www.dbs.ifi.lmu.de/~zimek/
publications/SDM2014 /KDEOS.pdf.
Sheather S. J. and Jones M. C., 1991. “A reliable data-
based bandwidth selection method for kernel density
estimation,” Journal of the Royal Statistical Society,
series B vol. 53 no. 3, pp. 683-690. Available at:
http://www.researchgate.net/publication/ 224817413.
Sheng B., Li Q., Mao W. and Jin W., 2007. “Outlier
Detection in Sensor Network”, MobiHoc 07, ACM,
pp. 219-228.
Silverman B.W., 1986. Density estimation for statistics
and data analysis, Vol. 26, CRC press, ISBN 0-412-
24620-1.
Terrell G. R. and Scott D. W., 1992. “Variable kernel
density estimation,” The Annals of Statistics, pp.
1236-1265. Available at: http://www.jstor.org/stable/
2242011.
Zucchini W., Berzel A. and Nenadic O., 2005. Applied
smoothing techniques.
ANewKernelforOutlierDetectioninWSNsMinimizingMISE
175
