
Unsupervised Segmentation Evaluation for Image Annotation
Annette Morales-Gonz´alez
1
, Edel Garc´ıa-Reyes
1
and Luis Enrique Sucar
2
1
Advanced Technologies Application Center, Rpto. Siboney, Playa, La Habana, Cuba
2
Instituto Nacional de Astrof´ısica,
´
Optica y Electr´onica, Puebla, Mexico
Keywords:
Unsupervised Segmentation Evaluation, Automatic Image Annotation, Irregular Graph Pyramid.
Abstract:
Unsupervised segmentation evaluation measures are usually validated against human-generated ground-truth.
Nevertheless, with the recent growth of image classification methods that use hierarchical segmentation-based
representations, it would be desirable to assess the performance of unsupervised segmentation evaluation to
select the most suitable levels to perform recognition tasks. Another problem is that unsupervised segmenta-
tion evaluation measures use only low-level features, which makes difficult to evaluate how well an object is
outlined. In this paper we propose to use four semantic measures, that combined with other state-of-the-art
measures improve the evaluation results and also, we validate the results of each unsupervised measure against
an image annotation algorithm ground truth, showing that using measures that try to emulate human behaviour
is not necessarily what an automatic recognition algorithm may need. We employed the Stanford Background
Dataset to validate an image annotation algorithm that includes segmentation evaluation as starting point, and
the proposed combination of unsupervised measures showed the best annotation accuracy results.
1 INTRODUCTION
There is a growing tendency to use segmentation-
based image representations for object detection
and recognition. For instance, the winners of the
ILSVRC2013 competition (ImageNet Large Scale
Visual Recognition Challenge 2013) (Russakovsky
et al., 2014), employed image segmentation in their
object detection pipelines. Many other automatic im-
age annotationapproaches start from a superpixelrep-
resentation in order to avoid the complexity of anno-
tation at pixel level (Huang et al., 2011; van de Sande
et al., 2011; Arbelaez et al., 2012; Morales-Gonz´alez
and Garc´ıa-Reyes, 2013; Zhang and Xie, 2013). In
these cases, they use segmentation algorithms to pro-
duce an initial partition of the image pixels, but there
is always the question of which is a good level of seg-
mentation to start the annotation process for a partic-
ular image. If the annotation algorithm uses a hier-
archy of image partitions, it is even more important
to assess the relevance of each partition to the recog-
nition problem, in order to reduce noise (too over-
segmented partitions) and to avoid loosing informa-
tion (too under-segmented partitions). Nevertheless,
the unsupervised segmentation evaluation community
has not focused on this particular problem yet.
Unsupervised segmentation evaluation is usually
addressed without taking into account the ultimate
goal of the task where the segmentation result is to be
used. Most approaches compare the results of auto-
matic segmentation against human-annotated ground-
truth, or against other automatic segmentation results
(Zhang et al., 2008; Csurka et al., 2013). Neverthe-
less, if segmentation is an initial step in a higher level
task, such as image annotation and object recognition,
the ground-truth provided by humans may not be ade-
quate in order to obtain good results in the recognition
process. It has been suggested by human perception
studies (Olson, 2001), that in natural vision the visual
input is divided into primitive objects, instead of well
defined objects. Therefore, the final output of human
perception (an object as a whole) might not be the
initial perception cues employed to identify objects
or understand scenes. The same applies for automatic
recognition, where the final human segmentation (ob-
jects as wholes) might not be what a machine needs
to perform the classification process. Therefore, eval-
uating segmentation results in terms of what’s more
similar to a human segmentation can be misleading
in order to know which measure should be used. In
this case, it would be desirable that the suitability of
a segmentation algorithm would be measured by the
success of the end application.
Furthermore, segmentation evaluation is per-
formed using low-level cues of the images, such as
edges, color and texture uniformity, inter-region dis-
148
Morales-González A., García-Reyes E. and Sucar L..
Unsupervised Segmentation Evaluation for Image Annotation.
DOI: 10.5220/0005314201480155
In Proceedings of the 10th International Conference on Computer Vision Theory and Applications (VISAPP-2015), pages 148-155
ISBN: 978-989-758-090-1
Copyright
c
2015 SCITEPRESS (Science and Technology Publications, Lda.)

parities, etc. (Zhang et al., 2008; Dogra et al., 2012;
Khan and Bhuiyan, 2014), but in reality it’s very dif-
ficult to assess automatically if an image is well seg-
mented or not if there is no knowledge of the semantic
entities that are represented there.
In this work, we aim at combining unsupervised
segmentation evaluation with an automatic image an-
notation algorithm, in order to find which are the best
image partitions to start the recognition process. The
annotation algorithm is based on a segmentation hier-
archy, where annotation and segmentation are refined
in several iterations, taking advantage of each other
information to improve the final recognition result.
We propose two contributions: (1) to incorporate se-
mantic information in the unsupervised segmentation
evaluation process and (2) to measure the accuracy
of the segmentation evaluation in terms of recogni-
tion accuracy, which is our ultimate goal. The results
obtained in the Stanford Background Dataset (Gould
et al., 2009) support these two contributions, showing
that the semantic features play an important role in the
evaluation process and also, that the behaviour of the
segmentation evaluation measures is different when
their results are used as input of an image annotation
task.
The remaining of this paper includes an analysis
of previous works related to unsupervised segmenta-
tion evaluation and hierarchical image classification
in Section 2. Section 3 describes the hierarchical an-
notation approach chosen to test the output of seg-
mentation evaluation algorithms. The segmentation
evaluation measures used as features in a classifica-
tion approach to determine good and bad segmenta-
tions are presented in Section 4, as well as new mea-
sures to take into account semantic information of the
classes previously predicted in the image. Section
5 shows the experimental results along with several
analysis related to the presented measures which lead
to the final conclusions of the paper.
2 RELATED WORK
According to what have been explained in the In-
troduction, segmentation-based image classification
and unsupervised segmentation evaluation are two re-
search fields with a huge disconnection, even though
they can be related in some interesting points, in order
to improve the results of the former. In this Section,
we will analyse several relevant works on both fields
to illustrate the necessity of combining them and redi-
recting the final goal of segmentation evaluation.
2.1 Hierarchical Image Classification
Approaches
Many methods for image annotation work at pixel
level, but they face several drawbacks, such as the
complexity of classifying every pixel of an image
and the limited amount of information that a single
pixel and its neighborhoodmay contain (Russell et al.,
2014).
Super-pixel based methods have appeared re-
cently, starting with an initial segmentation of the im-
age based on low-level cues and then, performing the
annotation over these segments. The advantages over
the pixel-based representation can be noted in the pos-
sibility of computing better region-basedfeatures, and
the classification can be performed over a reduced set
of entities. Nevertheless, this representation comes
with the problem of finding a good segmentation of
the image where the annotation process can obtain
good results.
Hierarchical models can be used to incorporate lo-
cal and global image cues. Hierarchical segmenta-
tions, in general, are formed by a stack of image par-
titions (or levels) where each one is built by merging
regions from the level below. Therefore, lower lev-
els are over-segmented and higher levels are under-
segmented. In (Arbelaez et al., 2012) and (Zhang and
Xie, 2013), a hierarchy of segmentations is used for
image annotation but no level selection is performed,
i.e. they use the entire hierarchy for generating can-
didate localizations of objects, producing more than
1300 candidates per image. The proposal of (van de
Sande et al., 2011) does not select levels either, it
starts from the over-segmentation given by a segmen-
tation algorithm and uses the whole hierarchy that’s
built over that for object detection. The work pre-
sented in (Zankl et al., 2012) also deals with the la-
beling of a segmentation hierarchy, but in this case,
they use human input to improve the final image an-
notation. No automatic segmentation level selection
is performed, although the interaction with humans in
the labeling process makes it pointless to some extent.
As can be seen, all these methods work with a hi-
erarchy of segmentations, but none of them make an
evaluation of the suitability of the segmentation lev-
els employed. Including levels too over-segmented or
under-segmented in the recognition process may in-
corporate noisy partitions and definitely will increase
the overall processing cost.
The problem of finding relevant levels in a hi-
erarchy in order to perform object recognition was
addressed by (Morales-Gonz´alez and Garc´ıa-Reyes,
2013), by selecting levels that better preserve the
edges present in an edge mask of the image (com-
UnsupervisedSegmentationEvaluationforImageAnnotation
149

puted using the Canny edge detector), thus inheriting
the problemsof automatic edge detection, and making
the assumption that this edge mask would preserve the
actual object boundaries.
2.2 Unsupervised Segmentation
Evaluation Methods
In (Zhang et al., 2008) a thorough comparison and
analysis of unsupervised segmentation evaluation
methods is presented. They performed four different
experiments, from which, the closest to our goals is
the second one. In this experiment they compared two
image partitions that were segmented with the same
segmentation method (with different parameters), and
the evaluation measures should decide which partition
is the best. The measures with better performance in
this test were Q, Zeb, and F
RC
in that order. Q mea-
sures the average squared color error of the segments,
using penalization terms to decrease the bias towards
both over-segmentation and under-segmentation. Zeb
uses the internal and external contrast of the regions,
measured in the neighborhood of each pixel, to per-
form the evaluation while F
RC
takes into account
intra-region homogeneity and inter-region disparity.
The MSET evaluation method, reviewed in
(Zhang et al., 2008) also, proposed to combine a lim-
ited set of measures into a classifier, which outper-
formed the individual results of these measures for the
second experiment. The set of measures employed
was composed of E, F, Q, and V
CP
. E uses region
entropy to measure intra-region uniformity and a lay-
out entropy to indicate which pixels belong to which
regions. F employs the average color error of the
regions, similar to the Q measure mentioned before.
V
CP
uses intra-object measures (e.g. shape regularity,
spatial uniformity, etc.), inter-object measures (such
as contrast) and each object is weighted by how much
attention it received by a human evaluator.
More measures have been introduced recently.
In (Morales-Gonz´alez and Garc´ıa-Reyes, 2013) they
proposed two measures B
G
and B
B
that were com-
bined as a weighted sum in order to select the best
levels in a hierarchy of segmentations. They are only
based on the edges of each partition and how well
they match the edges in an edge mask (computed us-
ing the Canny edge detector) of the original image. In
(Khan and Bhuiyan, 2014) they propose the weighted
self-entropy for region homogeneity and the weighted
mutual entropy for evaluating region disparity.
In the work presented by (Song et al., 2010) they
proposed a method for filtering levels of segmenta-
tion in a hierarchy. Levels in the hierarchy are Re-
gion Adjacency Graphs (RAGs) and they compute the
complexity of the graph on each level using Lapla-
cian graph energy in order to keep those levels whose
complexity is smaller than either of the neighboring
levels.
All the aforementioned measures work with low-
level features (color, texture, edges), but in practice,
it is too hard to perform an accurate assessment of
the outlining of objects or entities in an image using
this information alone. Some kind of higher semantic
knowledge should be included in order to know how
well the segmentation was performed. Besides, all
these measures have been evaluated against human-
generated ground truth. The differences of previous
approaches and ours are that we are proposing to in-
clude segmentation evaluation into an image annota-
tion process in a way that the segmentation evalua-
tion can make use of semantic features coming from
predicted classes. Also, the segmentation evaluation
measures will be evaluated according to their suit-
ability to predict good levels for the recognition pro-
cess instead of how well they fit a human-generated
ground truth.
3 HIERARCHICAL IMAGE
ANNOTATION
We use as base annotation system the approach pro-
posed by (Morales-Gonz´alez et al., 2013), named
HMRF-PyrSeg. They use as hierarchical representa-
tion the irregular graph pyramids, proposed by (Hax-
himusa and Kropatsch, 2004). An irregular graph
pyramid is a stack of successfully reduced graphs,
where each level is a RAG, i.e. vertices represent re-
gions and the adjacency between them is represented
by edges. At the base level, each pixel is a vertex and
the edges are the 4-connectivity among pixels. Using
a series of edge contractions and eliminations, each
level is reduced based on the regions internal and ex-
ternal contrast. The result is a segmentation hierar-
chy that can be traverse top-down and bottom-up and
preserves the topological distribution of the regions
throughout all its levels.
Using this representation, the algorithm HMRF-
PyrSeg works in the following way (Morales-
Gonz´alez et al., 2013):
• The whole graph pyramid is built using low-level
cues to segment the image.
• Starting from a predefined level, still over-
segmented, every vertex is labeled with a class,
using a base classifier (BC) that have been trained
previously using low-level features of the regions.
This BC must have a probabilistic output (ex.
VISAPP2015-InternationalConferenceonComputerVisionTheoryandApplications
150

Random Forest, SVM, Na¨ıve Bayes classifier),
which will be used as unary potentials to improve
the current BC labeling through a Markov Ran-
dom Field approach (see next step);
• The whole labeling of this level is improved by
means of a Hierarchical Markov Random Field
(HMRF), by imposing local constrains among
neighboring vertices (in the image plane) and par-
ent/child vertices (in the hierarchy structure);
• A new criterion for edge contraction is used to
create a new level of segmentation. This time, the
class assigned to each vertex by the HMRF, the
probabilities given by the BC to it and the distri-
bution of edges in each partition are combined in
order to select which are the vertices that should
be joined in the new level. In this way, semantic
information coming from the annotation process
is combined with low-level information to build
more meaningful segmentation levels.
• Once the new level is created, the whole annota-
tion process with the BC and the HMRF is per-
formed again, and this is repeated in several iter-
ations trying to find better image segmentations
that yield ultimately to a better recognition result.
Although this approach showed an improvement
with respect to other proposals that do not combine
the results of annotation and segmentation, problems
still arise due to the selection of the first level to be-
gin the whole process. If a level too over-segmented
is selected, it can introduce noise in the classification
process and this noise will be propagated through all
the levels due to the hierarchical information used to
classify each level. On the other hand, if an under-
segmented level is selected, the boundaries of the ob-
jects in the image will be lost and the classification
result will suffer as well. According to (Morales-
Gonz´alez et al., 2013) they used a fixed level to start
this process for all images, disregarding the the nature
of each independent image, and displaying the afore-
mentioned problem. An example of this can be seen
in Figure 1.
Although the overall result is better, for particular
images the results are quite bad. This issue can be ad-
dressed by selecting, for each image, the most appro-
priate level to begin the annotation process. Neverthe-
less, in the reviewed literature related to segmentation
evaluation, all works compared the results of the mea-
sures with the human evaluation, which, in this case,
doesn’t necessarily coincide with what’s best for an
automatic recognition process.
4 SEGMENTATION EVALUATION
IN A HIERARCHY
Since there are many evaluation methods, they mea-
sure different aspects of the image partition and they
are combined in many different ways (Zhang et al.,
2008), we chose the option of using several unsuper-
vised evaluation measures and combine their output
values with a classifier. Therefore, a segmentation
evaluation classifier (SEC) will be the one who finds
out which are the most relevant aspects to be mea-
sured and how they should be combined.
4.1 Training Information
In order to obtain training information for our SEC,
we use the training set employed for the image an-
notation process. This training set contains images
and their respective irregular pyramid representation
(i.e. a hierarchy of segmentations per image). In the
HMRF-PyrSeg algorithm, after performing the initial
classification of all the regions using the BC, we can
know which are the levels, for each image, that ob-
tained better accuracy results when compared with the
ground-truth of image annotation. Since our ultimate
goal is to improve the annotation results, it sounds
natural that the creation of new levels in the HMRF-
PyrSeg approach should start from the levels that ob-
tained better accuracy results with the BC. That’s why
we decided, for each image, to label the n levels that
obtained better accuracy with the BC as “good lev-
els”, and the rest as “bad levels”. We will train a bi-
nary classifier with these two labels. We compute all
the unsupervised measures for each partition of each
hierarchy and we provide these features with their
corresponding labels to train the SEC.
4.2 Segmentation Features
We chose several evaluators employed in the litera-
ture that measure low-level information of each parti-
tion to serve as features that characterize each image
segmentation. They can be seen in Table 1.
Since in the HMRF-PyrSeg algorithm we can
count with the first classification of each region with a
BC, we propose to use semantic information related to
this classification in order to add some kind of higher-
level information in the evaluation process. These se-
mantic features are 5, 6, 7 and 8 from Table 1.
With the BC, it is possible to have an initial pre-
diction of each region’s class. Using this information,
our proposals H
c
r
(Equation 1) and H
c
mr
(Equation 2)
are the same of H
r
and H
mr
respectively (referred as
H
G
(i) and H
G
( jk) in (Khan and Bhuiyan, 2014)), but
UnsupervisedSegmentationEvaluationforImageAnnotation
151
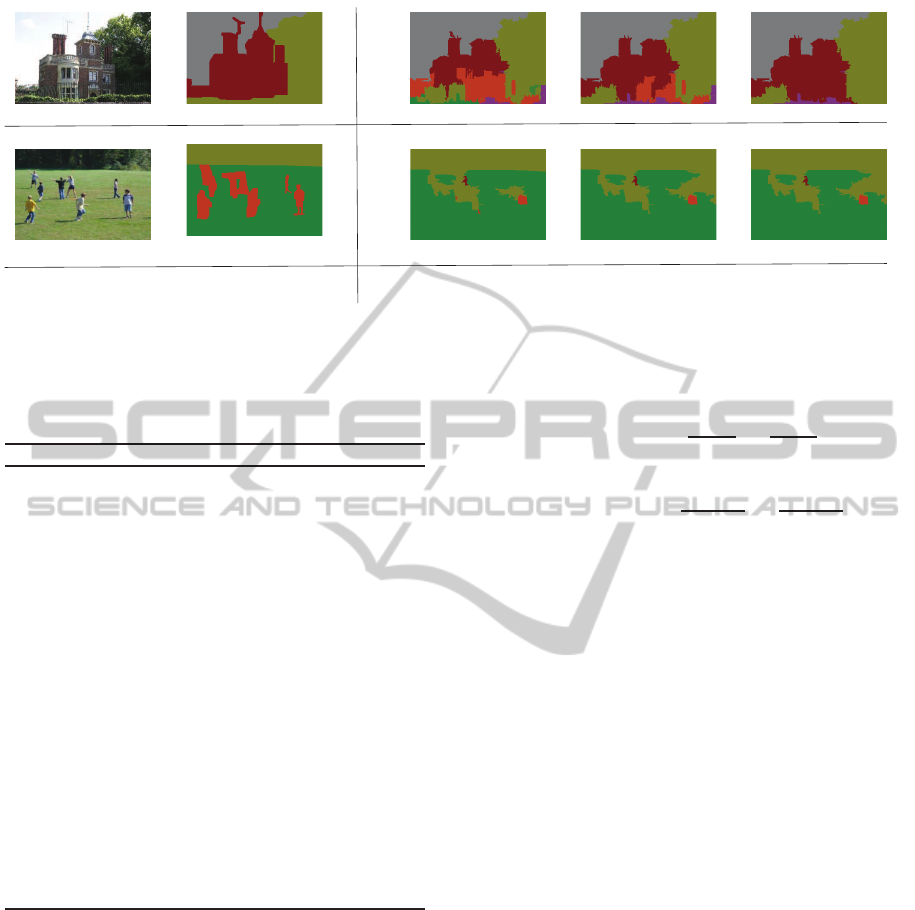
Original image Ground-truth Level 10 Level 14 Level 19
Figure 1: Example image segmentation/annotation results using HMRF-PyrSeg. Level 10 of the pyramid was fixed as starting
level for both images. As can be seen, this was a good choice for the first row, where the final result of segmentation/annotation
is adequate, but for the second row, level 10 had already lost many meaningful edges.
Table 1: Segmentation evaluation measures used as features
for the SEC.
No. Alias Description
1 N
r
Number of regions
2 S
r
Average size of regions
3 H
r
Average region’s self entropy
4 H
mr
Average inter-region’s mutual entropy
5 H
c
r
Average class’s self entropy
6 H
c
mr
Average inter-class’s mutual entropy
7 NP
p
Number of pixels with high probability
values
8 NP
r
Number of regions with high probabil-
ity values
9 Zeb Intra-region and inter-region contrast
10 Q Squared color error
11 E Entropy of regions and layout entropy
12 F Squared color error
13 B
G
Measure of good edges against Canny
edge mask
14 B
B
Measure of wrong edges against Canny
edge mask
15 P
r
Average perimeter of regions
16 B
n
Number of edge pixels against number
of Canny edge pixels
taking into account the whole class area instead of the
segmented region. In these equations, G is defined as
a feature that describe the pixels (ex. pixel intensity)
and G
(g)
c
i
is the set of all possible values of feature G
in the area where class c
i
was annotated. N
c
i
(t) is the
number of pixels with value t in the c
i
class region
and M
c
i
is the total number of pixels in this region.
Similarly, Equation 2 uses the same information
but for pairwise class analysis, changing the class
region being analyzed according to the subscripts in
each case. Subscripts c
i
, c
j
indicates that the region
is the union of all the pixels from classes c
i
and c
j
annotated in the image.
H
c
r
(c
i
) = −
∑
t∈G
(g)
c
i
N
c
i
(t)
M
c
i
log
N
c
i
(t)
M
c
i
(1)
H
c
mr
(c
i
, c
j
) = −
∑
t∈G
(g)
c
i
,c
j
N
c
i
,c
j
(t)
M
c
i
,c
j
log
N
c
i
,c
j
(t)
M
c
i
,c
j
(2)
This means that the entropy is computed in the
whole area where the class was detected, disregard-
ing the individual regions that compose that area. In
this case, we are measuring the degree of homogene-
ity in the class area detected (H
c
r
) and the disparity
among two different classes detected (H
c
mr
).
The other semantic features related to classifica-
tion that we are proposing to use are NP
p
and NP
r
.
They employ the probability output of the base classi-
fier. For the case of NP
p
we are measuring the amount
of pixels that obtained high probability values, nor-
malized by the total number of pixels in the image.
NP
r
does the same, but instead of taking pixels, they
count the amount of regions with high probability val-
ues, normalized by the number of regions.
The output of the measures presented in Table
1 can be concatenated into a vector to perform the
classification of each image segmentation into ”good
level” or ”bad level”. It would be desirable to employ
a classifier with probabilistic output, making possi-
ble to rank all the scores assigned to the segmentation
levels of an image in order to select the best ones.
5 EXPERIMENTS
The experiments were performed in the Stanford
Background Dataset (Gould et al., 2009), designed for
testing methods developed for geometric and seman-
tic scene understanding. It contains 715 images which
VISAPP2015-InternationalConferenceonComputerVisionTheoryandApplications
152

Figure 2: Example images taken from the Stanford Back-
ground Dataset. First column shows the original images
while second column shows their respective annotation
ground-truth, where each color represents one of the 8 se-
mantic labels present in this dataset.
are split in two subsets of 542 and 143 for training
and testing respectively. These subsets are randomly
generated and the results are averaged. The 8 seman-
tic labels annotated at pixel level are sky, tree, road,
grass, water, building, mountain, or foreground ob-
ject. Two example images from this dataset can be
seen in Figure 2 to the left, and their respective anno-
tation ground truth can be seen to the right.
Our objective in these experiments is to find out
the influence of choosing each segmentation evalua-
tion measure to select the starting levels of the anno-
tation process. Therefore, the ground truth to evaluate
the performance of the measures is given by the ac-
curacy obtained in the annotation process. Although
the evaluation results will certainly depend on the se-
lected ground-truth with respect to annotation, this is
a common weak point for all annotation/segmentation
tasks that are based on a subjective ground-truth cre-
ated by humans.
The irregular pyramids built for these images usu-
ally have around 20 levels, therefore, in order to avoid
severe over-segmentation and under-segmentation,
we decided to remove some lower and higher levels.
In the present case we are analyzing levels from 6 to
16 of each pyramid.
In order to select which is the best combination of
measures to use in the SEC, we employed a wrap-
per feature selection approach (Yang et al., 2013)
evaluating different feature subsets with a predictive
model. The advantages of using such approach has
been stated in (Yang et al., 2013). We exhaustively
inspected all possible combinations, skipping combi-
nations of 2 and 3 features only. Since there are few
features, the combinatorial explosion is not too high
and this can be done in few hours. In this case, the
ground truth is the accuracy obtained with the base
classifier for the test images. We will consider a good
Table 2: Results of the best measure combinations. First
column shows the features employed in each combination,
according to the numbering presented in Table 1. Second
column shows the accuracy of selecting the one level with
highest accuracy of the BC. Third column shows the accu-
racy of selecting a level among the best three with highest
accuracy of the BC.
Feature combination 1 level (%) 3 levels (%)
1, 2, 6, 7, 9, 10, 14 23.78 68.53
1, 6, 7, 8, 14, 15, 16 22.38 68.53
1, 6, 7, 9, 11, 14, 15 20.28 68.53
1, 6, 7, 8, 15, 16 20.28 67.83
1, 4, 6, 9, 10, 12, 16 18.18 65.73
level selection if the evaluation measure chooses as
best level one among the best three with highest ac-
curacy by the BC. If the selected level is not one of
the three with highest accuracy, the selection will be
considered wrong. Since there were several combina-
tions that achieved the same level selection accuracy,
we also measured the accuracy of selecting the one
level that has the best BC accuracy. This can be seen
in Table 2. The last row of the table is the best com-
bination without taking into account features 7 and
8 from Table 1, since these probabilities may not be
available in many approaches. These results were ob-
tained with Random Forest as SEC.
It is important to notice that in the first 4 rows of
Table 2, features 1, 6 and 7 are always present, which
might indicate that their contribution to the combina-
tion is very important. Features 6 and 7 are two of the
semantic features proposed in Section 4.2. Also, the
difference among the results of the first 4 rows and the
5th row (not using the probabilities of the classifier),
also points to the importance of using these semantic
features in segmentation evaluation.
Once we had the best feature combination for the
SEC, we proceeded to evaluate the performance of
each evaluation measure in selecting the best segmen-
tation level for each image. The results of this ex-
periment can be seen in Table 3 and the accuracies
shown in second column are from selecting as best
level one among the three with highest accuracy of
the BC. The measures selected for the experiments
were H
r
and H
mr
(Khan and Bhuiyan, 2014), Zeb, Q,
E, F, reviewed in (Zhang et al., 2008), B, which is the
combination of B
G
and B
D
as presented in (Morales-
Gonz´alez and Garc´ıa-Reyes, 2013) and the SEC com-
bination proposed in this work.
According to these results, it can be seen that Q
and Zeb, which were the measures with better results
in Experiment 2 of (Zhang et al., 2008), were not the
best for this task. In (Zhang et al., 2008) the ground
truth was obtained by human evaluators while in the
present task the ground truth was obtained according
UnsupervisedSegmentationEvaluationforImageAnnotation
153

Table 3: Results of the level selection accuracy of each mea-
sure.
Evaluation measure Level selection accuracy (%)
H
r
43.36
H
mr
13.29
Zeb 39.16
Q 39.16
E 44.06
F 44.76
B 50.35
SEC 68.53
to an automatic annotation algorithm output. There-
fore, using human-generated ground truth may not be
the right assessment to what a computational algo-
rithm needs. It is important to notice the huge im-
provement displayed by the SEC combination, which
outperformed the best result in 18 % of accuracy. This
is an indicator of the benefits provided by the combi-
nation and the use of semantic features.
Additional information regarding these measures
can be seen in Table 4. Second column shows the
average time to evaluate all the segmentation levels
of one image (currently 11 levels, from level 6 to
16 of each pyramid). Another interesting informa-
tion is how deviated to under or over-segmentation
each measure is, with respect to the ground-truth cor-
rect levels. We computed the difference between the
best levels selected by each measure and the ground-
truth levels, and computed the mean and standard de-
viation of this difference. These values are shown
in columns 3 and 4 respectively. A negative mean
value indicates that the corresponding measure tends
to over-segmentation w.r.t the ground-truth correct
levels. Conversely, a positive value indicates that the
measure tends to select under-segmented levels. Val-
ues closer to zero correspond to measures with out-
puts closer to the ground-truth. In this sense, it can
be seen that most measures, except for H
mr
, tend to
choose levels more over-segmented (at different de-
grees) than the ground-truth. H
mr
has a strong bias to
under-segmentation while H
r
and F have the stronger
biases to over-segmentation. The SEC combination
displays the mean value closest to zero with a slight
bias to over-segmentation,and the lowest standard de-
viation among all the measures.
Regarding the computational cost of computing
each individual measure, it can be seen in Table 4 that
Zeb is the more time-consuming measure, followed
by B and H
mr
. The time shown for the SEC com-
bination corresponds to the second combination pre-
sented in Table 2. The reason for this is that the first
combination employs the Zeb measure, which greatly
increases the computation time (10.58 seconds). It
Table 4: Additional information of each measure.
Evaluation measure Time (s) Mean Stdev
H
r
0.702 -2.34 3.38
H
mr
2.271 4.85 2.74
Zeb 6.296 -0.69 4.73
Q 0.214 -1.73 4.12
E 0.206 -0.89 3.44
F 0.215 -2.55 2.84
B 3.952 -1.86 2.72
SEC 4.505 -0.67 2.43
Table 5: Accuracy of the annotation process when choosing
as starting levels the ones selected by each measure.
Evaluation measure. Annotation accuracy (%)
Base Classifier 73.0
Fixed Level 75.2
H
r
72.34
H
mr
63.78
Zeb 71.41
Q 69.75
E 71.63
F 71.91
B 74.72
SEC 76.86
is important to notice that the SEC combination em-
ploys other measures that also contribute to the total
time. Nevertheless, since many of these individual
measures work with common information, they can
be computed together, reducing the total time with re-
spect to the sum of their individual times. Also, the
cost and the accuracy information can be used to find
an appropriate trade-off between these two aspects in
specific applications.
Using as starting levels the ones selected by each
measure, we ran the whole annotation algorithm and
the final annotation accuracy in each case can be seen
in Table 5. Also, the first two rows show the annota-
tion accuracy of the base classifier and the annotation
accuracy of the hierarchical annotation process using
a fixed level (level 10 in this case) for starting the an-
notation process.
In this experiment can be seen that, in most cases,
selecting the starting levels with the segmentation
evaluation measures deteriorates the final annotation
accuracy with respect to the base classifier accuracy
and using a fixed level. The only measures that im-
proved the BC results were B and the SEC combina-
tion, while the fixed level approach was only outper-
formed by the SEC combination. here is a significant
improvement of the SEC combination over the second
best evaluation measure (B), of 2.14 %.
VISAPP2015-InternationalConferenceonComputerVisionTheoryandApplications
154

6 CONCLUSIONS
In this paper we addressed two usually unrelated re-
search fields: unsupervised segmentation evaluation
and automatic image annotation. Our proposal of in-
cluding semantic measures in the segmentation evalu-
ation process and the combination of several individ-
ual evaluators displayed better results than the most
relevant measures found in the literature. We also
showed that the measures that evaluate a segmenta-
tion more similar to humans, are not the best for se-
lecting partition levels to perform automatic recogni-
tion tasks. Therefore, in our opinion, more efforts
should be devoted to develop segmentation evaluation
measures that work better for automatic image anno-
tation, instead of focusing on the best segmentation
output for humans.
The final results of the annotation process showed
that selecting ”good” levels at the beginning provides
better annotation accuracy. As future work, we plan
to include saliency maps in the segmentation evalu-
ation process, trying to find partitions that preserve
distinctive objects or parts.
ACKNOWLEDGEMENTS
This work was supported in part by CONACYT
project 215546.
REFERENCES
Arbelaez, P., Hariharan, B., Gu, C., Gupta, S., Bourdev,
L. D., and Malik, J. (2012). Semantic segmentation
using regions and parts. In CVPR, pages 3378–3385.
IEEE.
Csurka, G., Larlus, D., and Perronnin, F. (2013). What is a
good evaluation measure for semantic segmentation?
In 24th British Machine Vision Conference (BMVC),
University of Bristol, United Kingdom.
Dogra, D. P., Majumdar, A. K., and Sural, S. (2012). Eval-
uation of segmentation techniques using region area
and boundary matching information. J. Vis. Comun.
Image Represent., 23(1):150–160.
Gould, S., Fulton, R., and Koller, D. (2009). Decomposing
a scene into geometric and semantically consistent re-
gions. In ICCV, pages 1–8. IEEE.
Haxhimusa, Y. and Kropatsch, W. G. (2004). Segmenta-
tion graph hierarchies. In Proceedings of Joint In-
ternational Workshops on Structural, Syntactic, and
Statistical Pattern Recognition S+SSPR 2004, volume
LNCS 3138, pages 343–351. Springer, Berlin Heidel-
berg, New York.
Huang, Q., Han, M., Wu, B., and Ioffe, S. (2011). A hierar-
chical conditional random field model for labeling and
segmenting images of street scenes. 2013 IEEE Con-
ference on Computer Vision and Pattern Recognition,
0:1953–1960.
Khan, J. F. and Bhuiyan, S. M. (2014). Weighted entropy
for segmentation evaluation. Optics and Laser Tech-
nology, 57(0):236 – 242. Optical Image Processing.
Morales-Gonz´alez, A. and Garc´ıa-Reyes, E. B. (2013).
Simple object recognition based on spatial relations
and visual features represented using irregular pyra-
mids. Multimedia Tools Appl., 63(3):875–897.
Morales-Gonz´alez, A., Reyes, E. B. G., and Sucar, L. E.
(2013). Improving image segmentation for boosting
image annotation with irregular pyramids. In CIARP
(1), volume 8258 of LNCS, pages 399–406. Springer.
Olson, C. R. (2001). Object-based vision and attention in
primates. Current Opinion in Neurob., 11:171–179.
Russakovsky, O., Deng, J., Krause, J., Berg, A., and Li, F.
(2014). Results of ILSVRC2013. http://www.image-
net.org/challenges/LSVRC/2013/results.php.
Russell, C., Ladicky, L., Kohli, P., and Torr, P. H. S. (2014).
Associative hierarchical random fields. IEEE Trans-
actions on Pattern Analysis and Machine Intelligence,
36(6):1–1.
Song, Y.-Z., Arbelaez, P., Hall, P. M., Li, C., and Balikai,
A. (2010). Finding semantic structures in image hi-
erarchies using laplacian graph energy. In ECCV (4),
volume 6314 of LNCS, pages 694–707. Springer.
van de Sande, K. E. A., Uijlings, J. R. R., Gevers, T., and
Smeulders, A. W. M. (2011). Segmentation as selec-
tive search for object recognition. In Proceedings of
ICCV ’11, pages 1879–1886. IEEE Computer Society.
Yang, P., Liu, W., Zhou, B. B., Chawla, S., and Zomaya,
A. Y. (2013). Ensemble-based wrapper methods for
feature selection and class imbalance learning. In
PAKDD (1), volume 7818 of LNCS, pages 544–555.
Springer.
Zankl, G., Haxhimusa, Y., and Ion, A. (2012). Interac-
tive labeling of image segmentation hierarchies. In
DAGM/OAGM Symposium, volume 7476 of LNCS,
pages 11–20. Springer.
Zhang, H., Fritts, J. E., and Goldman, S. A. (2008). Image
segmentation evaluation: A survey of unsupervised
methods. Comput. Vis. Image Underst., 110(2):260–
280.
Zhang, S. and Xie, M. (2013). Beyond sliding windows:
Object detection based on hierarchical segmentation
model. In International Conference on Communica-
tions, Circuits and Systems (ICCCAS), pages 263 –
266. IEEE.
UnsupervisedSegmentationEvaluationforImageAnnotation
155
