
Interactive Rendering and Stylization of Transportation Networks
using Distance Fields
Matthias Trapp, Amir Semmo and J
¨
urgen D
¨
ollner
Hasso Plattner Institute, University of Potsdam, Prof.-Dr.-Helmert-Str. 2-3, 14482 Potsdam, Germany
Keywords:
Transportation Networks, 3D Visualization, Image-based Rendering, Distance Fields, Shading, Map Design.
Abstract:
Transportation networks, such as streets, railroads or metro systems, constitute primary elements in cartog-
raphy for reckoning and navigation. In recent years, they have become an increasingly important part of 3D
virtual environments for the interactive analysis and communication of complex hierarchical information, for
example in routing, logistics optimization, and disaster management. A variety of rendering techniques have
been proposed that deal with integrating transportation networks within these environments, but have so far
neglected the many challenges of an interactive design process to adapt their spatial and thematic granularity
(i.e., level-of-detail and level-of-abstraction) according to a user’s context. This paper presents an efficient
real-time rendering technique for the view-dependent rendering of geometrically complex transportation net-
works within 3D virtual environments. Our technique is based on distance fields using deferred texturing
that shifts the design process to the shading stage for real-time stylization. We demonstrate and discuss our
approach by means of street networks using cartographic design principles for context-aware stylization, in-
cluding view-dependent scaling for clutter reduction, contour-lining to provide figure-ground, handling of
street crossings via shading-based blending, and task-dependent colorization. Finally, we present potential
usage scenarios and applications together with a performance evaluation of our implementation.
1 INTRODUCTION
The efficient rendering and visualization of trans-
portation networks within interactive virtual 3D en-
vironments is an important feature for a number of
today’s applications, such as Google Maps and Earth
or Bing Maps. The presented work enables an ef-
ficient way of rendering complex transportation net-
works with a flexible parametrization and stylization.
Motivation. Transportation networks represent im-
portant features in 3D geovirtual environments, such
as virtual city and landscape models. This class of in-
frastructure networks comprise, e.g., street networks,
rail road networks, and cycling tracks. Their high-
quality visualization is crucial for a number of ap-
plications within these environments, such as navi-
gation systems and digital maps to support orienta-
tion and wayfinding in the real world. In addition
to high visual contrasts (Vaaraniemi et al., 2011), the
visualization quality comprises a number of further
aspects such as anti-aliasing, and coherence in the
continuation of line segments. To achieve this for
the stated applications, dynamic scaling (Kersting and
D
¨
ollner, 2002) or zoom-dependent rendering of mas-
sive transportation networks using abstract or carto-
graphic styles is required. One can basically distin-
guish between three major approaches how current
systems and applications perform their rendering:
Geometry-based. This approach relies on explicitly
pre-computed textured geometry for network seg-
ments and junctions, based on the network topol-
ogy. Depending on the level-of-details required,
this exhibits memory consumptions of the result-
ing geometries and textures.
Texture-based. This approach rasterizes the map-
ping results of geometry-based approaches into
a single or multiple textures required for textur-
ing the underlying terrain model (Kersting and
D
¨
ollner, 2002). Using this approach, however,
the rendering quality can suffer due to sampling
and aliasing artifacts caused by insufficient tex-
ture resolution.
Stencil-based. This approach uses the concept of
shadow volumes for rendering transportation net-
works on top of digital terrain models (Vaaraniemi
et al., 2011). It extrudes the network geometry
207
Trapp M., Semmo A. and Döllner J..
Interactive Rendering and Stylization of Transportation Networks using Distance Fields.
DOI: 10.5220/0005310502070219
In Proceedings of the 10th International Conference on Computer Graphics Theory and Applications (GRAPP-2015), pages 207-219
ISBN: 978-989-758-087-1
Copyright
c
2015 SCITEPRESS (Science and Technology Publications, Lda.)
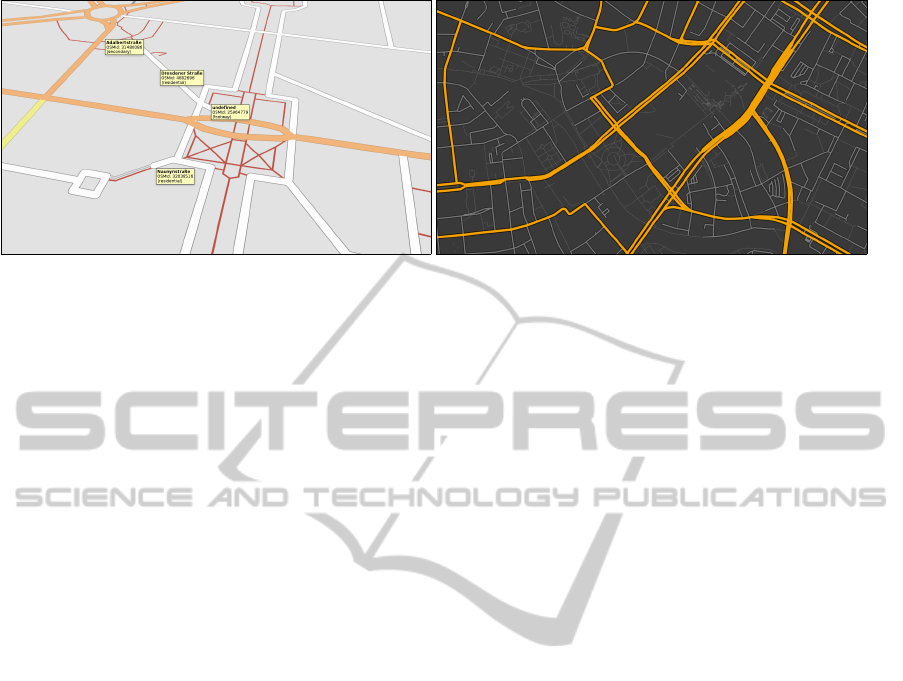
(a) Perspective projection at a high zoom level. (b) High contrast orthographic projection.
Figure 1: Rendering of an OpenStreetMap data set using different map stylizations.
and applies a stencil shadow volume algorithm.
The shadow volume must be recomputed if the
network configuration changes, e.g., due to inter-
active filtering.
These classes of existing approaches for rendering
and visualization of transportation networks often as-
sume a static input geometry, mapped to textured ge-
ometry for rendering, or additionally require the com-
putation of intermediate geometry (shadow volumes).
However, there are visualization approaches that re-
quire the handling of dynamic networks as the result
of filtering or modification during the visualization
process (Haunert and Sering, 2011). Further, an in-
creasing geometric complexity of transportation net-
works due to more detailed representations also in-
creases the memory footprint of each of these tech-
niques accordingly. Furthermore, the change in net-
work colorization or similar tasks requires an update
of the intermediate rendering representations, which
can become a time consuming process, depending on
the complexity of a transportation network.
Problem Statement. The above characteristics of
existing techniques limits their application with re-
spect to view-dependent rendering of massive, possi-
bly dynamic transportation networks that supports in-
teractive filtering and colorization by simultaneously
retaining a low memory footprint. Based on these
functionalities, the design of an interactive rendering
technique is faced with the following challenges and
requirements:
R1. Pre-processing of discrete level-of-details con-
sume additional memory and often yield incoher-
ent rendering when switching between these lev-
els during zooming or within perspective projec-
tion. Therefore, levels of detail should be com-
puted on-the-fly during the rendering and based
on current viewing settings.
R2:. Increasingly detailed transportation networks
require high amounts of main and/or video mem-
ory. Therefore, the network representation should
exhibit a minimal memory footprint and facilitate
fast updates.
R3. View-dependent cartographic stylization of
transportation networks are key features for a
number of applications. Therefore, the rendering
technique should provide a sufficient parametriza-
tion, i.e., covering level-of-detail rendering, as
well as interactive filtering and highlighting.
Contributions. With respect to the challenges
stated above, this paper presents a new real-time
rendering technique for the cartographic rendering
and visualization of complex transportation networks.
It is based on a single-pass computation of dis-
tance fields for an effective geometric representation
(Frisken et al., 2000) combined with parameterized
stylizations performed in screen space. The presented
approach relies on a compact memory representation
of transportation networks to provide a minimal mem-
ory footprint compared to existing techniques. Based
on this representation, route geometry is efficiently
generated on-the-fly during rendering, enabling inter-
active modifications of the depicted contents. Further,
the technique does not rely on adjacency information.
The presented stylization model effectively de-
couples geometry from appearance parameters such
as width, color, or texture. It facilitates interactive
level-of-detail (LoD) as well as level-of-abstraction
(LoA) rendering (Semmo et al., 2012). It further
supports localization of route networks (e.g., color
schemes, line styles), and interactive view-dependent
filtering based on virtual lens metaphors (Tominski
et al., 2014). To summarize, this paper makes the fol-
lowing contributions to the challenges stated above:
1. It presents a concept for high-quality cartographic
GRAPP2015-InternationalConferenceonComputerGraphicsTheoryandApplications
208

rendering, which is exemplified for complex street
networks.
2. It provides an interactive hardware-accelerated
rendering technique that facilitates a minimal
memory footprint for network representation.
3. It introduces interactive stylization and coloriza-
tion mechanisms using deferred texturing and dis-
tance transforms.
The presented approach has a number of applications
beyond the rendering and visualization of street net-
works. For instance, it can be applied to the rendering
and stylization of planar graphs as well as visualiza-
tion of aircraft trajectories.
The remainder of this paper is structured as fol-
lows. Section 2 reviews related work concerning
the visualization and rendering of transportation net-
works, in particular considering street networks. Sec-
tion 3 discusses design principles of transportation
network depictions from the viewpoint of cartogra-
phy. Section 4 introduces the concept for rendering
image-based rendering of transportation networks us-
ing distance fields and deferred texturing. Section 5
gives details regarding a fully hardware-accelerated
implementation of this concept. Further, Section 6
demonstrates the rendering technique using different
application examples and discusses limitations and
ideas for future work. Finally, Section 7 concludes
this paper.
2 RELATED WORK
Transportation networks are well-researched in 2D
map design (MacEachren, 1995; Kraak and Ormel-
ing, 2003; Tyner, 2010), but only few works deal
with their representation in interactive 3D virtual en-
vironments. In the following, we give an overview
on related works that deal with the modeling and ren-
dering of transportation networks including position-
ing in 3D space and visualization techniques that deal
with the challenges of visual clutter and occlusion.
2.1 Modeling and Rendering of
Transportation Networks
Generalization is a key concept for modeling and
transforming transportation networks into human-
readable maps (MacEachren, 1995; Jiang and Clara-
munt, 2004), comprising operators such as sim-
plification, displacement, and deformation (Foerster
et al., 2007), while preserving spatial relationships
and topology (Tversky and Lee, 1999; Agrawala and
Stolte, 2001). Generalization techniques have been
effectively used for the design of destination maps
(Kopf et al., 2010) and sketch maps to draw contour
lines excessively wavy or fuzzy and express uncer-
tainty (Tversky and Lee, 1999; Skubic et al., 2004).
Most generalized models base on connectivity graphs
where vertices represent segments of named street
and links represent street intersections (Jiang and
Claramunt, 2004). These models are typically pro-
vided via commercial products (e.g., Navteq), gen-
erated procedurally (Galin et al., 2010; Bene
ˇ
s et al.,
2014), or authored in hierarchies (Galin et al., 2011).
In our work, we use OpenStreetMap as a collaborative
platform with free access to geospatial data (Haklay
and Weber, 2008).
A common challenge in rendering transportation
networks in 3D virtual environments is the projec-
tion onto digital terrain models. First approaches
use geometry-based methods to directly combine vec-
tor data with a 3D terrain mesh (Polis et al., 1995;
Weber and Benner, 2001), but only provide pre-
computations without the capability for dynamic styl-
ization. A first approach for level-of-detail render-
ing uses texture-based mapping to project vector fea-
tures on 3D terrain models (Kersting and D
¨
ollner,
2002). Similar approaches use principles of shadow
mapping for perspective parameterizations by tak-
ing the current point of view into account (Schnei-
der et al., 2005), continuous level-of-detail methods
(Wartell et al., 2003), and shading for dynamic fea-
ture editing (Bruneton and Neyret, 2008). However,
the approaches are less suited for 3D presentations
of transportation networks in close view distances
because of the limitation in detail and sharpness.
Further, they require explicit level-of-detail mecha-
nisms which results in additional computational costs.
Other methods utilize the hardware-accelerated sten-
cil buffer with a type of shadow volume (Schneider
and Klein, 2007; Vaaraniemi et al., 2011), or com-
pletely rely on screen-space rendering (Ohlarik and
Cozzi, 2011) to reduce computational costs. How-
ever, the later approach is limited with respect to the
generation of view-dependent level-of-abstraction vi-
sualization (Semmo et al., 2012).
Our work presents a compromise between texture-
based and geometric approaches using distance fields
to effectively reconstruct geometric properties of
complex shapes during shading (Frisken et al., 2000).
We employ distance maps to stylize transportation
networks in real-time utilizing bilinear sampling for
a piecewise-linear approximation of feature contours.
In particular, this approach has been proven effective
for the magnification of glyph contours, even with
low-resolution distance maps (Green, 2007). Pre-
vious algorithms use vector propagation to compute
InteractiveRenderingandStylizationofTransportationNetworksusingDistanceFields
209
these maps by an approximate Euclidean distance
transform (Danielsson, 1980), e.g., jump-flooding
(Rong and Tan, 2006), or provide work-load efficient
methods to compute an exact distance transform on
the GPU (Cao et al., 2010).
Previous work demonstrates the effective use of dis-
tance fields for real-time rendering of water surfaces,
where respective distance and orientation informa-
tion is computed to guide the stylization and annota-
tion (Semmo et al., 2013). Our approach works simi-
lar, but exhibits a more straight forward approach for
generating the distance maps because of lines being
a more simpler geometric representation than poly-
gons. In particular, we demonstrate the effective us-
age of distance maps for stylization, such as render-
ing of contour lines, the view-dependent scaling, and
handling of street crossings (Vaaraniemi et al., 2011).
2.2 Visualization Techniques For
Transportation Networks
According to a user’s background, task, and per-
spective view, often too much irrelevant (cluttered)
or too few information is visualized (Shneider-
man, 1996), and thus not a meaningful map de-
sign is provided when rendering transportation net-
works (MacEachren, 1995). To address this con-
cern, major related work is found in focus+context
and zooming-based visualization techniques.
Focus+context describes the concept to visually
distinguish between important or relevant informa-
tion from closely related information (Furnas, 1986).
Many interface schemes exist to allow users to attain
both focused and contextual views of their informa-
tion spaces, i.e., detail+overview, zooming, and cue
techniques (Cockburn et al., 2009). Focus+context
route zooming uses principles of scaling to mag-
nify regions of interest and for disocclusion manage-
ment (Qu et al., 2009). Other techniques employ
global deformations and degressive projections in
panoramic maps for disocclusion of routes (Takahashi
et al., 2006; Falk et al., 2007; Degener and Klein,
2009), or scale surrounding 3D objects (e.g., build-
ings) using view-dependent optimization techniques
(Hirono et al., 2013). Further techniques employ in-
teractive lenses as established means to facilitate the
exploration of transportation networks, e.g., for mag-
nification (Karnick et al., 2010; Haunert and Sering,
2011), which are quite versatile in their parametriza-
tion for clutter reduction (Tominski et al., 2014).
Another typical approach to deal with the prob-
lem of overcluttered displays is contextual zooming,
where hierarchical route maps of varying resolution
may be used for effective navigation (Wang et al.,
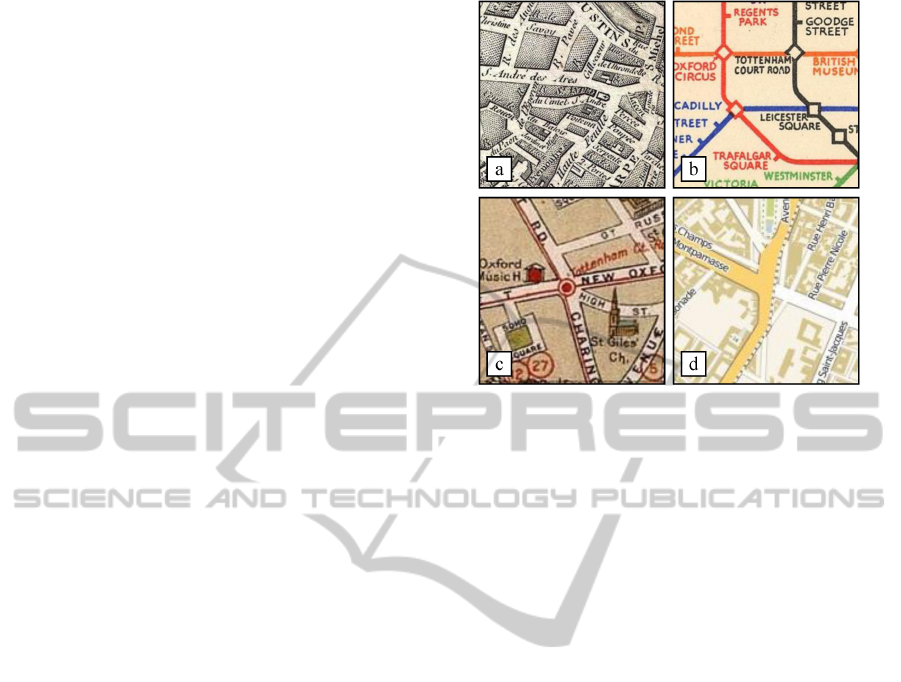
Figure 2: Exemplary maps depicting transportation net-
works: a) Paris in 1787 designed by Louis Brion de la Tour,
b) the famous Pocket Underground map from 1933 by Harry
Beck, c) London in 1913, d) contemporary map of Paris.
2014). A first approach for dealing with the prob-
lem of visual clutter in 3D perspective views has
been presented in (Vaaraniemi et al., 2011) via view-
dependent scaling of stylization features. The con-
cept presented in our work supports the required
parametrization for these visualization techniques.
3 DESIGN PRINCIPLES FROM
CARTOGRAPHY
Well-designed illustrations of transportation net-
works accentuate the figure-ground relation-
ship, and communicate hierarchical and meta-
information (e.g., street names). To this end, we
studied textbooks on map design and thematic
cartography (Imhof, 1975; MacEachren, 1995; Kraak
and Ormeling, 2003; Tyner, 2010), and examined the
works by famous cartographers and map designers
(e.g., Harry Beck, Figure 2b). From our empirical
analysis, we extracted three groups of design aspects
according to the 2D semiotic model (Bertin, 1981):
graphical elements (e.g., lines, points) and their
position, and graphical variables (e.g., color, line
thickness, decoration elements such as labels).
Graphical Elements. In general, two approaches
for the depiction of transportation networks exist:
(1) non-explicit elements by the principle of sur-
roundedness (MacEachren, 1995) for effective figure-
ground destinction on maps, for instance where
GRAPP2015-InternationalConferenceonComputerGraphicsTheoryandApplications
210
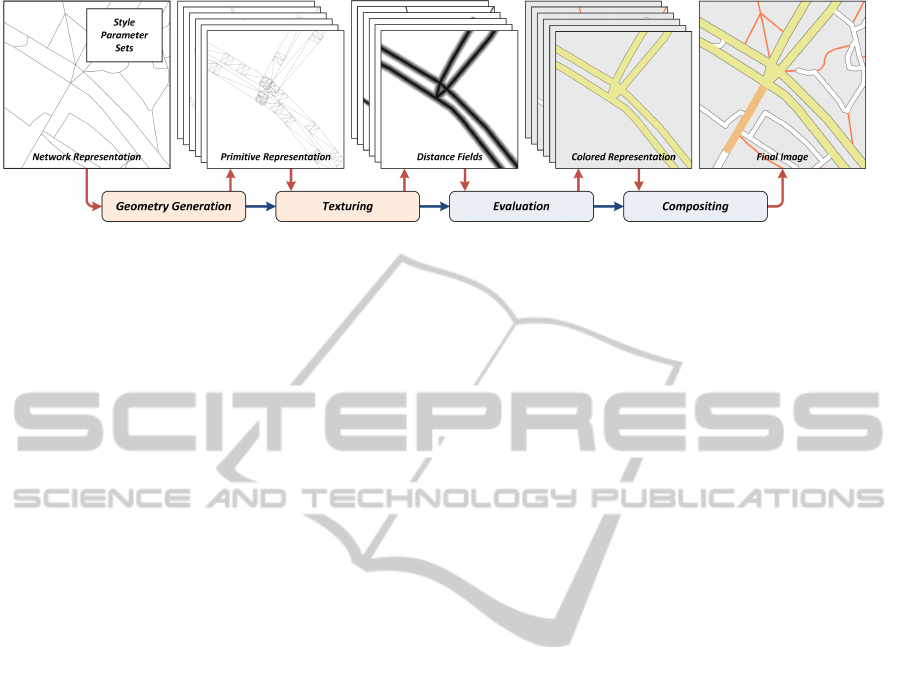
Figure 3: Schematic overview of the rendering pipeline for transportation networks. Given a compact network representa-
tion and stylization parameters, textured geometry and distance fields are synthesized per network category within a single
rendering pass. The results are then used for stylization and image composition in a post-processing pass.
streets are formed as a unit via enclosing fea-
tures (Figure 2a), and (2) the explicit graphical de-
piction via connected lines and points (nodes) (Fig-
ure 2b-d) on which we focus in this work. In mod-
ern maps, (P1) contour lines often surround fine-
textured fills or solid colors to add visual contrast and
improve the figure-ground perception (MacEachren,
1995). Hierarchical representations of street networks
often have (P2) primary streets overlap secondary or
tertiary streets. In sketch maps, these lines or con-
tours are often drawn excessively wavy or fuzzy to
express uncertainty. Following a level-of-abstraction
concept, (P3) dynamic filtering and scaling of these
geometric features improves the perception of roads
at high view distances and avoids overcluttering. The
choice of shape often varies in thematic cartogra-
phy, ranging from solid lines to dotted representations
(e.g., to discern between car driving and biking di-
rections). Finally, labels are primary design elements
to enrich networks with meta-information. By con-
vention, (P4) names follow principal line directions
and are placed within streets, or outside line segments
and oriented with links, e.g., the latter in schematized
maps (Figure 2b), to ensure legibility (Imhof, 1975).
Graphical Variables. In many maps, (P5) a hierar-
chy of emphasis is drawn among reference elements,
such as different line weights and colors to portray
different grades of roads (Figure 2b/d). In modern
maps, (P6) streets are tinted using qualitative color
schemes to represent street classes and distinguish
them from the underlying terrain. This association
may enable cognitive grouping of each network type
(Kraak and Ormeling, 2003). To date, standardized
color schemes for transportation networks have not
been established but vary from country to country.
But it can be observed that (P7) yellow established
as a conventional color tone for main streets, with a
discrete gradation towards grey and white shading for
tertiary roads (Figure 2d). Lately, principles for color
blindness have also been examined by the example
of OpenStreetMap (Kr
¨
oger et al., 2013). All these
graphical variables may additionally change accord-
ing to the zoom level to avoid overcluttered displays.
In the following, we consider these principles for an
interactive design process in 3D virtual environments.
4 CONCEPTUAL OVERVIEW
This section presents an overview of the concepts for
our rendering and stylization approaches. Figure 3
shows a schematic overview of our proposed render-
ing pipeline comprising control and data flow. It basi-
cally consists of the following three stages:
Preprocessing. This stage loads and transforms a
given transportation network with its associated
meta data into a compact representation (at-
tributed point cloud) for efficient rendering and a
low memory footprint. This operation is required
to be performed only once per data set (Sec. 4.1).
Distance Transform. Starting from the pre-
processed input, this stage synthesizes textured
polygons of respective widths that are subse-
quently rasterized into distinct distance-field
buffers for each network category (Sec. 4.2).
Stylization and Compositing. In this stage, de-
ferred texturing based on the generated distance
fields is performed in screen space using a sin-
gle post processing pass (Sec. 4.3). It enables
application-wise procedural and raster-based tex-
turing for colorization with level-of-detail sup-
port. The resulting colors of each network cate-
gory are subsequently composited in a bottom-up
approach with respect to their ranking.
The remainder of this section describes the data rep-
resentation and assumptions, followed by a more de-
tailed description of these stages. The data represen-
tation is exemplified for street networks.
InteractiveRenderingandStylizationofTransportationNetworksusingDistanceFields
211
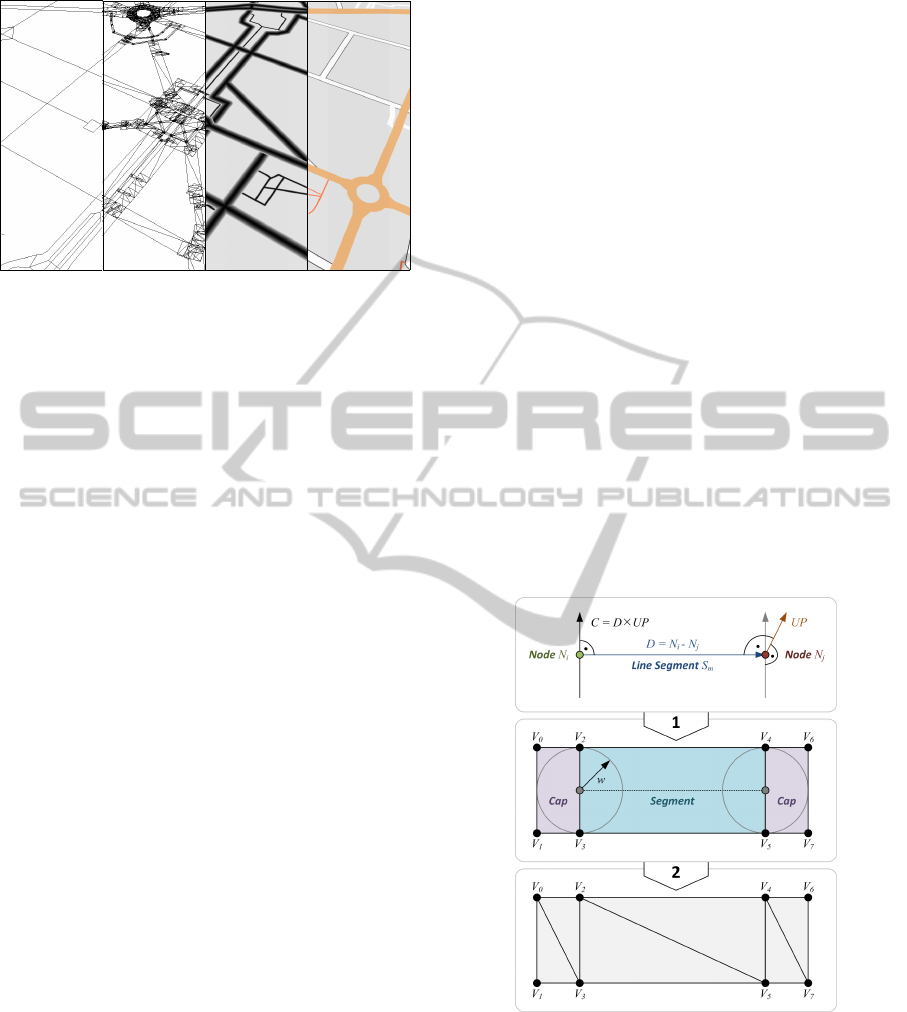
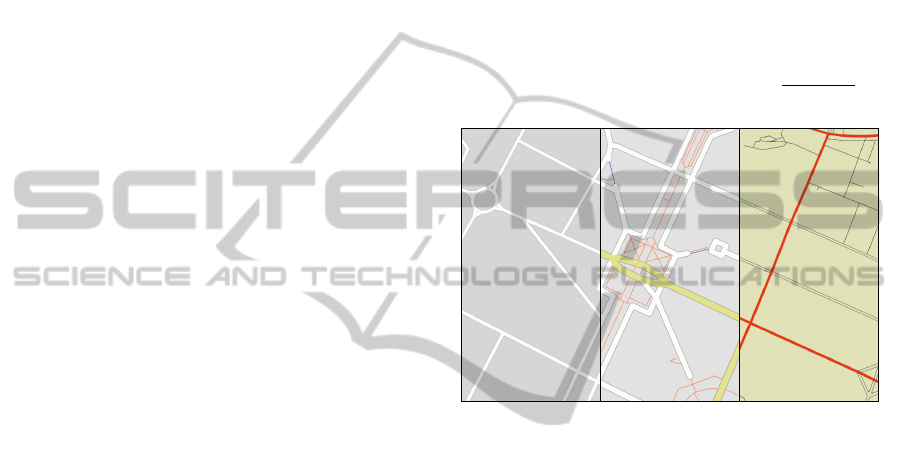
(a) Lines. (b) Polygons. (c) Distances. (d) Styled.
Figure 4: Overview of the processing stages, starting with
input data (a) over generated polygons (b) to distance fields
(c) and stylized network segments (d).
4.1 Representation of Networks
One advantage of our approach is that the geometry
of transportation networks can be generated on-the-
fly (R1). This way, the video memory footprint of the
transportation network can be minimized (R2) while
only geometry within the current view-frustum is gen-
erated. We use OpenStreetMap (OSM) data as input
(Haklay and Weber, 2008). OSM provides free access
to a variety of data types for route map synthesis. This
includes not only road data and 2D terrain informa-
tion, but also 2D building footprints, water surfaces,
and specific landmark information.
According to the design principles of Section 3, car-
tographic route depictions can be synthesized by a
hardware-accelerated rasterization of line segments
(represented by rectangular geometry). Using mod-
ern GPU capabilities (geometry shaders), the geome-
try synthesis and tessellation can be completely per-
formed on graphics hardware, which however re-
quires the geometry of input lines and additional route
data to be represented as per-vertex attributes. To
this end, the attributed topological representation of
a street network is prepared for GPU-based represen-
tation (Sec. 5.1) during a pre-processing stage. The
attributed graph is encoded by a node buffer and a seg-
ment buffer, both suitable for hardware-accelerated
rendering. Therefore, the nodes basically comprises
their position and grade, i.e., the number of segments
adjacent to the respective node, while the segments
comprise indices to the nodes and the rank of a route
segment. In addition to the ranks supported by OSM,
we introduce a specific rank for highlighted routes
that overrides all OSM ranks. Further, the segments’
lengths in world space units are encoded for optional
length-parametrizations.
4.2 Distance Field Computation
Figure 4 shows the process of computing distance
fields for a given network configuration. It basi-
cally comprises two stages that can be efficiently per-
formed on graphics hardware. Thereby, two basic as-
pects can be distinguished: (1) the primitive conver-
sion between point and polygons and (2) the texturing
of the synthesized polygons.
Geometry Synthesis. The step for geometry syn-
thesis converts point primitives – issued for render-
ing – to triangle strips, similar to (Trapp et al., 2013).
This can be efficiently implemented using geometry
shaders to minimize the memory footprint for rep-
resenting a street network. It also enables batching
(Wloka, 2005) to reduce the number of draw calls.
Based on this compact network representation, poly-
gons are created for each line segment’s (Fig. 4(a))
respective cap and segment (Fig. 4(b)). Figure 5
illustrates this process in more detail. Further, ver-
tex texture coordinates are computed for each poly-
gon and yields distance drop-offs during rasterization
(Fig. 4(c)). The resulting polygons can be efficiently
encoded using triangle strips.
Figure 5: Schematic overview of the geometry synthesis.
During geometry synthesis, only segments within the
current view-frustum are considered for processing,
i.e., to reduce the amount of geometry information
submitted to the clipping and rasterization stages of
the hardware-accelerated rendering pipeline. The ma-
jor advantage of this concept is the respective compu-
tation of distance fields per street category. This en-
ables a flexible stylization and image compositing at
GRAPP2015-InternationalConferenceonComputerGraphicsTheoryandApplications
212
the rendering stage.
Distance Texturing. Once the geometry synthesis
has been performed, the respective texture coordi-
nates are interpolated during rasterization. The re-
quired distances are computed using regular bilinear
sampling using fragment shaders. The required dis-
tance textures are effectively represented using a sin-
gle 2D texture array, whose layers can be indexed ac-
cording to the type of geometry (cap or segment) and
the grade of the node. The individual 2D texture layer
encode the distance drop-off. Different distance tex-
tures can be used for caps of different grades, i.e., at
junctions or endings. Using textures for the distance
representation enables flexibility in design and allows
a simplified implementation.
Blending. One major challenge in street rendering
is to provide seamless transitions between adjacent
and consecutive segments. In (Vaaraniemi et al.,
2011) three different techniques are described for
geometry-based approaches to avoid gaps. Our ap-
proach bypasses this geometric computation prob-
lem by combining segments using minimum blending
(Bavoil and Myers, 2008): given two distance values
d
src
and d
dst
of fragments belonging to different seg-
ments, the resulting value that is written to the render
buffer is computed by d
res
= min(d
src
, d
dst
).
4.3 Stylization of Street Networks
Given the generated distance fields, the stylization is
performed in a single post-processing stage via de-
ferred texturing using individual style parameters de-
fined per network category.
Style Parametrization. Our approach enables the
stylization of segments based on their category. A
style parameter set S = (w, d
M
, d
B
,C
M
,C
B
) ∈ S basi-
cally comprises the following parameters: the width
w ∈ R
+
of a geometric segment in world space coor-
dinates; the respective distances d
M
, d
B
∈ [0, 1], with
d
M
+d
B
= 1 for differentiation between main and bor-
der segment color (P1); as well as the color of main
and border segments (C
B
, C
M
∈ [0, 1]
4
). In addition, a
style parameter set may comprise raster-based or pro-
cedural 2D texture maps for example-based rendering
(e.g., sketch maps (Kopf et al., 2010)).
Level-of-Detail Concept. The presented style para-
metrization can be further extended to define level-
of-detail (LoD) variants for each style (R3). This is
especially useful for a number of applications (Sec.
6.1), such as (1) counterbalancing perspective fore-
shortening of segments at high distances from the vir-
tual camera, (2) enable interactive filtering using lens-
based interaction metaphors (Tominski et al., 2014),
as well as (3) the reduction of visual clutter (Jobst and
D
¨
ollner, 2008). Therefore, the definition of a style pa-
rameter set is extended with an additional LoD param-
eter lod ∈ [0, 1] ⊂ R to yield a list of LoD tupels S
lod
=
(lod
0
, S
0
), . . . , (lod
n
, S
m
)) with lod
i
< lod
i+1
and S
i
∈
S . During runtime, a LoD value is computed per ver-
tex and per fragment (Sec. 5.3). Given a value lod, the
neighboring LoD tuple with lod
i
< lod ≤ lod
i+1
are
fetched and the resulting (interpolated) style is used
S
lod
= interpolate(S
i
, S
i+1
, α), with α =
lod−lod
i
lod
i
−lod
i+1
.
(a) (b) (c)
Figure 6: Examples of different street stylizations computed
via a single set of distance fields.
Style Evaluation. The process of converting the
generated distance fields into respective colors using
the previously described style definitions is denoted
as style evaluation. It is performed on a per-fragment
basis using an additional post-processing step.
To outline potential use cases, Figure 6 shows differ-
ent street stylizations computed from a single set of
distance fields: Figure 6(a) uses a constant line width
for a single stylization parameter set and all street cat-
egories, while Figure 6(b) applies different styliza-
tions for each street category. Figure 6(b) depicts the
highlighting of a single street category that contrasts
the remaining scene.
5 INTERACTIVE RENDERING
This section presents a prototypical implementation
of our concept using OpenGL and the OpenGL Shad-
ing Language (GLSL). The real-time image synthe-
sis is separated into two rendering passes: the first
InteractiveRenderingandStylizationofTransportationNetworksusingDistanceFields
213
pass creates the distance fields using off-screen ren-
dering and the second pass applies stylization using
deferred texturing based on these distance fields. We
first cover the required data structures for hardware-
accelerated rendering, before presenting details for
these two passes.
5.1 GPU-based Data Representation
This section discusses the used GPU data structures
that enable efficient data access and updates, and thus
facilitates efficient rendering, while simultaneously
exhibiting a small memory footprint for the network
representation.
Network Representation. For a compact represen-
tation and efficient access to a network topology,
nodes and segments are stored using individual buffer
objects (Figure 7). A node buffer stores the positions
of a network graph’s vertices. An additional segment
buffer encodes two indices to this buffer and the street
category of the respective segment. This representa-
tion can be considered as attributed point cloud, sim-
ilar to the concept described in (Trapp et al., 2013).
During runtime, the node buffer is bound as vertex-
attribute source, while the segment buffer is drawn
using point primitives. Thus, only one draw call is
required to issue the rendering of a transportation net-
work. Using the indices encoded in each point, a
geometry shader fetches the node positions from the
node buffer as well as the stylization parameters for
the segment category, and performs the computation
as described in Section 4.2.
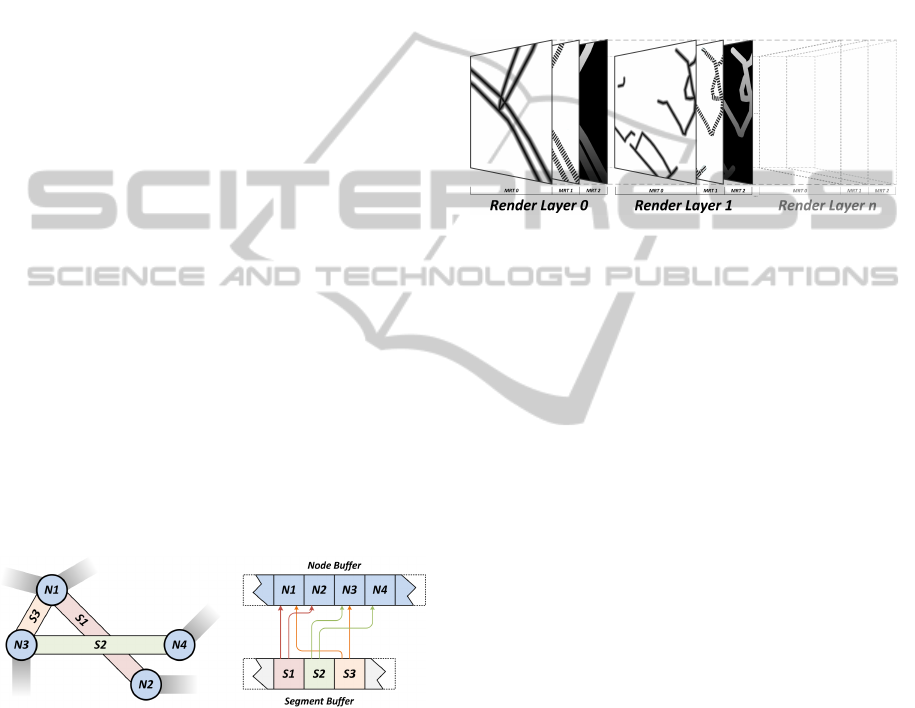
Figure 7: Schematic overview for the combination of node
and segment buffer objects (left) for a compact representa-
tion of street network geometry (right).
Stylization Parameters. The concepts presented in
Section 4.3 enables to reuse stylization parameter
sets. This is considered in our implementation by
encoding distinct sets using uniform buffers, e.g., in-
dexed by a street category and LoD.
Textures and Framebuffer Objects. The distance
textures are represented using single color channels
with 8-bit value precision and a resolution of 512
2
pixels. Further, 2D texture arrays are used for the
storage and access of the generated distance fields.
These texture arrays can be directly used for render-
to-texture. Figure 8 shows an exemplary configura-
tion of a framebuffer object. The individual layers
are aligned in descending order with respect to a seg-
ment’s rank. During the geometry pass, each layer
can be directly addressed for rasterization, and later
used for bilinear sampling. However, this requires the
texture arrays to have the same image resolution, i.e.,
of the viewport, and the same texture precision.
Figure 8: Exemplary render-to-texture configuration for
multiple segment categories. Each render layer comprises
three render targets (width distance field, respective length
distance-field, and linear fragment depth).
5.2 Distance Field Computation
To enable an efficient rendering performance, the
computation of the required distance-field geometry
is performed within a single rendering pass. This
is achieved by using the combination of render-to-
texture (RTT), layered rendering, and multiple ren-
der targets (MRT) with separable blending functions.
The polygonal representation of each segment is com-
puted using a geometry shader with a constant prim-
itive output of six triangles. It also applies view-
frustum and back-face culling prior to rasterization.
Further, the shader maps network categories to their
respective layers stored in the framebuffer objects.
5.3 Stylization and Compositing
The final stylization of a transportation network,
based on the generated distance fields, is performed
using fragment shaders in a subsequent compositing
pass. By rendering a screen-aligned quad, i.e., a
quad that covers the complete viewport, a fragment
shader computes for each render layer at each screen
pixel: (1) the respective LoD level and interpolates
the style parameters, and (2) subsequently performs
deferred texturing to compute the resulting color. Fi-
nally, bottom-up compositing yields the final pixel
color (Porter and Duff, 1984).
GRAPP2015-InternationalConferenceonComputerGraphicsTheoryandApplications
214

Level-of-Detail Computation. Multiple appro-
aches are possible to define how respective level-
of-details are computed within our prototypical
implementation. We basically distinguish between
three different LoD computation variants (see Sec.
6.1 for applications):
Global LoD. The LoD level is set at a global network
scale, i.e., it is equal for all segments in a 3D scene
and can be set using uniform variables. For exam-
ple, this enables explicit coupling of zoom levels
to levels of detail.
Distance-based LoD. The respective LoD level is
computed based on the distance of a fragment or
vertex to the virtual camera. The distance is com-
puted in linear eye-space, therefore it yields linear
interpolation of LoD levels. This approach en-
ables view-dependent LoD rendering and seam-
less transitions between different LoD.
Texture-based LoD. This approach is similar to the
distance-based computation, but the LoD level
is encoded using a texture, i.e., the LoD level
is determined using texture sampling. This en-
ables explicit LoD control by applying lens-based
metaphors in world, camera, and screen-space as
well as explicit definitions of region-of-interest
functions (Semmo et al., 2012).
It is also possible to combine different LoD com-
putations using a hierarchical approach, i.e., using a
global LoD value as a basis that can be refined using
distance-based or texture-based LoD computations,
but which remains subject to future work.
Deferred Texturing. Given a respective style rep-
resentation S at a computed level of detail, deferred
texturing is performed. This limits the required com-
putations to visible fragments only and therefore re-
duces the workload of the per-fragment computations
of the rendering pipeline. Our system provides the
application of procedural or raster-based textures, de-
pending on the application. While simple coloring
can be achieved using 1D procedural texturing ac-
cording to distance fields, an additionally provided
length parametrization (Fig. 8) can be used to ap-
ply 2D raster-based textures (P1). For instance, fuzzy
or sketchy appearances can be achieved by using 2D
noise or stroke textures (Kopf et al., 2010).
Bottom-up Compositing. The evaluated per-
category colors are finally composited using a
bottom-up strategy (Porter and Duff, 1984). There-
fore, the colors are blended starting from the lowest
rank to the highest accordingly (P5/P6). This en-
ables the correct overlapping between the different
category ranks (P2) and alpha blending to visualize
tunnels or similar constellations. Depending on
the application, the blending procedure can take
different aspects and data into account (P3), e.g., to
consider only colors of the main segments and ignore
respective outlines (Fig. 6(c)).
5.4 Performance Evaluation
This sections briefly discusses the runtime perfor-
mance of our prototypical implementation. We tested
our approach using OSM datasets of different geo-
metric complexity (Tab. 1). The performance tests
are conducted on the following test platform: Intel
i3-3110M (2,4GHz, Dual Core, Hyperthreading) with
Intel HD 4000 GPU running a Gentoo Linux (Ker-
nelversion 3.12.6). The test application runs in win-
dowed mode. The complete scene is visible in the
view frustum, thus view-frustum culling is not per-
formed but backface culling is enabled. For each mea-
suring step, a total of 5000 consecutive frames are
rendered. Finally, all records are averaged.
Table 2 shows the results of our performance eval-
uation for different screen resolutions. The mea-
sured run-time latencies clearly indicate that our ap-
proach is fill-limited due to heavy per-fragment oper-
ations and limited by the number of applied parameter
sets. Considering the low-end graphics hardware and
non-optimized shader implementations, the achieved
frame rate of more than 20 frames-per-seconds satis-
fies interactive time constraints.
Despite the GPU-based representation of a trans-
portation network and the respective parameter sets,
our image-based approach introduces additional costs
in video memory. Given the horizontal w and ver-
tical h framebuffer resolution, the required layers l
(e.g., distance, length, and depth), the precision in
Bytes b, as well as the number of street categories
c, the additional memory consumption O can be esti-
mated linearly with: O = c · w · h · l · b. For example,
approx. 214 MB video memory is required for a full
HD (1920×1080) rendering of a street network com-
prising nine categories with three render targets per
layers at a floating-point precision of 32 Bit. Since
distance fields are suitable for being interpolated lin-
early during sampling (Green, 2007), a precision of
Table 1: Geometric complexity of the test data sets used in
the runtime performance evaluation.
ID Data Set #Nodes #Ways
A Berlin 1 5571 1028
B Istanbul 2004 263
C Berlin 2 9502 1766
InteractiveRenderingandStylizationofTransportationNetworksusingDistanceFields
215

Table 2: Performance results rendering the test data sets at
different output resolutions using different number of styl-
ization definitions (in milliseconds).
Resolution ID Parameter Sets
1 2 4 8
390 × 260 A 3.0 3.2 4.1 5.5
B 2.9 3.3 4.1 5.4
C 3.0 3.4 4.2 5.5
670 × 450 A 3.0 3.2 4.1 5.7
B 2.9 3.3 4.2 5.6
C 3.0 3.4 4.2 5.8
1280 × 800 A 25.5 29.0 36.1 50.1
B 25.4 29.0 36.2 50.1
C 25.3 29.2 36.2 50.2
8 Bit is sufficient for most applications, resulting in a
memory consumption of approximately 50 MB.
6 RESULTS & DISCUSSION
This section presents a discussion of our results by
means of application examples and by discussing lim-
itations which lay the basis for future work.
6.1 Application Examples
We tested our approaches using different OSM data
sets with different categorizations for route styliza-
tion. Figure 9 shows an overview of various appli-
cation examples demonstrating the capabilities of our
prototypical rendering techniques.
Localization. The support of different stylization
parameters facilitates the generation of localized
maps (e.g., in terms of color (P7)) without requiring
to change the geometric representation. Figure 9(a)
shows three different view-dependent stylizations that
can be interchanged during rendering. Note how net-
work segments with lower rank are faded in the rear
part of the scene as well as the counterbalance of the
foreshortening of the segments’ widths.
Distance-based Stylization. In (Vaaraniemi et al.,
2011) the view-dependent rendering of routes are in-
troduced. This counterbalances the effects of 3D per-
spective projections such as perspective foreshorten-
ing, and thus visual clutter (Jobst and D
¨
ollner, 2008)
in the rear parts of the 3D scene (Fig. 9(b)). This
can be achieved using the presented LoD approach
by enabling: (1) the fading of low-ranked route seg-
ments and (2) increasing the width of high-ranked
route segments with increasing distance to the virtual
camera (P3/P5). Thus, the depiction of low-ranked
or unimportant routes can be omitted to avoid vi-
sual clutter while important routes are emphasized to
counterbalance perspective foreshortening.
Interactive Lens-based Filtering. This fo-
cus+context functionality is common in visualization
frameworks for interactive user-driven filtering (P3).
To support this feature, the LoD approach is applied
as follows (Fig. 9(c)): two distinct stylization param-
eter sets are defined for the focus and context region
respectively. Here, the focus shows a detailed view on
a route network comprising all route categories, while
the context only depict the three major categories. A
screen-space lens (see inset) is used to control the
transition between the respective LoD levels.
Regions-of-Interest Visualization. Similar to lens-
based filtering, the LoD approach can be used to
explicitly highlight a certain navigation route, while
omitting the rendering of the remaining network ar-
eas. Figure 9(d) shows an example of controlling
the level-of-detail stylization using a region of inter-
est (RoI) defined along a path of network segments.
This can be used for highlighting segments relevant
for navigation. The RoI is encoded using a texture
(inset) that is referenced in network coordinates. The
rendering of network parts that are not of interest is
mostly omitted. A transition represented by a drop-
off function conveys parts of the context required for
navigation, e.g., junctions or routes with a high (im-
portant) rank.
6.2 Limitations
To this extent, the image-based approach presented
in this paper is limited conceptually and technically.
Despite being currently limited to render planar net-
works, the usage of distance fields causes two prob-
lems in the final depiction: intrusion and protrusion.
Intrusion is caused if the distance field of two routes
of the same category intrude each other because of
a large line width parametrization. Thus, the ren-
dering results can appear as being connected to the
viewer. Further, protrusion appears where two street
categories with different width parameter intersect,
especially at T-junctions. Here, the distance field of
a high ranked street protrudes the distance fields of
a lower ranked street. Finally, the additional video
memory required by our approach is a major techni-
cal limitation, especially for future implementations
on mobile devices. With respect to these, future im-
GRAPP2015-InternationalConferenceonComputerGraphicsTheoryandApplications
216
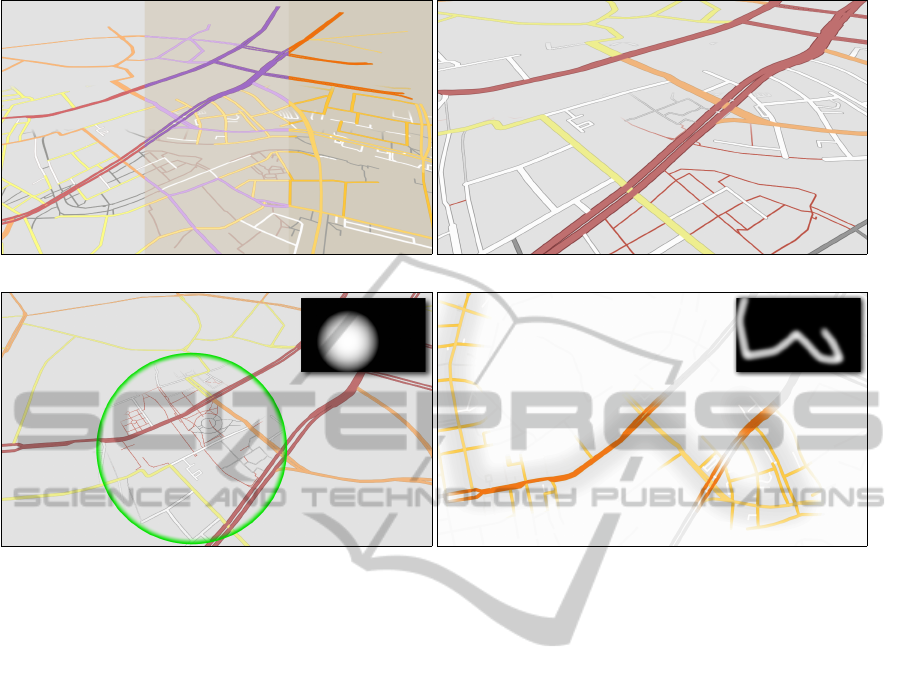
(a) OpenStreetMap, Bing, and Google Maps stylizations. (b) Distance-based Stylization.
(c) Lens-based Filtering. (d) Region-of-Interest Rendering.
Figure 9: Overview of different application examples rendered with the presented approach.
plementations for mobile platforms would require ge-
ometry shader functionality, e.g., in OpenGL ES.
6.3 Future Work
The presented approaches lay the basis for future re-
search directions. Despite optimizing the implemen-
tation and enhancing the visualization by integrating
internal labels (Vaaraniemi et al., 2014), the previ-
ously described limitations can be counterbalanced by
adapting the cap geometry generation according to the
node grade and the ranks of adjacent segments.
Further, our approach can be enhanced by apply-
ing adaptive or view-dependent tessellation or sub-
division schemes of the input line segments to yield
more smooth curves, e.g., for the rendering of round-
abouts. Furthermore, the geometry creation stage can
be extended by computing alternative geometric rep-
resentations, e.g., to enable the application of street
networks as visualization scenery. Also, the compact
network representation also lays the basis for future
research in view-adaptive generalization of transfor-
mation networks, solely performed on GPU.
.
7 CONCLUSIONS
This work presents an interactive, image-based ap-
proach for interactive rendering and cartographic styl-
ization of transportation networks that is especially
suitable for map visualization, which we exemplified
for street networks. Our fully hardware-accelerated
rendering technique enables the efficient storage of
route network geometry and appearance variances
while requiring only a single geometry and post-
processing pass for image synthesis. It represents the
basis for a number of applications in the context of
2D and 3D geovirtual environments, such as view-
adaptive rendering of route networks, interactive fil-
tering as well as highlighting.
ACKNOWLEDGEMENTS
This work was funded by the Federal Ministry of Ed-
ucation and Research (BMBF), Germany within the
InnoProfile Transfer research group ”4DnD-Vis”.
InteractiveRenderingandStylizationofTransportationNetworksusingDistanceFields
217

REFERENCES
Agrawala, M. and Stolte, C. (2001). Rendering Effective
Route Maps: Improving Usability Through General-
ization. In Proc. ACM SIGGRAPH, pages 241–249.
Bavoil, L. and Myers, K. (2008). Order Independent Trans-
parency with Dual Depth Peeling. Technical report,
NVIDIA.
Bene
ˇ
s, J., Wilkie, A., and K
ˇ
riv
´
anek, J. (2014). Procedural
Modelling of Urban Road Networks. Comput. Graph.
Forum, 33(6):132–142.
Bertin, J. (1981). Graphics and graphic information pro-
cessing. Walter de Gruyter.
Bruneton, E. and Neyret, F. (2008). Real-Time Rendering
and Editing of Vector-based Terrains. Comput. Graph.
Forum, 27(2):311–320.
Cao, T.-T., Tang, K., Mohamed, A., and Tan, T.-S. (2010).
Parallel Banding Algorithm to compute exact distance
transform with the GPU. In Proc. I3D, pages 83–90.
Cockburn, A., Karlson, A., and Bederson, B. B. (2009).
A Review of Overview+Detail, Zooming, and Fo-
cus+Context Interfaces. ACM Comput. Surv.,
41(1):2:1–2:31.
Danielsson, P.-E. (1980). Euclidean Distance Mapping.
Comput. Graph. Image Process., 14(3):227–248.
Degener, P. and Klein, R. (2009). A Variational Approach
for Automatic Generation of Panoramic Maps. ACM
Trans. Graph., 28:2:1–2:14.
Falk, M., Schafhitzel, T., Weiskopf, D., and Ertl, T. (2007).
Panorama Maps with Non-linear Ray Tracing. In
Proc. ACM GRAPHITE, pages 9–16.
Foerster, T., Stoter, J. E., and Kobben, B. (2007). Towards
a formal classification of generalization operators. In
Proc. International Cartographic Conference.
Frisken, S. F., Perry, R. N., Rockwood, A. P., and Jones,
T. R. (2000). Adaptively Sampled Distance Fields:
A General Representation of Shape for Computer
Graphics. In Proc. ACM SIGGRAPH, pages 249–254.
Furnas, G. W. (1986). Generalized Fisheye Views. In Proc.
CHI, pages 16–23.
Galin, E., Peytavie, A., Gu
´
erin, E., and Bene
ˇ
s, B. (2011).
Authoring Hierarchical Road Networks. Comput.
Graph. Forum, 30(7):2021–2030.
Galin, E., Peytavie, A., Marchal, N., and Gurin, E. (2010).
Procedural Generation of Roads. Comput. Graph. Fo-
rum, 29(2):429–438.
Green, C. (2007). Improved Alpha-Tested Magnification
for Vector Textures and Special Effects. In ACM SIG-
GRAPH Courses, pages 9–18.
Haklay, M. and Weber, P. (2008). OpenStreetMap: User-
Generated Street Maps. IEEE Pervasive Computing,
7(4):12–18.
Haunert, J.-H. and Sering, L. (2011). Drawing Road Net-
works with Focus Regions. IEEE Trans. Vis. Comput.
Graphics, 17(12):2555–2562.
Hirono, D., Wu, H.-Y., Arikawa, M., and Takahashi, S.
(2013). Constrained Optimization for Disoccluding
Geographic Landmarks in 3D Urban Maps. In Proc.
IEEE PacificVis, pages 17–24.
Imhof, E. (1975). Positioning Names on Maps. The Ameri-
can Cartographer, 2(2):128–144.
Jiang, B. and Claramunt, C. (2004). A Structural Approach
to the Model Generalization of an Urban Street Net-
work. GeoInformatica, 8(2):157–171.
Jobst, M. and D
¨
ollner, J. (2008). Better Perception of 3D-
Spatial Relations by Viewport Variations. In Proc.
10th International Conference on Visual Information
Systems, pages 7–18.
Karnick, P., Cline, D., Jeschke, S., Razdan, A., and Wonka,
P. (2010). Route Visualization Using Detail Lenses.
IEEE Trans. Vis. Comput. Graphics, 16(2):235–247.
Kersting, O. and D
¨
ollner, J. (2002). Interactive 3D Visu-
alization of Vector Data in GIS. In Proc. ACM GIS,
pages 107–112.
Kopf, J., Agrawala, M., Bargeron, D., Salesin, D., and Co-
hen, M. (2010). Automatic Generation of Destination
Maps. ACM Trans. Graph., 29:158:1–158:12.
Kraak, M. and Ormeling, F. (2003). Cartography: Visual-
ization of Geospatial Data. Pearson Education.
Kr
¨
oger, J., Schiewe, J., and Weninger, B. (2013). Analysis
and Improvement of the Open-StreetMap Street Color
Scheme for Users with Color Vision Deficiencies. In
Proc. International Cartographic Conference.
MacEachren, A. (1995). How Maps Work. Guilford Press.
Ohlarik, D. and Cozzi, P. (2011). A Screen-Space Approach
to Rendering Polylines on Terrain. In Proc. ACM SIG-
GRAPH Posters, page 68.
Polis, M. F., Gifford, S. J., and McKeown, D. M. (1995).
Automating the Construction of Large-Scale Virtual
Worlds. IEEE Computer, 28(7):57–65.
Porter, T. and Duff, T. (1984). Compositing digital images.
Proc. ACM SIGGRAPH, 18(3):253–259.
Qu, H., Wang, H., Cui, W., Wu, Y., and Chan, M.-Y.
(2009). Focus+Context Route Zooming and Informa-
tion Overlay in 3D Urban Environments. IEEE Trans.
Vis. Comput. Graphics, 15:1547–1554.
Rong, G. and Tan, T.-S. (2006). Jump Flooding in GPU
with Applications to Voronoi Diagram and Distance
Transform. In Proc. ACM I3D, pages 109–116.
Schneider, M., Guthe, M., and Klein, R. (2005). Real-
time Rendering of Complex Vector Data on 3D Ter-
rain Models. In Proc. VSMM, pages 573–582.
Schneider, M. and Klein, R. (2007). Efficient and Accu-
rate Rendering of Vector Data on Virtual Landscapes.
Journal of WSCG, 15(1-3):59–66.
Semmo, A., Kyprianidis, J. E., Trapp, M., and D
¨
ollner, J.
(2013). Real-Time Rendering of Water Surfaces with
Cartography-Oriented Design. In Proc. CAe, pages
5–14.
Semmo, A., Trapp, M., Kyprianidis, J. E., and D
¨
ollner, J.
(2012). Interactive Visualization of Generalized Vir-
tual 3D City Models using Level-of-Abstraction Tran-
sitions. Comput. Graph. Forum, 31(3):885–894.
Shneiderman, B. (1996). The eyes have it: a task by
data type taxonomy for information visualizations. In
Proc. IEEE Symposium on Visual Languages, pages
336–343.
GRAPP2015-InternationalConferenceonComputerGraphicsTheoryandApplications
218

Skubic, M., Blisard, S., Bailey, C., Adams, J. A., and Mat-
sakis, P. (2004). Qualitative Analysis of Sketched
Route Maps – Translating a Sketch into Linguistic
Descriptions. IEEE Trans. Syst., Man, Cybern. B,
34(2):1275–1282.
Takahashi, S., Yoshida, K., Shimada, K., and Nishita, T.
(2006). Occlusion-Free Animation of Driving Routes
for Car Navigation Systems. IEEE Trans. Vis. Com-
put. Graphics, 12(5):1141–1148.
Tominski, C., Gladisch, S., Kister, U., Dachselt, R., and
Schumann, H. (2014). A Survey on Interactive Lenses
in Visualization. In Proc. EuroVis - STARs, pages 43–
62.
Trapp, M., Schmechel, S., and D
¨
ollner, J. (2013). Inter-
active Rendering of Complex 3D-Treemaps. In Proc.
GRAPP, pages 165–175.
Tversky, B. and Lee, P. U. (1999). Pictorial and Verbal
Tools for Conveying Routes. In Spatial Informa-
tion Theory. Cognitive and Computational Founda-
tions of Geographic Information Science, pages 51–
64. Springer.
Tyner, J. (2010). Principles of map design. Guilford Press.
Vaaraniemi, M., G
¨
orlich, M., and in der Au, A. (2014). In-
telligent Prioritization and Filtering of Labels in Nav-
igation Maps. Journal of WSCG, 22(1):11–20.
Vaaraniemi, M., Treib, M., and Westermann, R. (2011).
High-Quality Cartographic Roads on High-Resolution
DEMs. Journal of WSCG, 19(2):41–48.
Wang, F., Li, Y., Sakamoto, D., and Igarashi, T. (2014).
Hierarchical Route Maps for Efficient Navigation. In
Proc. ACM UIST, pages 169–178.
Wartell, Z., Kang, E., Wasilewski, T., Ribarsky, W., and
Faust, N. (2003). Rendering Vector Data over Global,
Multi-resolution 3D Terrain. In Proc. Data Visualisa-
tion, pages 213–222.
Weber, A. and Benner, J. (2001). Interactive Generation of
Digital Terrain Models Using Multiple Data Sources.
In Digital Earth Moving, pages 60–64. Springer.
Wloka, M. (2005). ShaderX3, chapter Improved Batching
Via Texture Atlases, pages 155–167. Charles River
Media.
InteractiveRenderingandStylizationofTransportationNetworksusingDistanceFields
219
