
Scene Representation and Anomalous Activity Detection using Weighted
Region Association Graph
D. P. Dogra
1
, R. D. Reddy
1
, K. S. Subramanyam
2
, A. Ahmed
3
and H. Bhaskar
4
1
School of Electrical Sciences, Indian Institute of Technology, Bhubaneswar, India
2
Department of Computer Sc. & Engineering, National Institute of Technology, Rourkela, India
3
Department of Computer Sc. & Engineering, Haldia Institute of Technology, Haldia, India
4
Department of Electrical and Computer Engineering,
Khalifa University of Science Technology and Research, Abu Dhabi, U.A.E.
Keywords:
Scene Representation, Anomalous Activity Detection, Region Association Graph, Importance, Scene
Segmentation, Graph Theory, Trajectory Analysis, Behaviour Analysis, Scene Understanding, Visual
Surveillance.
Abstract:
In this paper we present a novel method for anomalous activity detection using systematic trajectory analy-
sis. First, the visual scene is segmented into constituent regions by attaching importances based on motion
dynamics of targets in that scene. Further, a structured representation of these segmented regions in the form
of a region association graph (RAG) is constructed. Finally, anomalous activity is detected by benchmarking
the target’s trajectory against the RAG. We have evaluated our proposed algorithm and compared it against
competent baselines using videos from publicly available as well as in-house datasets. Our results indicate
high accuracy in localizing anomalous segments and demonstrate that the proposed algorithm has several
compelling advantages when applied to scene analysis in autonomous visual surveillance.
1 INTRODUCTION
Anomalous activity detection in surveillance videos
can present diverse opportunities for both enhancing
situation awareness (Takai, 2010) and mining critical
forensic evidence (Ouivirach et al., 2013). In the last
few years, the number of security cameras installed
at various surveillance sites across the world has
increased in leaps and bounds. This vast collection
of visual data has made manual analytic on such
systems inappropriate and thus, automatic visual
surveillance is fast replacing manual interventions
for such systems (Gowsikhaa et al., 2012). This trend
in autonomous visual surveillance has also been
widely supported by the growth in video analytic
capabilities, for a wide variety of applications from
motion detection (Zhang and Liu, 2008; Kiryati et al.,
2008), tracking (Niu et al., 2004), parsing (Antic
and Ommer, 2011), activity recognition (Hamid
et al., 2005), behavioural understanding (Ouivirach
et al., 2013; Takai, 2010; Hospedales et al., 2011),
and traffic analysis (Krishna and Denzler, 2014).
Despite recent work in this research domain, the
problem of anomalous activity detection continues
to be challenged by: a) the identification of what
constitutes anomalous within the surveillance context
and differentiating it from suspicious, b) deliberating
the cost of missed detection and its repercussions on
the analytic system, c) the complexity in delivering
efficient association of such deviations-from-normal
across large-scale camera networks, and d) to be
able to perform this in a structured, systematic and
scalable manner.
Several state-of-the-art algorithms to detect anoma-
lous activities in videos have already been pro-
posed (Mahadevan et al., 2010; Zhao et al., 2011).
One paradigm for anomalous activity detection is
by segmenting a video in the temporal domain,
where each segment can be classified into different
categories of interest (Ouivirach et al., 2013; Krishna
et al., 2014). In such algorithms, the overall change
in dynamics of a scene within a time interval is con-
sidered as a feature to identify a temporal segment
of interest. Any measured deviations from these
supervised segments of interest is often classified
anomalous (Hamid et al., 2005). On the contrary,
individual trajectories can be analysed to determine
104
Dogra D., Reddy R., Subramanyam K., Ahmed A. and Bhaskar H..
Scene Representation and Anomalous Activity Detection using Weighted Region Association Graph.
DOI: 10.5220/0005305101040112
In Proceedings of the 10th International Conference on Computer Vision Theory and Applications (VISAPP-2015), pages 104-112
ISBN: 978-989-758-090-1
Copyright
c
2015 SCITEPRESS (Science and Technology Publications, Lda.)

those segments of a video where any anomalous
activity could have occurred. An example of this
second paradigm in anomalous activity detection
shall include techniques where trajectory mean
computed during training is used as a reference and
any deviation beyond a threshold from the mean
is classified as anomalous. Such approaches are
also popular and tested in the context of visual
surveillance (Nater et al., 2011; Kuettel et al., 2010).
The challenges in either paradigms is three-fold.
Firstly, any decision about anomalous activity needs
to be taken without the knowledge of the scene
elements present in an environment. Under such cir-
cumstances, it is difficult to attribute the anomalous
activity to inherent factors that might have influenced
the behaviour of the human in question. Secondly,
any existing framework fails to generalise or scale
for wide scoped patterns of abnormal behaviour,
particularly, random and unpredictable movements.
Lastly, according to some state-of-the-art approaches,
it is quite difficult to predict whether the abnormality
is caused by measurement noise (e.g. error in
tracking) or it appeared due to abnormal behavioural
pattern. In this paper, we have addressed first two
challenges and provided a methodology that is
capable of detecting abnormal movements without
any prior knowledge about the scene elements, and
even capable of handling random and unpredictable
movements.
In this paper, we present a scene-aware anoma-
lous activity detection algorithm using weighted
RAG. The proposed framework relies on segmenting
regions in the scene based on their relative impor-
tances and use them for classification of anomalous
activity. Our experiments have shown that our impor-
tance metric encapsulates interest areas in the scene
that often represent the interaction of the targets with
the other scene elements. That way, our algorithm
encompasses the contextual relationships between
targets and constituent scene elements during scene
understanding, thus providing a more informed
behavioural decision making in anomalous activity
detection.
2 CONTRIBUTIONS AND
NOVELTY
The main aim of the proposed research is to detect and
localize anomalous segments in surveillance videos
where the targets motion shows significant deviation
from normal. One key novelty of the paper is the
method for scene segmentation by attaching impor-
tances to regions based on motion dynamic features
estimated from trajectories of targets from the scene.
Further, the use of a structured scene representation
through RAG allows systematic trajectory analysis
that, not alone improves the accuracy of anomalous
activity detection but at the same time provides a scal-
able framework for generic detection of irregular pat-
terns of movements, etc. Finally, the incorporation
of a node clustered traversal mechanism that bench-
marks the tests trajectory against the significance of
each path in the RAG to detect anomaly is an impor-
tant and useful contribution in this context.
3 ANOMALOUS ACTIVITY
DETECTION
The proposed method assumes a structured geomet-
rical representation of a surveillance scene and cor-
relates a test trajectory with respect to this structure,
thus allowing detection of anomalous activity. The
proposed method is a 3 step process involving: a)
scene segmentation, b) structured scene representa-
tion using RAG, and c) anomalous activity detection.
These steps are described in the subsections as fol-
lows.
3.1 Feature Extraction and Scene
Segmentation
Our method begins with scene segmentation; wherein
the criteria for homogeneity is based on the impor-
tance of regions. That is, given a surveillance scene
and a set of trajectories representing target move-
ments inside that scene, we begin by segmenting the
scene into regions of similar importances. To ac-
complish this, the entire scene is divided into rect-
angular blocks of uniform dimensions. Let, a visual
scene captured from a surveillance camera be pre-
sented by a frame I of dimension w × h, where w and
h represent its width and height. Now, I can be di-
vided into rectangular blocks b of dimension m × m
as shown in Figure 1(a). Our aim is to decompose
this scene I into a number (K) of semantically ho-
mogeneous regions. Given that I is already divided
into blocks, each block b in I belongs to exactly one
region, identified by the region-correspondence vari-
able R
b
∈ 1, ..., K. Therefore, the rth region is the set
of blocks B
r
, whose region correspondence variable
equals r, i.e., B
r
= {b : R
b
= r}. Further, our aim
is to extract motion dynamics features
−→
f (
−→
b ) corre-
sponding to each block and compose them into pro-
SceneRepresentationandAnomalousActivityDetectionusingWeightedRegionAssociationGraph
105

viding a measurement of importance
−→
i (
−→
b ). Then,
blocks with homogeneous importances i
b
are grouped
to build regions in the scene. We can mathematically
formulate the problem of scene segmentation as:
I =
[
r
B
r
=
[
b
{b : R
b
= r} ∈ 1, ..., K. (1)
R
b
= argmax
−→
f (
−→
b ). (2)
∀b f (b) = (i
b
). (3)
3.1.1 Labelling of Blocks
The region correspondence R
b
of each block is
chosen based on the statistical information about
the target density and motion dynamics of targets
within each block. Our motion dynamics features
encapsulates the time spent by the target visiting each
block, average instantaneous velocity of target inside
the block and the overall directionality. Thus, we
represent the region correspondence of blocks as a
block importance i
b
which in turn is composed of the
combination of the visit count and the instantaneous
velocity.
We estimate i
b
based on the average instantaneous ve-
locity of the moving targets inside that block. This is
based on the assumption that a target usually moves
slower than its average velocity as it approaches to-
wards an interest area. Therefore, the instantaneous
velocity (v
o
j
) of a target is expected to be lower than
its average velocity (v
o
) under these conditions. The
index of a block b is computed recursively using the
following update equation, assuming that the initial
index for all blocks is zero, i.e. ρ
b
= 0, ∀b ∈ M
ρ
b
= ρ
b
+
v
o
av
− v
o
j
v
o
av
. (4)
where ρ
b
represents the popularity index of the block
b. Finally, ρ
b
is normalized with respect to the total
number of times a block is visited by various targets
(g
b
). Finally, (i
b
) is computed using (5). This metric
incorporates the importance of each block combining
both the features of velocity and time spent by the
targets visiting that block.
i
b
= ∀b
ρ
b
g
b
. (5)
Our experiments with such importance distributions
across wide range of surveillance videos from dif-
ferent dataset have indicated that, the class space
of regions can be discretized into 4 distinct labels
{R
b
: {1, 2, 3, 4}}: interesting blocks L
1
, frequently
visited blocks L
2
, rarely visited blocks L
3
and in-
accessed blocks L
4
. Given the importances of each
block, we apply filtering to determine the local max-
ima that represent interesting class (L
1
). The remain-
ing blocks are labelled based on the number of times
the block is visited by various targets as they navi-
gate through the scene. It is quite natural that, blocks
which fall on the conventional path towards an inter-
est area, are expected to have larger footfall than other
blocks. Therefore, a scene specific threshold can eas-
ily be computed using the training set to label fre-
quently visited blocks (L
2
). On the contrary, blocks
with footfall lower than the threshold and greater than
zero are labelled L
3
while the remaining blocks which
are never visited by any target, are labelled L
4
. An ex-
ample of scene labelling is shown in Figures 1(b).
3.1.2 Scene Segmentation
In order to segment a scene, we have adopted a
region growing approach that groups neighbouring
blocks with same labels into clusters. To accomplish
this, connected components are discovered using 8-
connectivity rule in neighbourhood of each block and
thus segmented regions are generated. That is, if b
8
represents the 8-neighbourhood of the block b under
consideration, all neighbours, e.g. c(b), that are con-
nected to the block b, c(b) should satisfy the proper-
ties:
c(b) ⊂ b
8
. (6)
k ∈ c(b) ↔ b ∈ c(k). (7)
In Figure 1(c), the segmentation of a scene accord-
ing to block labels shown in Figure 1(b), is presented.
Each segment represents a spatial region of the scene
comprised of several interconnected blocks of similar
characteristics.
3.2 Scene Representation using RAG
In the next phase, we construct a weighted RAG. We
denote this graph as G(V, E), where v ∈ V and e ∈ E
are nodes and edges of the graph, respectively. Each
of the regions found in the previous step of scene seg-
mentation is assigned a node in the graph connected
by edges with respective weights. The RAG corre-
sponding to the segmentation given in Figure 1(c),
containing seven nodes, e.g. {N
1
, N
2
, ....., N
7
} and ten
edges is shown in Figure 2. We assign weights to
these nodes based on average time spent by a target
in each node. For example, if k independent trajec-
tory segments pass through a node, say N
i
, its weight
is computed using (8) where s
j
is the length of the
j
th
trajectory segment passing through N
i
. However,
nodes that represent inaccessible regions are initial-
ized with zero weight since we have assumed that tar-
VISAPP2015-InternationalConferenceonComputerVisionTheoryandApplications
106
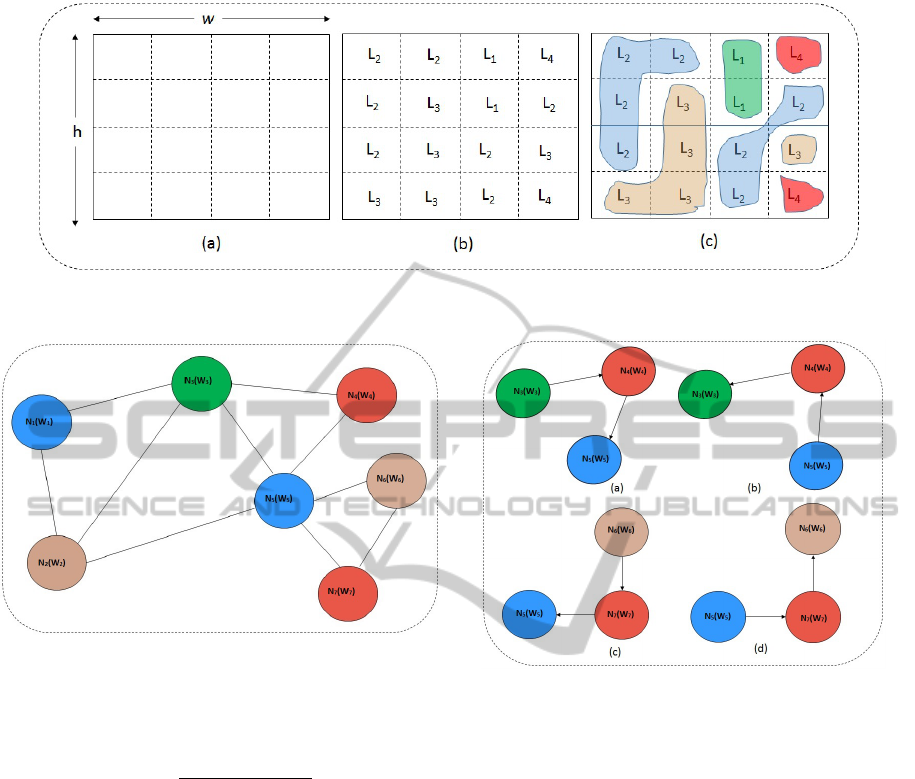
Figure 1: (a) Division of the surveillance area into rectangular blocks (b) Labelling of individual blocks using the method
described in Section 3.1.1 (c) A segmentation of the scene according to the labelling.
Figure 2: An example of a weighted RAG corresponding to
the segmentation of the scene given in Figure 1.
gets will never visit those regions in normal circum-
stances.
N
i
(w) =
s
1
+ s
2
+ .... + s
k
k
. (8)
Two nodes are connected by an edge if the corre-
sponding regions are neighbours to each other accord-
ing to the results of scene segmentation. For example,
node N
3
has four neighbours, e.g. {N
1
, N
2
, N
4
, N
5
}.
This suggests, any part of the scene marked by the
node N
3
can be reached directly from any of these
four neighbouring nodes. Using this approach, edges
of the RAG are discovered and an adjacency matrix
is used to represent the graph in an efficient manner.
An example adjacency matrix of the graph shown in
Figure 2 can be expressed using (9).
A =
N
1
N
2
N
3
N
4
N
5
N
6
N
7
N
1
N
2
N
3
N
4
N
5
N
6
N
7
0 1 1 0 0 0 0
1 0 1 0 1 0 0
1 1 0 1 1 0 0
0 0 1 0 1 0 0
0 1 1 1 0 1 1
0 0 0 0 1 0 1
0 0 0 0 1 1 0
. (9)
In practice, RAG represents overall connectivity
of various regions that constitute the whole scene.
Figure 3: Examples of probable invalid or anomalous seg-
ments of the object’s path according to the weighted RAG
given in Figure 2.
Therefore, a given test trajectory recorded in the scene
under consideration, it is possible to benchmark it
against the graph to determine anomaly. For exam-
ple, if any inaccessible node of the RAG is found in a
path of a moving object, then that particular segment
of the path can be considered as anomalous. Some
examples of anomalous segments for the graph given
in Figure 2 are presented in Figure 3.
3.3 Trajectory Segmentation and
Anomalous Activity Detection
In this section, we present a method to analyse a given
test trajectory with respect to the weighted RAG that
was built using a set of training trajectories. Let the
trajectory of a moving object be represented using a
sequence of points as given in (10) where s is the size
of the trajectory and < x
i
, y
i
> represents the location
of the object at time t
i
.
T
s
=< x
1
, y
1
>, < x
1
, y
1
>, ..., < x
s
, y
s
> . (10)
SceneRepresentationandAnomalousActivityDetectionusingWeightedRegionAssociationGraph
107
A trajectory is nothing but a set of points that repre-
sents temporal locations of a target inside the field of
view of the camera. In practise, these points are uni-
formly sampled. Initially, every point of the trajectory
is mapped to a node in the RAG as given in (11). In
this equation, N
k
denotes a node of the RAG and the
point < x
i
, y
i
> is a member of the region denoted by
this node.
< x
i
, y
i
>= N
k
. (11)
In practice, consecutive points of a trajectory often
belong to a single segment or node. Therefore, di-
rect mapping of trajectory points into graph nodes of-
ten leads to a longer path with redundant nodes. For
example, the path N
a
→ N
b
→ N
b
→ N
b
→ N
c
con-
tains three consecutive nodes of same label. Three
occurrences of N
b
in consecutive locations is redun-
dant and hence is removed using a path shrinking al-
gorithm; wherein we combines all consecutive nodes
with same label into a single node in a given path.
Additionally we parametrise and store the length of
shrinking the nodes as the duration of the targets
movement inside a particular node. This is similar
to the weights of the RAG. The path corresponding
to a test trajectory can be represented using (12). N
i
and N
j
represent consecutive nodes of the path with
durations D
N
i
and D
N
j
.
P = {N
i
(D
N
i
) → N
j
(D
N
j
)}
+
where N
i
6= N
j
. (12)
One such path according to the graph shown in Fig-
ure 2 can be written as: N
1
(D
N
1
) → N
2
(D
N
2
) →
N
5
(D
N
5
) → N
3
(D
N
3
) → N
4
(D
N
4
) → N
5
(D
N
5
). Now,
an efficient traversal technique is implemented to
search and localize invalid segments in such a path.
The result of path segmentation is further used for
trajectory classification to indicate the presence of in-
valid segments in a trajectory. Algorithm 1 presents
the method of finding invalid segments of a given path
(P) with respect to a given RAG.
The algorithm clusters the nodes of the graph into two
groups; one represents the nodes with label L
4
only
and the other represents the set of remaining nodes.
The process might resemble to bipartition, however,
we may not find a complete bipartite graph because
of the possible interconnections amongst nodes repre-
senting active regions. For example, the cluster which
represents the group of nodes labelled as L
1
, L
2
, or L
3
may have several interconnections amongst them. An
example of such a partition is shown in Figure 4. This
type of clustering can be referred to as semi-bipartite
graph partitioning, where nodes on inaccessible re-
gions have no interconnections.
The above mentioned algorithm successfully detects
cross edges between two clusters. During execution,
Algorithm 1: Detection of invalid segments in a path.
1: procedure INVALIDSEGMENTDETECT(G, P)
2: G(V, E): V = V
inv
∪V
val
V
inv
: set
of nodes with label L
4
and V
val
: set of nodes with
labels L
1
, L
2
, and L
3
.
3: P =
S
v
i
∃v
i
∈ V P: Path of the moving
object.
4: v
k
← next node(P) Get the next node from
the path.
5: while v
k
6= NULL do
6: if v
k
∈ V
inv
then
7: P
k
← { pred(v
k
), v
k
, succ(v
k
)}
pred(v
k
) and succ(v
k
) denote the nodes on either
sides of v
k
according to P.
8: return P
k
Return the detected
invalid segment of the given path P.
9: end if
10: v
k
← next
node(P) Get the next node
from the path.
11: end while Terminate when no more node is
left in the path.
12: end procedure
Figure 4: Clustering of graph nodes and construction of
semi-bipartite graph corresponding to the RAG given in
Figure 2.
a segment, i.e. P
k
← { pred(v
k
), v
k
, succ(v
k
)} is as-
sumed to be invalid if the node v
k
belongs to the clus-
ter of inaccessible regions. In addition to that, du-
ration of each node of P
k
is tested with the weights
estimated during training. However, we need to filter
out false positives since a target may unintentionally
step-forward inside regions that are marked as inac-
cessible. Therefore, such nodes of a path with consid-
erably small duration can be ignored (if they appear
in a path). Once such segments are detected, a trajec-
tory can be classified either normal or anomalous and
finally, segmentation of a path can be done using 13
where P
n
: normal segment and P
s
: abnormal segment.
P = {P
n
+ P
s
}
+
. (13)
VISAPP2015-InternationalConferenceonComputerVisionTheoryandApplications
108
4 EXPERIMENTAL RESULTS
In this section we describe the algorithm evaluation
process. We demonstrate the capabilities of our tech-
nique and compare it against simple baselines.
4.1 Datasets and Ground Truths
In our experiments, two well-known publicly avail-
able surveillance datasets, CAVIAR
1
and ViSOR
2
are considered. In addition, we have also used a
large-sized in-house dataset to validate our method.
Each of these videos in the CAVIAR dataset were
240 second clips in average with 2 or 3 freely moving
targets that are randomly accessing a book shelf and
an ATM present within the open environment. From
ViSOR dataset, we have selected videos from the
”Outdoor Unimore D.I.I. Setup - Multicamera - Dis-
joint Views” set (Vezzani and Cucchia, 2010). These
videos are of long duration, typically in the order
of 40-60 minutes. We have extracted trajectories of
several moving targets from these videos and used
them in our analysis. The custom in-house dataset
contains 192 trajectories representing movements of
a number of targets at the entrance of the institute on
a busy day. In our experiments, we have used 80% of
the trajectories during training to generate the RAG
graph and the remaining trajectories have been used
for testing the detection algorithm. We repeat our
experiments using 10-fold cross validation to negate
any bias that may have been introduced during test
case selection. Trajectories of the moving objects
were extracted using the target detection and tracking
algorithm proposed in (T. Dinh and Medioni, 2011).
The algorithm successfully extracted the trajectories
of a moving target(s) in real time. The method
is robust against small camera movements and
variations in lighting conditions of the environment.
Trajectories of individual objects were extracted
independently when multiple persons appeared in a
scene.
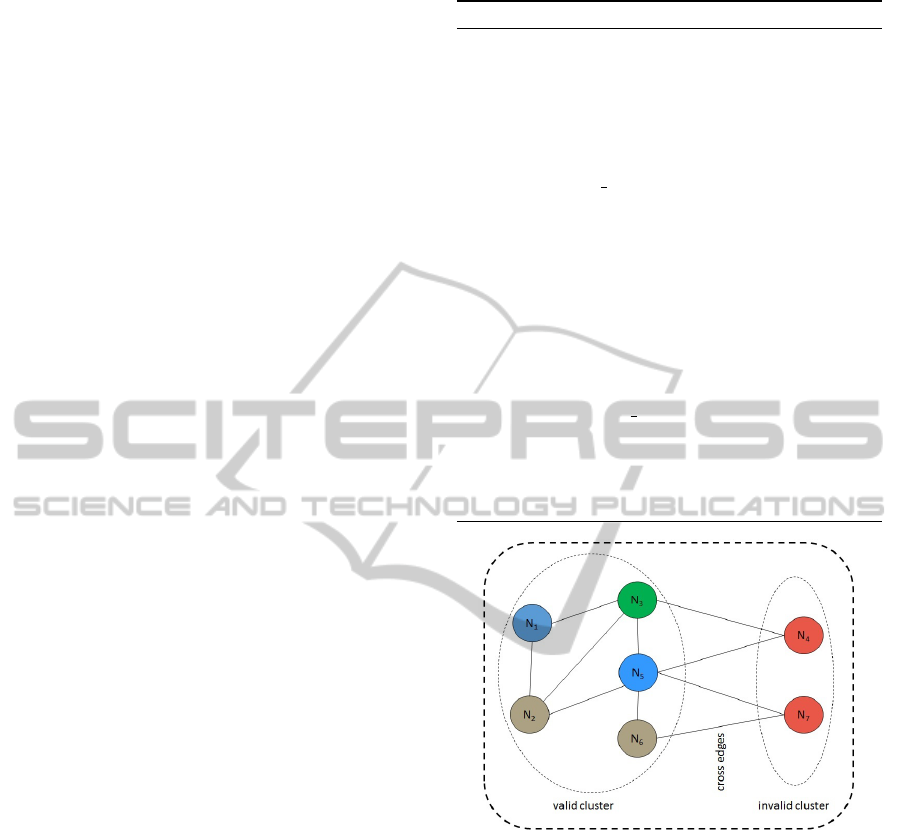
Illustrations of the scenes used in our experiments
are shown in Figure 5. These scenes were segmented
manually and they were assumed to be ground truths.
Corresponding graphs using the proposed scene
representation are shown in Figure 5. This may be
verified from the results shown in Figures 6, 8, and 9,
where the segmentation obtained using the proposed
method closely matches the manual counterpart.
1
CAVIAR: Context Aware Vision using Image-based
Active Recognition.
2
http://www.openvisor.org.
Figure 5: Manual segmentations of ViSOR In-HOUSE and
CAVIAR surveillance scenes. RAGs corresponding the
these manual segmentations are shown in the second row
of the figure.
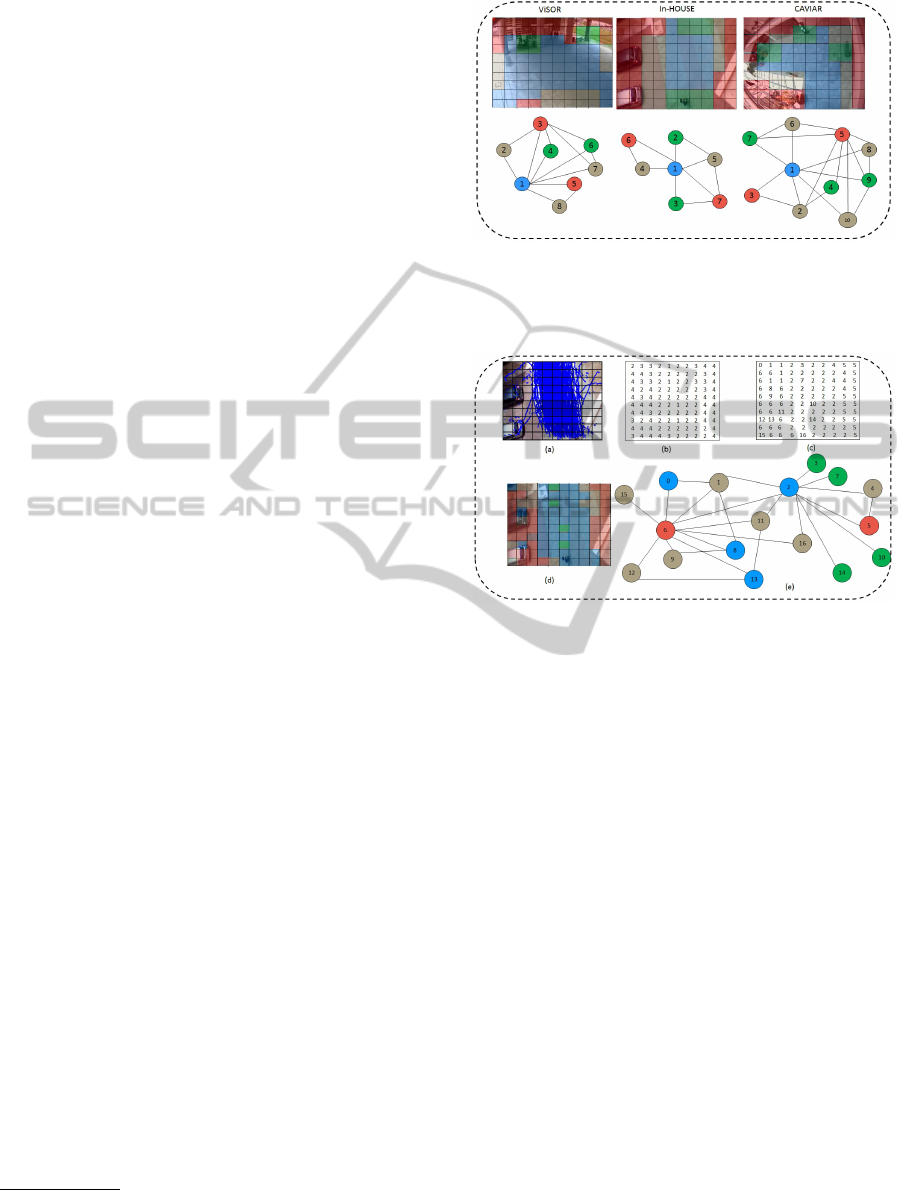
Figure 6: (a) The scene of In-HOUSE dataset is divided into
10 × 10 number of blocks with overlayed trajectories (b)
Labelling of these blocks using a method described in Sec-
tion 3.1.1 (c) Construction of graph nodes using these labels
(d) Colour-coded representation of the segmented scene (e)
RAG corresponding to the segmentation.
4.2 Results using In-HOUSE Dataset
To begin with, we present results using In-HOUSE
dataset. The scene is partitioned mainly into four
segments as shown in Figure 5. The shaded green
sections are the entry and exit locations and our
analysis has categorised them as the interesting
locations (L
1
). This is mainly because, a majority
of the moving targets usually passed through these
regions. Similarly, regions shaded with light blue
are marked as frequently used path and a majority
of these blocks belong to label L
2
. The remaining
two categories of segments are considered as rarely
visited and not-visited segments. Out of a total of
192 trajectories, 170 trajectories have been used to
construct the RAG corresponding to the scene and
the remaining for testing detection.
Figure 6 presents outputs at various steps during
segmentation and RAG construction. The first image
displays the scene being divided into 10 × 10 blocks
SceneRepresentationandAnomalousActivityDetectionusingWeightedRegionAssociationGraph
109
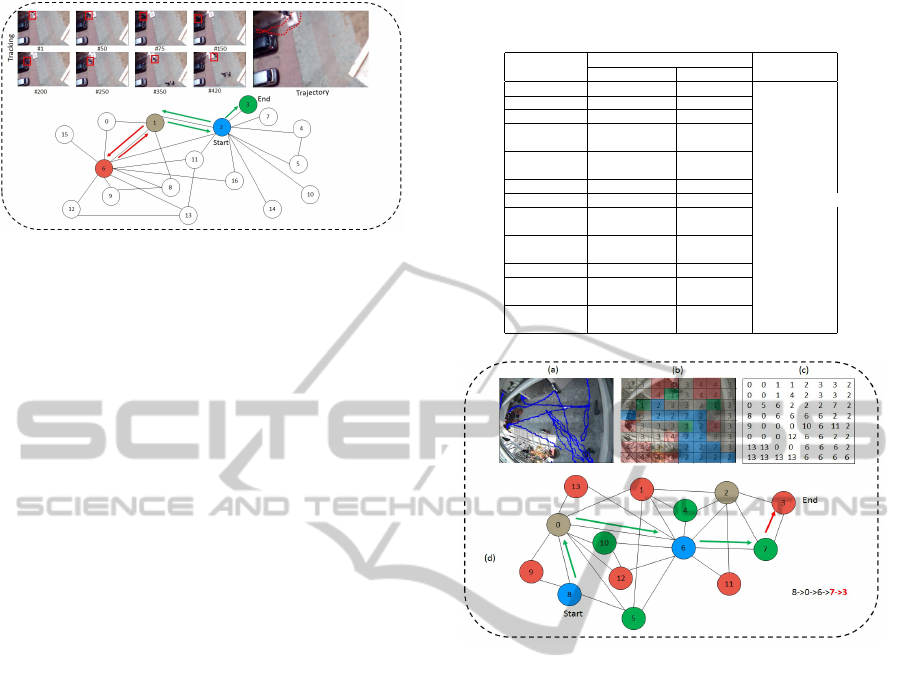
Figure 7: Demonstration of anomalous trajectory segmen-
tation. The section labelled as tracking shows some of the
frames corresponding to trajectory # 132 when a person was
accessing a location which is presumed to be inaccessible
according to the ground truth. Corresponding trajectory is
shown in the diagram. Path of the moving object with re-
spect to the RAG and corresponding valid and invalid seg-
ments are highlighted with green and red arrows.
with overlay trajectories. Successive diagrams of
the figure represent scene labelling, graph node
distribution, coloured segmentation and RAG cor-
responding to the segmentation. It can be observed
that the central area of the scene was segmented as
”frequently visited”, usually because a majority of
the targets are expected to pass this region while
entering or exiting the building. On the contrary, both
sides of the scene have been classified either as rarely
visited or not-visited (except some isolated blocks).
Some of the isolated blocks correspond to outliers,
generated as false positives. These blocks do not
impact the trajectory segmentation algorithm. It may
be noted that, the graph is easily represented using
a semi-bipartite structure as both the inaccessible
nodes, e.g. 5 and 6 have no direct connectivity.
Analysis of one chosen anomalous trajectory, e.g. tra-
jectory #132 is presented in Figure 7. As per the
analysis, the moving object’s path is as follows: 2 →
1 → 6 → 1 → 2 → 3. In addition to that, segment
1 → 6 → 1 has been found to be invalid as the object
entered into a region (represented by node 6) which
according to the RAG structure, is invalid.. Therefore,
this was classified as anomalous trajectory or segment
under the given conditions. Several such anomalous
trajectory segments were found when analysis was
done on the set of test trajectories. A summary of seg-
mentation and classification is presented in Table 1.
4.3 Results using Public Datasets
Next, we present results using the two chosen public
datasets, e.g. CAVIAR and ViSOR. In the CAVIAR
dataset, a total of six videos from the browsing
category were used to construct the segmentation
Table 1: Results of path segmentation and trajectory classi-
fication.
Trajectory # Segmentation Results Performance
Ground Truth Detected
13 normal normal FP: 1
23 normal normal FN: 0
48 normal normal TN: 0
64 anomalous anomalous TP: 5
(1) (1)
72 normal anomalous Precision:
(1) 83%
87 normal normal
94 normal normal
95 anomalous anomalous Recall:
(1) (1) 100%
132 anomalous anomalous
(1) (1)
141 normal normal Accuracy:
170 anomalous anomalous 83%
(1) (1)
183 anomalous anomalous
(1) (1)
Figure 8: (a) Surveillance scene of the CAVIAR dataset
with trajectories overlay (b) Segmentation of the scene with
respect to the labels of blocks (c)Distribution of nodes along
various blocks (d) Final RAG with a anomalous path being
highlighted.
mask and used for testing.
It may be observed from Figure 8(a), according
to the segmentation, the scene has three interesting
locations out of which one location does not have any
interesting object. However, targets exhibit protocol
behaviour in this location and hence was segmented
as a region of high importance during scene segmen-
tation. During testing, while benchmarking against
the RAG shown in Figure 8(d), anomalous activity
was matched to this location; which matched with the
ground truth classification.
A total of 35 independent trajectories were extracted
from the videos of ViSOR surveillance dataset. Out
of these 35 trajectories, we have used 30 trajectories
to construct the RAG during training phase. The
remaining 5 trajectories were used for testing. In
Figure 9, results obtained using the ViSOR dataset
videos are presented. The images in the figure
represent, the ViSOR scene with trajectories over-
lay on it, the segmentation of the scene using the
VISAPP2015-InternationalConferenceonComputerVisionTheoryandApplications
110
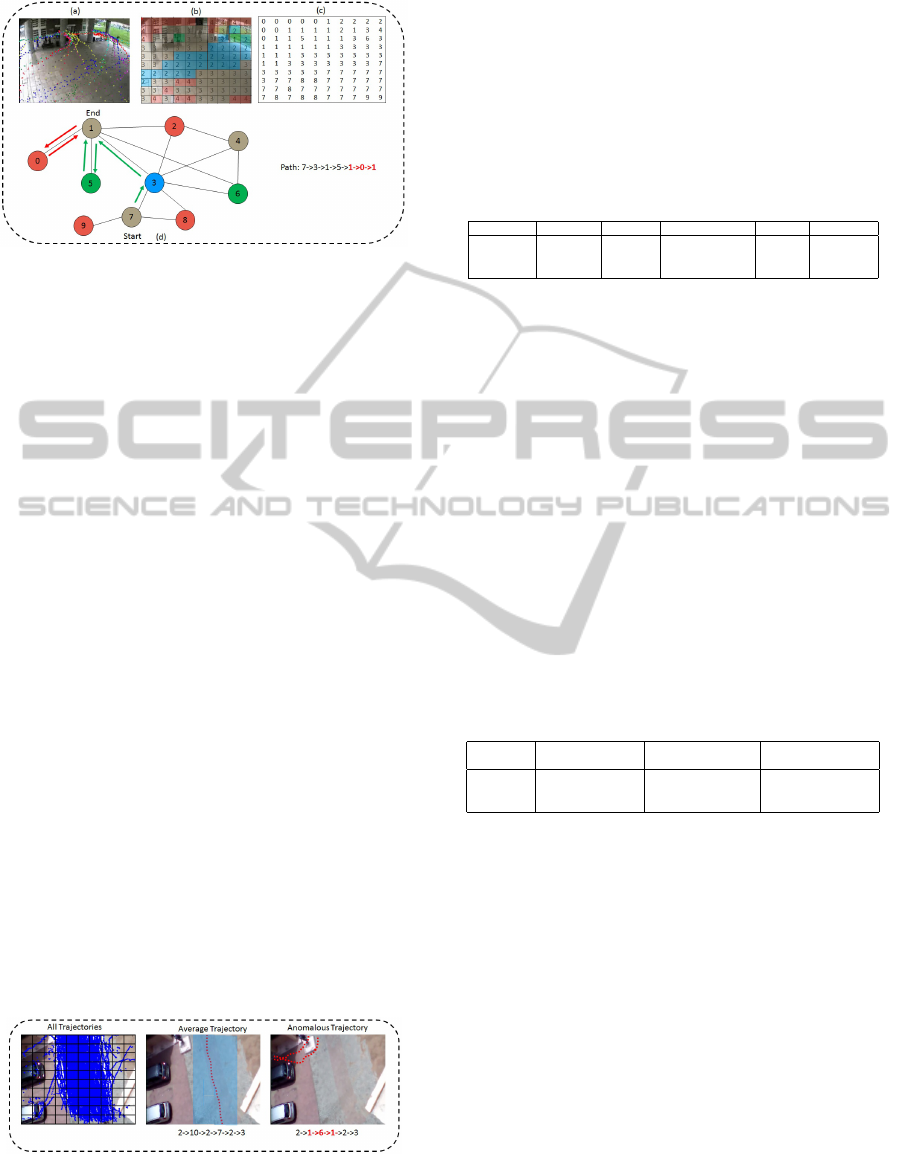
Figure 9: (a) Surveillance scene of the ViSOR dataset with
trajectories overlay (b) Segmentation of the scene with re-
spect to the labels of blocks (c) Distribution of nodes with
block labels (d) Final RAG with a anomalous path high-
lighted.
prescribed class labels, the distribution of graph
nodes, and the final RAG with a anomalous path
being highlighted. It can be observed that, the
path marked as 7 → 3 → 1 → 5 → 1 → 0 → 1 is
found to be anomalous due to the following invalid
”1 → 0 → 1” segment. Several other invalid segments
were detected from the set of test trajectories and
when compared, matched the ground truth.
As shown in Figures 7, 8, and 9, segments highlighted
as red are invalid regions and targets are not expected
to enter these regions under normal circumstances.
However, a target can visit any other region that is
marked as green, blue or grey as they represent re-
gions with lower importance. Table 2 summarizes the
performance of our algorithm against the chosen pub-
lic and in-house datasets. It may be observed from
the results that, the proposed anomalous activity de-
tection algorithm performs satisfactorily across vari-
ous datasets. However, because of false positives in-
troduced during recording of CAVIAR dataset videos,
our proposed algorithm over-segmented the scene and
marked more than three locations as interesting areas
which is untrue. If we observe the scene carefully, we
can determine that the reading desk and the ATM are
only interesting locations.
Figure 10: Comparison with baseline trajectory of In-
HOUSE dataset. The first image shows all trajectories plot-
ted on the scene, and the following two images shows the
average trajectory and an anomalous trajectory as per the
path highlighted in Figure 7.
Table 2: Detailed analysis of anomalous activity detection
results. 2
nd
and 3
rd
column present number of trajectories
used for evaluation. Numbers mentioned in second column
represent the number of trajectories used for constructing
the RAG (training phase) and these trajectories have not
been used for testing. Detection rate, precision and recall
values are computed against ground truths of the remain-
ing trajectories ( test). Every test trajectory was manually
classified either suspicious or normal through visual obser-
vations.
Dataset Training Testing Detection Rate Recall Precision
CAVIAR 10 4 50% 50% 100%
ViSOR 30 5 100% 100% 100%
In-House 170 22 83% 83% 100%
Finally, we present the results of a baseline technique
based on measuring the distance of the test trajectory
from the mean of training trajectories. In Figure 10,
mean of all training trajectories of In-HOUSE
dataset is presented. Corresponding path of the
mean trajectory with respect to the graph shown in
Figure 6 is also shown in the figure. Any motion
deviation within the shaded region around the average
trajectory is usually considered as non-suspicious
in the given context. However, it may be observed
that, the anomalous path shown in Figure 7 is quite
distinguishable from the mean path. Therefore, the
proposed structure represents the anomalous activity
in its true sense and hence is presumed to have the
potential to deliver robust abnormal behavioural
analysis in surveillance scenes.
Table 3: Computational performance of the proposed algo-
rithm on various datasets.
Dataset Number of Nodes Average Trajectory Time Taken (in sec)
in RAG Length
CAVIAR 14 262 0.103
ViSOR 10 23 0.0087
In-House 17 128 0.0422
Next, we present the computational complexity of the
proposed algorithm. The computational demand was
estimated in terms of time taken by the proposed al-
gorithm to process a given test trajectory. The results
of the computational complexity of our algorithm is
summarized in Table 3. It can be ovserved that, the
proposed detection algorithm runs in linear time. If
the number of nodes of a path increases, the execution
time also increases in a linear manner. Such trend is
quite natural to assume, since the RAG is represented
using the adjecency matrix. Thus, accessing a node
of the graph usually took constant time. Since the
graph itself was created offline, time complexity of
RAG construction was not considered in this analy-
sis.
SceneRepresentationandAnomalousActivityDetectionusingWeightedRegionAssociationGraph
111

5 CONCLUSIONS AND FUTURE
SCOPES
In this paper, we presented a technique for anoma-
lous activity detection using trajectory analysis. Our
technique is based on constructing a RAG using re-
gions from a scene segmented output obtained us-
ing a context-aware block labelling technique. De-
tection is accomplished by analysing a test trajectory
of the target against the RAG. The use of structured
RAG representation for anomalous activity detection
provides a scalable solution and one that is generic
to different unpredictable patterns of anomalous be-
haviour of targets. The results of our technique have
proven the capabilities of a graph theoretical approach
to anomalous activity detection and our performance
evaluation has indicated the superiority of our tech-
nique against other baselines on standard datasets.
Our focus for the future is to extend the proposed
technique to several other types of movements within
the surveillance context, for example, encircling a sin-
gle region, shuttling between a pair of regions, most
of all that can be regarded as anomalous.
REFERENCES
Antic, B. and Ommer, B. (2011). Video parsing for abnor-
mality detection. In Computer Vision (ICCV), 2011
IEEE International Conference on, pages 2415–2422.
Gowsikhaa, D., Abirami, S., and Baskaran, R. (2012). Au-
tomated human behavior analysis from surveillance
videos: a survey. Artificial Intelligence Review, pages
1–19.
Hamid, R., Johnson, A., Batta, S., Bobick, A., Isbell, C.,
and Coleman, G. (2005). Detection and explanation
of anomalous activities: representing activities as bags
of event n-grams. In Computer Vision and Pattern
Recognition, 2005. CVPR 2005. IEEE Computer So-
ciety Conference on, volume 1, pages 1031–1038 vol.
1.
Hospedales, T., Li, J., Gong, S., and Xiang, T. (2011). Iden-
tifying rare and subtle behaviors: A weakly super-
vised joint topic model. Pattern Analysis and Machine
Intelligence, IEEE Transactions on, 33(12):2451–
2464.
Kiryati, N., Raviv, T., Ivanchenko, Y., and Rochel, S.
(2008). Real-time abnormal motion detection in
surveillance video. In Pattern Recognition, 2008.
ICPR 2008. 19th International Conference on, pages
1–4.
Krishna, M. and Denzler, J. (2014). A combination of
generative and discriminative models for fast unsuper-
vised activity recognition from traffic scene videos. In
Applications of Computer Vision (WACV), 2014 IEEE
Winter Conference on, pages 640–645.
Krishna, M. V., Bodesheim, P., Krner, M., and Denzler, J.
(2014). Temporal video segmentation by event detec-
tion: A novelty detection approach. Pattern Recogni-
tion and Image Analysis, 24(2):243–255.
Kuettel, D., Breitenstein, M., Van Gool, L., and Ferrari, V.
(2010). What’s going on? discovering spatio-temporal
dependencies in dynamic scenes. In Computer Vision
and Pattern Recognition (CVPR), 2010 IEEE Confer-
ence on, pages 1951–1958.
Mahadevan, V., Li, W., Bhalodia, V., and Vasconcelos, N.
(2010). Anomaly detection in crowded scenes. In
Computer Vision and Pattern Recognition (CVPR),
2010 IEEE Conference on, pages 1975–1981.
Nater, F., Grabner, H., and Gool, L. V. (2011). Temporal
relations in videos for unsupervised activity analysis.
In British Machine Vision Conference.
Niu, W., Long, J., Han, D., and Wang, Y.-F. (2004). Human
activity detection and recognition for video surveil-
lance. In Multimedia and Expo, 2004. ICME ’04. 2004
IEEE International Conference on, volume 1, pages
719–722 Vol.1.
Ouivirach, K., Gharti, S., and Dailey, M. N. (2013). In-
cremental behavior modeling and suspicious activity
detection. Pattern Recognition, 46(3):671 – 680.
T. Dinh, N. V. and Medioni, G. (2011). Context tracker:
Exploring supporters and distracters in unconstrained
environments. In Computer Vision and Pattern Recog-
nition (CVPR), pages 1177–1184.
Takai, M. (2010). Detection of suspicious activity and esti-
mate of risk from human behavior shot by surveillance
camera. In Nature and Biologically Inspired Comput-
ing (NaBIC), 2010 Second World Congress on, pages
298–304.
Vezzani, R. and Cucchia, R. (2010). Video surveillance on-
line repository (visor): an integrated framework. Mul-
timedia Tools and Applications, 50(2):359–380.
Zhang, J. and Liu, Z. (2008). Detecting abnormal motion of
pedestrian in video. In Information and Automation,
2008. ICIA 2008. International Conference on, pages
81–85.
Zhao, B., Fei-Fei, L., and Xing, E. (2011). Online detec-
tion of unusual events in videos via dynamic sparse
coding. In Computer Vision and Pattern Recogni-
tion (CVPR), 2011 IEEE Conference on, pages 3313–
3320.
VISAPP2015-InternationalConferenceonComputerVisionTheoryandApplications
112
