
Robust and Fast Teat Detection and Tracking in Low-resolution Videos
for Automatic Milking Devices
Matthew van der Zwan and Alexandru Telea
Institute Johann Bernoulli, University of Groningen, Nijenborgh 9, Groningen, The Netherlands
Keywords:
Time-of-Flight Cameras, Video Tracking, Vision for Robotics, Automatic Milking Devices.
Abstract:
We present a system for detection and tracking of cow teats, as part of the construction of automatic milking
devices (AMDs) in the dairy industry. We detail algorithmic solutions for the robust detection and tracking of
teat tips in low-resolution video streams produced by embedded time-of-flight cameras, using a combination
of depth images and point-cloud data. We present a visual analysis tool for the validation and optimization
of the proposed techniques. Compared to existing state-of-the-art solutions, our method can robustly handle
occlusions, variable poses, and geometries of the tracked shape, and yields a correct tracking rate for over 90%
for tests involving real-world images obtained from an industrial AMD robot.
1 INTRODUCTION
Scale economies in the dairy industry increasingly
shift manual labor to robots. One such development
is the advent of automatic milking devices (AMDs):
Given a stable populated with cows, AMDs use vision
devices to locate cows in the stable, reach under the
cow e.g. with a mechanical arm, locate the udder and
teats, and finally track the teats in order to couple a
suction device to each teat to collect milk (LMI Tech-
nologies, 2012; Scott Milktech Ltd., 2013; MESA
Imaging, 2014; Westberg, 2009; Hunt, 2006).
Vision devices used in AMDs must be small,
shock-resistant, able to work in the dim lighting
of a stable, and relatively cheap (Westberg, 2009).
Separately, they have to operate in near-real-time to
cope with the cow’s motion, handle occlusions, lo-
cate features of interest with sub-centimeter preci-
sion, and work fully automatically. In recent years,
time-of-flight (ToF) range cameras have become in-
creasingly popular as the core building-block of such
systems (MESA Imaging, 2014; Scott Milktech Ltd.,
2013). Given a 3D scene, a ToF camera produces
a per-pixel depth map of the occluding surfaces
found in front of the camera, with a relatively high
frame-rate (24 frames per second (fps)). Compared
to traditional stereo vision (Hunt, 2006) or laser-
scanning (Hovinen et al., 2005) devices, ToF cam-
eras are less sensitive to lighting conditions and dust
specks, generate a full depth-map with depth data
at each pixel, are shock-resistant, come in compact
form-factors, need no delicate calibration, and pro-
vide many 3D vision functions in embedded soft-
ware (Dorrington et al., 2010; Distante et al., 2010).
Hence, high hopes are placed on using ToF cameras
in industrial AMD applications. However, their quite
low spatial resolution creates new challenges that are
not handled by mainstream vision algorithms.
We present a vision-based solution for AMD
robots built using ToF cameras. We focus on the
robust, accurate, automatic, and fast detection and
tracking of cow teats, i.e., the last step of the milk-
ing process. We present the entire pipeline from depth
image acquisition, feature extraction and filtering, and
udder tracking, and detail a simple and efficient im-
plementation. We show both qualitative and quantita-
tive validation of our system in an industrial context.
Section 2 overviews graphics and vision methods
relevant to our goal. Section 3 describes our solution.
Section 4 presents the results. Section 5 presents a vi-
sual analysis tool developed for validating the quality
of our tracking results. Section 6 concludes the paper.
2 RELATED WORK
We next overview computer vision methods for fea-
ture detection and tracking for natural deformable
moving objects. Given our application context, we
focus only on methods which can comply with all our
requirements: (1) automation, (2) low-cost, (3) ro-
520
van der Zwan M. and Telea A..
Robust and Fast Teat Detection and Tracking in Low-resolution Videos for Automatic Milking Devices.
DOI: 10.5220/0005299205200530
In Proceedings of the 10th International Conference on Computer Vision Theory and Applications (VISAPP-2015), pages 520-530
ISBN: 978-989-758-091-8
Copyright
c
2015 SCITEPRESS (Science and Technology Publications, Lda.)

bustness, (4) low computational complexity, and (5)
implementation simplicity.
Marker-based Tracking. A standard solution to 3D
shape tracking is to mark salient keypoints thereof
by textures which can be easily detected in a 2D
image. If correspondences can be robustly found
between stereo image pairs, stereo vision solutions
can then be used to compute 3D positions of such
fiducial marker-pairs by triangulation (Lazaros et al.,
2008). Marker-based solutions are fast, simple to im-
plement, and quite robust, but not applicable to our
context, as industry guidelines discourage the place-
ment of markers on cow teats. Monocular marker-
based tracking solutions also exist, but they are con-
siderably more complex and computationally expen-
sive for non-rigid, complicated, shapes (Agarwal and
Triggs, 2006; Sminchisescu and Triggs, 2001).
Marker-less Tracking. Marker-less tracking solu-
tions typically find keypoints at the naturally salient
image features (corners, edges, or edge crossings),
e.g. using SIFT (Lowe, 2004) and SURF (Baya
et al., 2008) descriptors. For very low-resolution
texture-less images, like our cow udders, the robust-
ness of such approaches is very low. Template-based
methods try to find pre-defined templates (small pre-
defined patterns) in the image, using statistical ap-
proaches such as correlation (Sussman and Wright,
1999). Deformable dynamic templates (DDTs) can
search for more complex configurations, by adapt-
ing a deformable template model to fit image silhou-
ettes (Yuille et al., 1992). However, DDTs require
well-chosen energy functions, initialization points,
and high-resolution images, and are too computation-
ally expensive for our real-time context.
3D Reconstruction. Having a ToF camera, one can
reconstruct the 3D visible-object surface from the
depth field, which comes as a 3D point cloud. From
this surface, teat tips can be found at maxima of mean
or Gaussian curvature, akin to polyp detection meth-
ods used in medical science, e.g. (Chen et al., 2009).
Yet, reconstructing clean, differentiable, 3D surfaces
from point clouds given by ToF cameras is challeng-
ing. Most existing surface reconstruction methods
have constraints on the sampling density, complexity,
connectivity, and water-tightness of the sampled sur-
face, and are also quite slow (Kazhdan et al., 2006;
Hoppe et al., 1992; Dey and Goswami, 2004; Dey
et al., 2009; Kustra et al., 2014). Also, such methods
cannot find features (like our cow teats) which are oc-
cluded in the input image.
Specific Solutions. Many techniques have been
proposed and fine-tuned to find and track features
in moving natural shapes such as humans or parts
thereof, e.g. faces or hands. However, such tech-
niques are not directly usable for cow udder mor-
phologies, as they have other shape priors. In the
milk industry, very few solutions exist and have been
implemented into AMD robots (LMI Technologies,
2012; Scott Milktech Ltd., 2013; MESA Imaging,
2014; Westberg, 2009; Hunt, 2006). All these solu-
tions assume a fully unoccluded and zoomed-in bot-
tom or side view of the udder, given by a fixed robot
arm that places the camera close to the udder, and
given a cow constrained in a small space, to limit mo-
tion. In contrast, we do not assume that our robot is
initially correctly placed close to the cow udder, nor
do we assume that the cow cannot move vs the robot.
3 METHOD
As input device, we use a SwissRanger SR4000 ToF
camera (Mesa Imaging, 2010), which has one of the
best quality-price ratios to date (Dorrington et al.,
2010; Distante et al., 2010). The camera gives a 24-
fps stream {I
i
}. Each frame I
i
has two 176×144 pixel
images (A
i
,D
i
). A
i
is a standard amplitude (lumi-
nance) image. D
i
is a depth map, where each pixel
stores the distance, in millimeters, to the closest oc-
cluding object, with an accuracy of a few millimeters
for distances up to roughly 1 meter. The camera also
delivers a point-cloud P
i
= {p
j
} with the world-space
locations of all visible-surface points in frame i. The
camera is rigidly mounted on a robot which can reach
the zone under the cow to be milked. As outlined
in Sec. 1, we focus on the milking stage, where the
camera is already under the cow, roughly between the
legs and looking towards the tail. The cow stands up-
right, so its legs and teats appear as vertically-oriented
shapes in the image (Fig. 2 a).
Our solution has two parts: A detection step finds
teats from the image-and-point-cloud {I
i
,P
i
} of the
current frame i. Next, a tracking step integrates this
data over time, handling occlusion and other model
priors (Fig. 1). The two steps are described below.
3.1 Detection
To find teats in the a frame I
i
, we can use one or sev-
eral of the fields A
i
, D
i
, and P
i
given by the camera.
After extensive studies, we found that our images A
i
are too low-contrast and noisy, due to poor lighting in
the stable. Hence, we use only the depth image D
i
and
point cloud P
i
for teat detection. As D
i
still contain a
small noise amount, caused by dust specks floating in
the stable, we first apply a median filter to them. The
filtered images
˜
D
i
are almost noise-free and show lit-
tle blurring (Fig. 2 b).
RobustandFastTeatDetectionandTrackinginLow-resolutionVideosforAutomaticMilkingDevices
521
Candidate
selection
TTS
estimation
TTS
optimization
candidate
match sets μ
i
candidate
TTS’s M
i
TTS M
i
j
j
optimal
TTS M
i
video
frame I
i
edge
image E
i
Template
matching
all matches
M
i
grouped
matches M
i
Time
filtering
stable
matches M
i
PCA
Anisotropy
estimation
Projection
+ meshing
Template
matching
point
cloud P
i
principal
components {e
i
,λ
i
}
j
j j
tubular
regions
region
2D projections
joint matches
M
i
Reinitialization
no matches
found
no candidates
found
no good-
quality TTS
freshly detected TTS M
i
Detection
Tracking
ToF
camera
Match
selection
Median
filtering
Edge
finding
depth
image D
i
~
PCA
matches
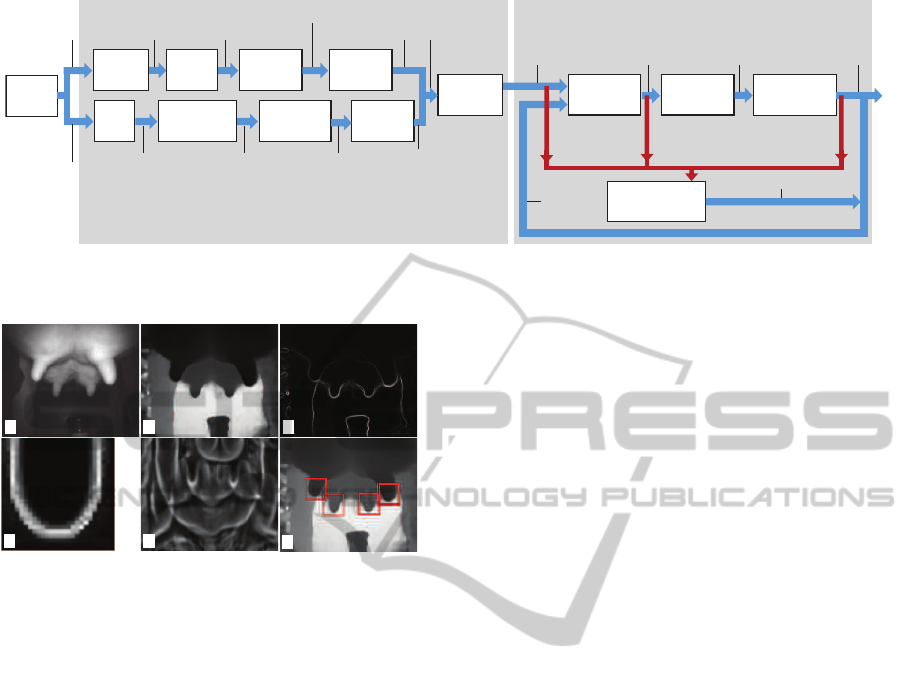
Figure 1: Teat detection-and-tracking pipeline. Blue arrows show data streams from the input data (ToF camera) to the output
of four tracked teats M
i
. Red arrows show the control-flow for tracking reinitialization (Sec. 3.2.5).
a
b
c
f
d e
Figure 2: A frame from a typical video sequence. (a) Am-
plitude image A, with visible udder and four teats. (b) Fil-
tered depth image
˜
D. (c) Edges E in depth image. (d)
Canonical template image T. (e) Correlation image C
i
. (f)
Matches found (Sec. 3.1.1).
We next propose two separate methods to find
teats from filtered depth images
˜
D
i
(Sec. 3.1.1) and
point clouds P
i
(Sec. 3.1.2) respectively.
3.1.1 Template-based Detection
Our first teat-detection method treats
˜
D
i
as regular
grayscale images. To find teats, we use a template-
matching technique consisting of four steps:
a. Edge Detection. First, we find edges in the depth
image
˜
D
i
, using a gradient-magnitude filter k∇
˜
D
i
k.
The result E
i
of this filter highights values where
˜
D
i
has strong jumps, which are the silhouettes of shapes
in our depth image. Figure 2c shows a typical edge-
image E
i
. Silhouettes of the cow teats and limbs are
clearly visible in this image.
b. Template Matching. To find teats, we use a
template-matching approach. For this, we first com-
pute the silhouette (edge-image) of a typical U-shape
of a teat. We call this image a template T (Fig. 2d).
Next, we use a normalized correlation coefficient
(NCC) approach (Sussman and Wright, 1999) to find
instances of T in the edge-image E
i
, by convolving
E
i
with T using the Fast Fourier Transform provided
by OpenCV (OpenCV, 2014). Besides speed, the ad-
vantage of NCC becomes apparent if we notice that
a teat could be close by in front of a leg, or far away
from the background (stable wall), resulting in edges
of highly different intensities. NCC efficiently cor-
rects for edge-intensity differences in both E
i
and T,
which matches our goal to capture the shape of ob-
jects described by the edges, rather than objects’ rela-
tive positions with respect to the background.
The NCC computation yields a correlation image
C
i
where each pixel C
i
(x,y) ∈ [0,1] tells how well T
matches the edge-image E
i
at (x,y), with higher val-
ues encoding better matches (Fig. 2e). Maxima of C
i
are regions where T matches best. Thus, we can find
potential teat locations, or matches t
i
, by finding the N
largest local maxima of C
i
. For all our tests, we fixed
N = 6. We also tried the option of upper-thresholding
C
i
with a fixed value. However, this yielded between
none and tens of matches per image C
i
, so we prefer
the first approach (N-best selection). For each match
t
i
= (x,y,z)
i
, we store its 2D position x
i
,y
i
in image-
space, and also its depth from camera z
i
.
The above template matching method is not scale-
invariant – it only finds areas in C
i
which match the
template T at T’s own scale. Figure 3a shows this:
Here, we miss the front-right teat, which is about
twice larger than the template. Still, the range of teat
sizes (in image-space) is bounded by the fixed size
of the cow and the positioning of the robot which is
never more than 1.5 meters away from the udder. An-
alyzing several production videos, we determined that
teats range between 1/30 and 1/6 of the image-width,
i.e. between T
min
= 10 and T
max
= 30 pixels. To find
teats in this scale-range, we use the NCC method de-
scribed above with six template sizes T
i
, 1 ≤ i ≤ 6,
uniformly distributed between T
min
and T
max
. This en-
ables us to find small and large teats (Fig. 3b).
c. Match Selection. We next collect all matches
t
i
from all different scales T
j
, after which we apply
the N-best selection procedure outlined above for the
VISAPP2015-InternationalConferenceonComputerVisionTheoryandApplications
522
a b c
d
FP
FP
FP
FP
FP
FP
FP
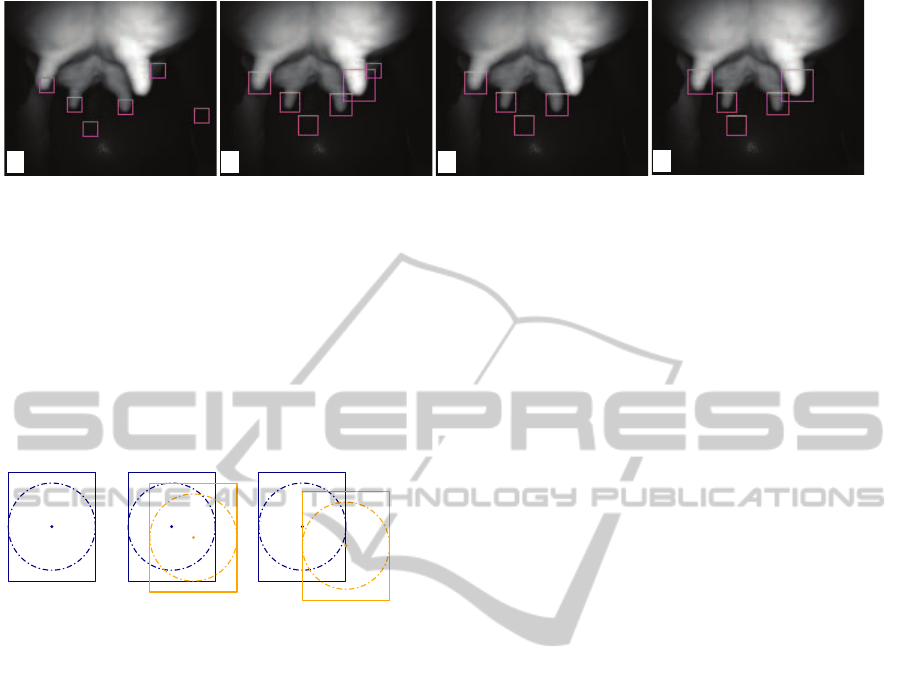
Figure 3: Single-scale (a) vs multiscale matching without time filtering (b). Multiscale matching with time filtering for two
consecutive frames (c,d). Matches are indicated by rectangles, with ‘FP’ showing false-positives. Red-marked FP’s are
removed by time filtering.
single-scale case. When using multiple scales, we can
find two (or more) matches t
i
and t
j
, for two scales
T
a
and T
b
, whose 2D positions (x
i
,y
i
) and (x
j
,y
j
) are
close enough to represent the same teat. We consider
such matches to be duplicates when the center of the
inscribed circle in T
i
falls in the inscribed circle of T
j
or vice versa (Fig. 4). From any set of duplicates, we
only keep a single match for further processing.
(a) (b) (c)
Figure 4: Template overlap. (a) Canonical template, with its
inscribed circle and circle-center. (b) Two overlapping tem-
plates. (c) Two non-overlapping templates (see Sec. 3.1.1).
d. Match Time Filtering. Our teat-detection can
find a teat where none actually exists. These are areas
where the edge-structurein E
i
has U-shapes similar to
our templates, e.g. aroundthe cow’s tail-tip, or around
some leg muscle structures. We call these false posi-
tives (FPs). Many such FPs appear only for a very few
consecutive frames. In contrast, true positives (TPs)
are visible for longer periods, until they get occluded
or drift out of the camera view. We remove FPs by
time filtering, as follows. Let M
i
= {t
j
} be the set of
matches found in frame i of our input stream. Given
the sequence {M
k
}
i−K<k<i
of matches found in the
previous K frames, we remove from M
i
those matches
which are not visible in at least τ of the last K frames.
This means that we have a delay (of K frames) in de-
tecting teats. Choosing a low value for K keeps this
delay small, as our camera operates at 24 fps. Fixing
K = 5 and τ = 2 frames effectively removed most FPs
while keeping most TPs. Figure 3 shows this. The
three FP matches marked red in images (a,b) are re-
moved in image (c) by time filtering. The remaining
FP, marked green, which corresponds to the cow tail,
is however not removed, as this structure persists in
several frames. We show next in Sec. 3.2 how such
remaining FPs are removed by using tracking.
3.1.2 PCA Based Detection
The template-based method described above works
well when teats are roughly vertical and parallel to the
camera plane, i.e., when the angle α between a teat’s
symmetry-axis and the camera plane is below roughly
10
◦
. For such angles, the difference between the edge
profiles of the vertically-aligned U structures in our
templates T
i
and those of actual teats in E
i
is small
enough to yield strong matches.
For larger angles α, template matching has diffi-
culties. In such cases, the teats’ silhouettes in E
i
dif-
fer too much from the ones in our templates. We find
two sub-cases here. First, a teat could be rotated into
the camera-plane. To address this, we could use a
solution akin to the one dealing with scale-variance
(Sec. 3.1.1), i.e., create a family of templates T
rot
i
ro-
tated in the camera plane. The second case occurs
when teats are rotated out of the camera plane (see
e.g. the two front teats in Fig. 5a). In such cases, the
teat silhouette changes from a U-shape to an ellipse or
parabola sector. We verified that rotation invariance
cannot be dealt with in this case by using additional
templates, as such shapes have too high an edge vari-
ability in the depth image.
We propose next a method to handle both rota-
tion variance cases. Teats have a roughly cylindri-
cal shape, which means that locally there is a clearly-
oriented structure in the depth-image data. This struc-
ture can be lost in the projected edge image. To
find such structures, consider a ball B of fixed radius,
roughly 4 cm in world space, corresponding to the
average half-length of a cow teat. We next center B
consecutively at all locations p
i
of the point cloud P
i
delivered by the ToF camera, and compute the eigen-
vectors e
j
i
, 1 ≤ j ≤ 3, and corresponding eigenvalues
λ
1
i
≥ λ
2
i
≥ λ
3
i
of the covariance matrix of all points in
P
i
∩B. Figure 5b illustrates this, by showing the direc-
tion of the major eigenvector e
1
i
by color coding – red,
green, and blue show eigenvectors e
1
i
aligned with
RobustandFastTeatDetectionandTrackinginLow-resolutionVideosforAutomaticMilkingDevices
523
a b c
e
d
f
A
e
2
e
1
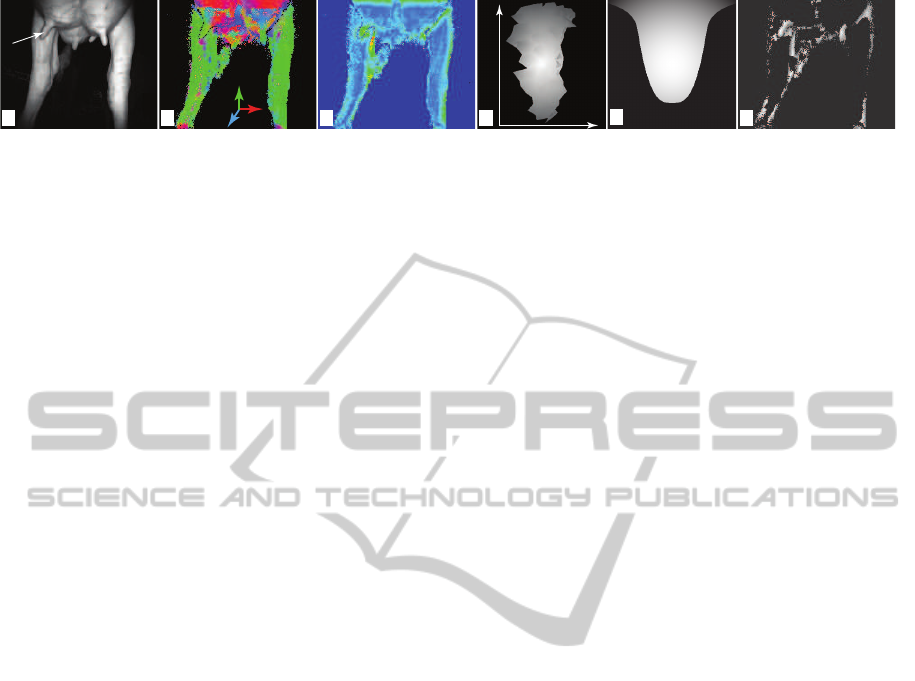
Figure 5: PCA-based detection. (a) Amplitude image. (b) Major eigenvector direction. (c) Elongation values. (d) 2D projected
neighborhood of point ‘A’ in the first image. (e) Template used for matching. (f) Correlation image (Sec. 3.1.2).
the x, y, and z axes respectively. Next, we find tube-
shaped regions P
i
∩ B by computing the so-called lin-
ear anisotropy or elongation c = λ
1
i
/λ
2
i
(Westin et al.,
1997), and selecting only regions for which c > 1.5.
These are potential teat locations. Figure 5c shows
the elongation c with a rainbow colormap (blue=low,
green=medium, red=high values). As visible, areas
around teats are green, as they have a quite high elon-
gation. Finally, we project such regions onto the plane
defined by (e
1
i
,e
2
i
). If a teat exists around p
i
, e
1
i
should
match its symmetry axis (given the teat’s cylindrical
shape), so the resulting 2D projection should show a
vertical teat shape, like the ones in our templates. This
corrects for the rotational variance. Additionally, we
scale the 2D projection by the value of λ
1
i
divided by
the height of the template T, which takes care of the
scale variance. As such, we can now directly use our
single-scale template matching to find rotationally-
invariant teat matches in the projected images.
Given camera resolution limitations, the 2D pro-
jections of cloud points P
i
∩ B can yield very sparse
point sets. To match these with a teat shape, we need
a compact image. To create this, we render a quad
mesh with points P
i
∩ B as vertices and connectivity
given by the raster structure of I
i
. Mesh vertices are
colored by their depth to the projection plane. Fig-
ure 5d shows such a 2D projection for the neighbor-
hood P
i
∩ A around point A in Fig. 5a. Such images
typically havejagged edges, given (again) the low res-
olution of our cloud P
i
clipped by the ball B. Com-
puting edges on such images yields a high amount of
noise, which makes our edge-template matching not
robust. We solve this by a template matching using
the full image of a teat, where pixel grayscale val-
ues indicate depth (Fig. 5e). The correlation result
(Fig. 5f) emphasizes elongated regions whose max-
ima correctly capture positions of rotated teats.
Matches found by PCA detection are merged
with the ones given by the template-based detection
(Sec. 3.1.1) to yield the final match-set M
i
. This way,
we increase the chances of capturing all matches in a
single image. We next use this joint match-set M
i
to
robustly detect and track all four teats.
3.2 Tracking
Our teat detection technique (Sec.3.1) successfully
finds about 90% of the visible teat tips in our typi-
cal videos. Yet, detection still suffers from two main
problems:
Occlusion. In frames where one or more teats are
occluded from the camera viewpoint( by cow limbs,
other teats or robot parts), detection obviously fails to
find such teats. As our AMD robot needs finding all
teats in each frame to start the milking process, we
must locate occluded teats too.
Robustness. Even for frames with no apparent teat
occlusion, two additional teat detection problems ex-
ist. First, certain teat configurations are not de-
tectable, due to resolution limitations of the ToF cam-
era. We call these false negatives (FNs). Some FNs
can be removed by relaxing the detection method’s
parameters, to accept more image structures as teats.
However, this makes detection sensitive to small-
scale noise, which next creates matches at spurious
image locations, i.e., yields unwanted false positives
(FPs).
To reduce the amount of FPs and FNs described
above, we need to use additional information not
present in single video frames. For this, we choose
a model-based approach: We define a parameterized
model that describes the intrinsic variability (priors)
of shape, size, orientation, and dynamics (change in
time) of the entire set of four teats that a typical cow
has. At frame i, this set of teats, called the tracked
teat-set (TTS), is a quadrilateral M
i
= {p
j
∈ R
3
},
1 ≤ j ≤ 4, whose vertices p
j
are ordered counter-
clockwise with p
0
being the near-left teat from the
camera viewpoint. To compute M
i
, we use a track-
ing procedure that fits the TTS M
i−1
computed from
frame i − 1 to the match-set M
i
detected in the cur-
rent frame i, subject to our model’s geometric and
dynamic constraints. Figure 6 shows the TTS quad
tracked in three frames in a video of several minutes.
Our tracking proposal is detailed next.
3.2.1 Candidate Matches
Key to tracking is finding how vertices of the TTS
M
i−1
from the previous frame correspond to teat-
VISAPP2015-InternationalConferenceonComputerVisionTheoryandApplications
524

a
b
c
frame 36 frame 191 frame 341
Figure 6: Three frames from a tracking sequence with
matches shown as rectangles and TTS shown as a 3D quad
(see Sec. 3.2).
matches in M
i
found in the current frame. To find
these correspondences, we first construct a collection
S = {µ
j
i
}
j
of all candidate-match sets µ
j
i
⊂ M
i
each
having between one and four matches as elements.
We sort this sequence decreasingly on the number of
elements |µ
j
i
| in each candidate-match set (CMS), and
then try to construct a candidate TTS M
j
i
from each
such µ
j
i
, in increasing j order. This ordering models
our preference to fit our TTS to more, rather than to
fewer, matches in the current frame, so as to use most
of the information present in that frame.
3.2.2 Correspondence Finding
Given a CMS µ
j
i
, we find its point-to-point correspon-
dence with the previous TTS M
i−1
as the set of point-
pairs {(q
k
∈ µ
j
i
,p
i−1
k
∈ M
i−1
)}, 1 ≤ k ≤ |µ
j
i
|, which
minimize the metric
E
motion
=
1
|µ
j
i
|
|µ
j
i
|
∑
k=0
kq
k
− p
i−1
k
k,
where k·k is the Euclidean distance in R
3
. Intuitively,
E
motion
captures the amount of motion between M
i−1
and M
i
. Since the cow stays relatively still during
milking, the robot movesslowly, and our camera has a
high frame-rate, teats cannot ‘jump’ from one place to
another one between consecutive frames. Hence, for
a CMS µ
j
i
to be valid, it has to yield a small value for
E
motion
. In practice, we allow only values E
motion
< 25
mm.
3.2.3 TTS Estimation
From each CMS µ
j
i
given by correspondence find-
ing, we build a potential new TTS M
j
i
for the current
frame i: For all points q
k
∈ µ
j
i
which have a corre-
spondence to a TTS-quad vertex p
i−1
k
∈ M
i−1
, we set
the new value of p
i
k
∈ M
i
to q
k
. For all other ver-
tices p
i
k
∈ M
j
i
which have no correspondences in µ
j
i
,
a situation which occurs when |µ
j
i
| < 4, we compute
their values by translating their corresponding points
p
i−1
k
∈ M
i−1
with the average translation vector
v =
1
|µ
j
i
|
|µ
j
i
|
∑
k=0
q
k
− p
k
.
3.2.4 TTS Optimization
The previous step delivers as many potential TTS
models M
j
i
as the number k Sk of CMS configura-
tions. These are all possible TTS models which can
be built by using one or several matches in M
i
. We
select the best such TTS as the optimal TTS with re-
spect to three metrics which describe geometric con-
straints observed by watching videos of actual cows
during milking, as described below. Let us stress here
that we are not searching for an absolute minimum of
these metrics, but for a ‘best fit’, i.e., a TTS which
optimizes these metrics over all possible TTSs.
Shape. During milking, the soft udder shape changes
as the cow moves. Yet, the relative teat positions are
quite stable. Thus, the shape of our quad M
j
i
should
be constrained. While this is partly done by the mo-
tion constraint E
motion
, that allows teats to move only
slightly, an accumulation of such small movements
over hundreds of frames can yield very different quad
shapes. We thus further constrain the quad shape
by constraining its area. We could have used other
shape metrics here, e.g. the quad’s aspect ratio. How-
ever, the area constraint performs much better during
the tracking-initialization stage (see next Sec. 3.2.5).
We model the area constraint by the difference be-
tween the actual quad-area and the expected quad-
area A
expected
as
E
shape
=
|A(M
j
i
) − A
expected
|
A
expected
.
Here, A
expected
is a fixed value, computed from actual
udder measurements of the cows under analysis. Set-
ting A
expected
has to be done only once, before the first
time the cow is milked, and can be re-used for subse-
quent milking.
Flatness. We also observed that teat tips stay roughly
in the same plane. We therefore want the same to
hold for the vertices of the quad M
j
i
. We model this
by checking how close each vertex p
k
∈ M
j
i
is to the
plane formed by the other three vertices, i.e. by the
metric
E
flatness
=
1
4
4
∑
k=0
|n
k
· v
k
|.
Here, n
k
is the normal of the plane through all quad
points except p
k
, and v
k
is the normalized vector from
any point p
l6=k
to p
k
. When our quad is flat, every p
k
lies in the same plane as the other points p
l6=k
, so n
k
RobustandFastTeatDetectionandTrackinginLow-resolutionVideosforAutomaticMilkingDevices
525

and v
k
are orthogonal to each other, thus E
flatness
= 0.
Higher values of E
flatness
> 0 tell that p
k
do not all lie
in the same plane. In particular, note that configura-
tions that include an incorrectly detected point on the
cow’s tail yield a high E
flatness
, thus are not favored
by this metric.
Orientation. Finally, we note that teat tips are in a
plane roughly parallel to the ground surface on which
the cow stands. We encode this prior by measur-
ing the orientation-deviationbetween the quad vertex-
normals n
k
, computed as for the flatness criterion, and
the vertical direction u, by
E
orient
=
1
4
4
∑
k=0
|1− n
k
· u|.
In the ideal case, all normals n
k
are parallel to u, so
E
orient
= 0. Values E
orient
> 0 indicate deviationsfrom
the desired orientation. Similar to the flatness met-
ric, the orientation metric typically produces higher
values for incorrectly oriented vertices and therefore
also favors the correctly oriented configurations, even
when the corresponding value for E
orient
is not opti-
mal in an absolute sense.
To jointly optimize for TTS shape, flatness, and
orientation, we use the total geometric error
E
geom
= w
shape
·E
shape
+w
flatness
·E
flatness
+w
orient
·E
orient
where the weights w sum up to 1. The first TTS M
j
i
,
in the testing order given by CMS finding (Sec. 3.2.1),
that scores E
total
< ε, is considered a good-enough fit,
and yields the new value for the TTS M
i
for the cur-
rent frame i. Here, we use ε =
1
3
, meaning that only
one of the three error metrics can be at its acceptable
maximum, while all other error metrics should be zero
for us to accept this configuration.
3.2.5 Initialization
To start tracking, we must initialize our TTS M .
Also, re-initialization is needed when we cannot track
M
i−1
to the current frame i. This happens when (a)
the current match-set M
i
is empty, e.g. due to a bad
camera angle, too large distance to the cow, complete
occlusion of teats in frame i, or limitations of our teat-
detection algorithm; (b) no correspondence between
M
i−1
and M
i
exists which satisfies the motion con-
straint E
motion
(Sec. 3.2.2), e.g. because of accidental
robot jumps due to collisions with the cow; (c) no can-
didate TTS M
j
i
having a sufficiently good geometry
E
geom
is found, e.g. due to the same reasons as for (a).
In all such cases, we must build M
i
afresh, using
only data from M
i
. For this, we first find all CMS sets
µ
j
i
having at least three points, by the same method
as for tracking (Sec. 3.2.2). We regard each µ
j
i
as a
potential TTS M
j
i
, and compute its E
geom
. The TTS
yielding a minimal E
geom
value below our threshold ε
becomes our new M
i
. If no such TTS is found, we set
M
i
= ∅, i.e. mark that tracking is lost in the current
frame, and try to re-initialize in the next frame.
Let us further detail the difference between track-
ing and initialization. During tracking, we optimize
for the TTS that (a) fits the most matches found in
the current frame, (b) has the best geometric quality,
and (c) has a small motion with respect to the previous
TTS. In contrast, at initialization we only optimize for
geometric quality and number of matches. Indeed, we
cannot optimize for motion, since the previous valid
TTS may haveoccurred many frames ago or there was
no such TTS (at the video stream start). To track, we
only need a single valid match in each frame. For
initialization, we need minimally three valid matches
in a frame (to be able to evaluate the geometric con-
straints). As we shall see in Sec. 5, our tracking is ro-
bust enough to require re-initialization only very sel-
domly, and thus deliver a high overall quality of the
proposed solution.
4 RESULTS
Our tracking-and-detection system, implemented in
unoptimized C#, achieves tracking at 4. ..8 fps on a
3.0 GHz Windows PC for an input video stream pro-
vided by the SR4000 API. For an image resolution
of N pixels, both computational and memory com-
plexities of detection are O(N); for tracking, these are
both O(1), since the match-set sizes are not a func-
tion of the image size. This strongly suggests that an
optimized implementation, e.g. in embedded C, can
run at real-time rates on a low-cost ARM processor
such as available on the milking robot, which sup-
ports our claims for practical industrial applicability
and low cost.
Figure 7 shows the interaction between detection
and tracking by showing the TTS results for 3 se-
quential frames selected from a longer video. The
first frame (a) is an initialization frame. Here, five
matches are found (red rectangles). Of these, the cor-
rect four correspondingto teats are selected by the ini-
tialization procedure (Sec. 3.2.5) to create the current
TTS M
a
, as using any of the other two false-positives
would create tilted quads which yield a high error
E
geom
. The obtained TTS is shown in Fig. 7d atop
of a rendering of the point cloud zoomed in on the
udder area. As can be seen, the TTS approximates the
actual teat positions quite well. In the second frame
(Fig. 7b), we find only three true-positive matches on
VISAPP2015-InternationalConferenceonComputerVisionTheoryandApplications
526
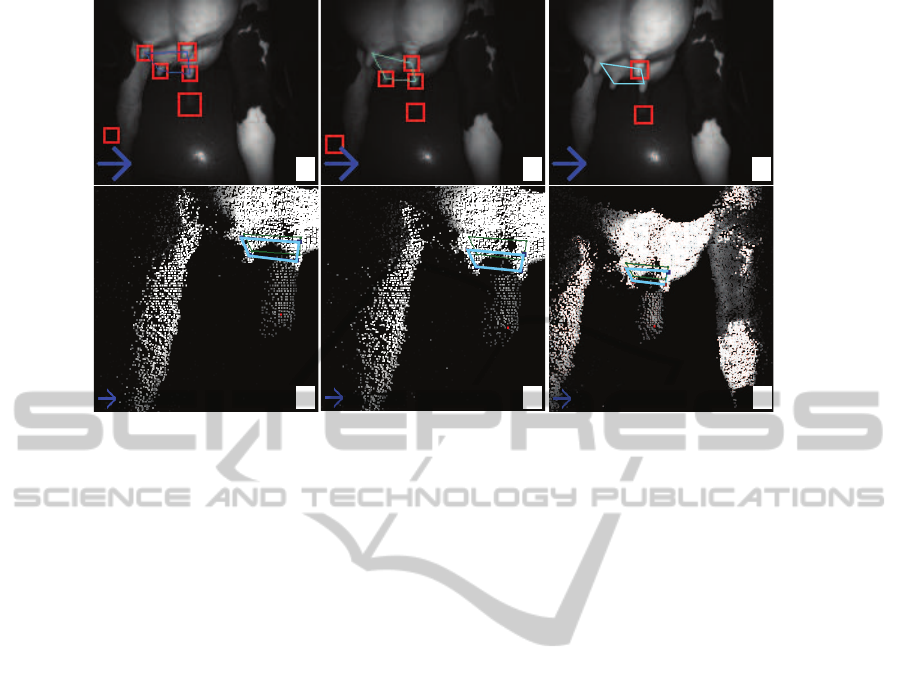
a b c
d e f
Figure 7: Tracking sequence, 3 consecutive frames. Top row: amplitude images, with matches shown. Bottom row: zoom-in
on the point cloud around the tracked TTS. The blue arrow icon shows that the system is successfully tracking (Sec. 4).
the teats, and two false-positives. However, as seen in
the corresponding cloud rendering (Fig. 7e), tracking
correctly estimates the position of the fourth teat. In
the final image, we only detect one true-positive and
one false-positive (Fig. 7c). Here again, the tracking
succeeds in creating the correct TTS (Fig. 7f).
5 QUALITY ANALYSIS
Analyzing the full tracking process is crucial to vali-
date the robustness and correctness of our proposed
solution. The video data we use is unlabeled, i.e.,
has no ground-truth for the correct teat positions. La-
beling it would cost a huge effort (manually marking
3D teat positions in thousands of frames for several
videos). Thus, we base our validation on (a) the vi-
sual inspection of the tracked teat-set M (Sec. 3.2),
and (b) on a data-analysis tool for the tracking pro-
cess. This analysis tool was crucial in helping us find
an optimal set of parameters, metrics, and heuristics
for our problem. The analysis tool is described below.
During tracking, we record all computed infor-
mation: input and derived images, match locations,
tracked teat positions, error metrics, and system state
(tracking, initializing, or tracking lost). Our analysis
tool next aims to show such data to (a) allow valida-
tion of the tracking quality; and (b) help finding rea-
sons for sub-optimal tracking, potentially leading to
algorithm and parameter improvements.
Our analysis tool consists of several linked views
(Fig. 8). Its set-up follows the overview and
details-on-demand design common for visual analyt-
ics tools (Shneiderman, 1996), showing both overall
tracking performance, but also finer-level details that
explain this performance. The analysis tool is con-
nected in a feedback loop with detection-and-tracking
(Secs. 3.1,3.2) so that the analyst can spot sub-optimal
results in the overview, examine details to find their
causes, adjust the responsible algorithm parameters,
see the effects (e.g. improvements), and repeat the
process until an optimal algorithm and parameter-set
is found.
We next detail the views of our analysis tool.
The model state view shows a timeline overview
of the TTS model state (initializing, tracking, or
tracking lost). States are shown by color-coded
bars – blue=tracking, yellow=re-initialization, and
red=tracking lost. This gives an easy-to-follow global
overview of the entire tracking process, and allows
quickly spotting frames whose state changes from
neighbor frames, e.g. frames where tracking fails
and which occur in a sequence of correctly tracked
frames. After spotting such frames, we can use the
views described next to find causes of the respective
state-change.
The tracking view refines the overview informa-
tion from the model state view by showing graphs
of all model variables as functions of time. Correlat-
ing values of these signals with state values (or state
changes) in the model view allows tracing back the
cause of the respective states one step back, i.e., to
the components of the error metrics E
geom
or E
motion
(Sec. 3.2). For instance, in the model-state view in
Fig. 8, we see a suspiciously large amount of red
(tracking lost) frames. At first sight, this suggests that
RobustandFastTeatDetectionandTrackinginLow-resolutionVideosforAutomaticMilkingDevices
527
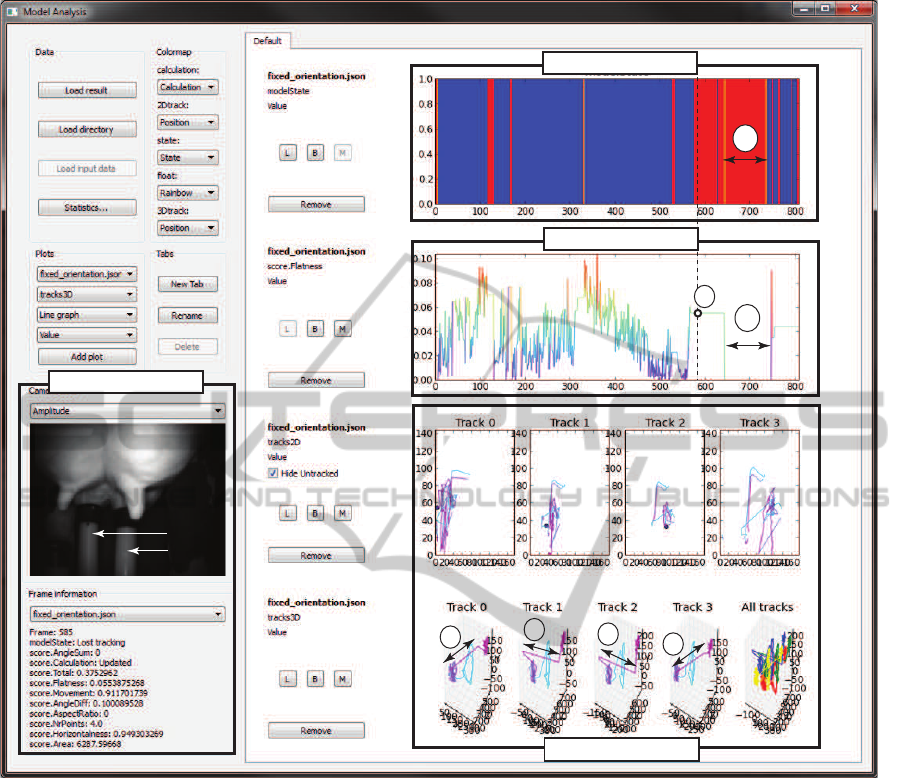
Model state view
Tracking view
TTS view
Frame data view
A
A
B
B
B
B
C
suction
cups
Figure 8: Visual analysis tool for our teat detection-and-tracking system, having three overview views (model state, tracking
view, and TTS view) and one detail view (frame data). All views are linked by interaction (Sec. 5).
our tracking is not working optimally. Let us focus on
the largest red block, marked A in Fig. 8. We see that
this block correlates to a zero value for the E
flatness
metric (Eqn. 3.2.4) in the tracking view. This tells
us that tracking is lost because this metric had a too
large value, which in turn caused E
geom
to exceed the
allowed threshold ε. Showing other model variables
in the same view allows back-tracing the cause of a
large E
flatness
error to earlier data, such as the number
and locations of found matches. Using this procedure,
we found out that, for the time-range of block A, the
cause was that there were no correct matches found in
the image, due to the robot drifting out of the udder
area. As we expect tracking to be lost in such cases,
this does not flag a problem of our tracker, but of the
robot’s steering.
The TTS view shows the trajectories of the four
tracked teats over the entire analyzed video, both as
2D camera-view projections (TTS view, top images)
and also as 3D world space positions (TTS view, bot-
tom images). Given the assumed smooth motion of
both the tracked shape (cow) and camera (robot), such
trajectories should be smooth curves. Also, these
curves should have a relatively similar overall shape,
given the geometric constraint that limits the relative
motion of teats from each other (Sec. 3.2.4). Spotting
large line-segment jumps in the TTS view allows us
to find time-ranges when tracking performed incor-
rectly. Such a jump is marked B in the figure, and
is visible for all four teats. Clicking on such a jump
brings the data for the respective time moment(s) in
focus in the other views. The current time is shown
in the tracking view by the dot marker labeled C. We
now see that this moment corresponds to the begin-
VISAPP2015-InternationalConferenceonComputerVisionTheoryandApplications
528

ning of the first large red block in the tracking view.
Hence, we knowthat the jump is caused by a tracking-
lost event (which is expected and correct). If, how-
ever, the jump corresponded to a tracking state (blue
in the model state view), this would have shown se-
vere tracking problems, as the tracking would have
created jumps (not in line with our knowledge of the
studied phenomenon) and would have marked these
as valid tracked frames.
The frame data view shows the amplitude, depth,
and point cloud data acquired from the ToF camera
for the frame selected in the other views, as well as
numerical statistics on this frame (number of matches
and values of the model metrics). These ‘details on
demand’ allow refining the insight obtained from the
overviews. All views are linked by interactive selec-
tion – clicking on a time-instant or position in the
overviews shows details of the selected frame in the
frame data view. For instance, the frame data in Fig. 7
corresponds to the moment C discussed above. As
visible in the amplitude image, the two back teats
are now connected to the suction cups of the milk-
ing robot. In such cases, tracking is expected to be
lost (due to the robot being too close to the udder).
Hence, we have explained that the tracking-lost event
observed in the TTS and model-state views is ex-
pected and not due to a tracker problem.
The analysis tool allows browsing a video both
frame by frame or playing it in real-time, so that
correlations between tracking performance and algo-
rithm variables can be easily seen. Using this tool, we
have been able to refine our proposed detection-and-
tracking algorithms, fine-tune their parameters, and
also validate the end-to-end tracking performance of
our system. Overall, we have tested over 15 real-life
videos of several minutes each acquired in actual sta-
bles in a production-process environment, that cover
a wide range of camera-to-subject distances, angles,
and motion paths. Average tracking performance
amounts to over 90% of the frames being success-
fully tracked. This clearly exceeds the documented
performance of comparable systems (LMI Technolo-
gies, 2012; Scott Milktech Ltd., 2013; MESA Imag-
ing, 2014; Westberg, 2009; Hunt, 2006).
6 CONCLUSIONS
We present an end-to-end system for the detection of
cow teats for automatic milking devices (AMDs) in
the milk industry. We present several techniques and
algorithms that make this detection robust and fully
automated when using a very low resolution time-of-
flight camera, which renders classical computer vi-
sion algorithms not applicable. By combining depth
and point cloud information analysis with observed
model priors, we achieve a simple and robust imple-
mentation that can successfully track over 90% of the
frames present in typical AMD videos, which exceeds
the performance of all known competitive solutions
in the area. In contrast to these solutions, our pro-
posal is also fully automated, allows large relative
camera-subject motions and orientation changes, and
accounts for occlusions. We present a visual analytics
tool that allows tracker refinement and result valida-
tion.
Several extension directions are possible. Differ-
ent teat detectors can be designed to find teats more
accurately under extreme zoom-out conditions, e.g.
based on 3D template matching. Secondly, using a
more complex model including both teats and udder
shape should render our tracking performance even
higher in contexts of high occlusion. Such refine-
ments will lead to a more effective solution for the
next generation of AMD robots for the dairy industry.
REFERENCES
Agarwal, A. and Triggs, B. (2006). Recovering 3D hu-
man pose from monocular images. IEEE TPAMI,
28(1):44–58.
Baya, H., Essa, A., Tuytelaars, T., and Gool, L. V. (2008).
Speeded up robust features. CVIU, 110(3):346–359.
Chen, D., Farag, A., Falk, R., and Dryden, G. (2009). A
variational framework for 3D colonic polyp visualiza-
tion in virtual colonoscopy. In Proc. IEEE ICIP, pages
2617–2620.
Dey, T. and Goswami, S. (2004). Provable surface recon-
struction from noisy samples. In Proc. SCG, pages
428–438.
Dey, T., Li, K., Ramos, E., and Wenger, R. (2009). Isotopic
reconstruction of surfaces with boundaries. CGF,
28(5):1371–1382.
Distante, C., Diraco, G., and Leone, A. (2010). Active range
imaging dataset for indoor surveillance. Ann. BMVA,
21(3):1–16.
Dorrington, A., Payne, A., and Cree, M. (2010). An
evaluation of time-of-flight range cameras for close
range metrology applications. ISPRS J. Photogramm.,
38(5):201–206.
Hoppe, H., DeRose, T., Duchamp, T., McDonald, J., and
Stuetzle, W. (1992). Surface reconstruction from un-
organized points. Proc. ACM SIGGRAPH, 26(2):71–
78.
Hovinen, M., Aisla, A., and Py¨or¨al¨a, S. (2005). Visual de-
tection of technical success and effectiveness of teat
cleaning in two automatic milking systems. J. Dairy
Sci., (88):3354–3362.
Hunt, A. (2006). Teat detection for an auto-
matic milking system. In MSc thesis, Univ.
RobustandFastTeatDetectionandTrackinginLow-resolutionVideosforAutomaticMilkingDevices
529

of Dublin, Ireland. doras.dcu.ie/17194/1/
aidan
hunt duffy 20120703135817.pdf.
Kazhdan, M., Bolitho, M., and Hoppe, H. (2006). Poisson
surface reconstruction. In Proc. SGP, pages 61–70.
Kustra, J., Jalba, A., and Telea, A. (2014). Robust segmen-
tation of multiple intersecting manifolds from unori-
ented noisy point clouds. CGF, 33(1):73–87.
Lazaros, N., Sirakoulis, G., and Gasteratos, A. (2008). Re-
view of stereo vision algorithms: From software to
hardware. Int. J. Optomechatronics, 2:435–462.
LMI Technologies (2012). Time of flight imaging enables
automated milking. www.lmi3d.com.
Lowe, D. (2004). Distinctive image features from scale-
invariant keypoints. IJCV, 60(2):91–110.
Mesa Imaging (2010). SR4000 user manual. www.mesa-
imaging.ch/prodview4k.php.
MESA Imaging (2014). Automatic milking sys-
tems. www.mesa-imaging.ch/applications/
automatic-milking-systems.
OpenCV (2014). OpenCV library. www.opencv.org.
Scott Milktech Ltd. (2013). World’s first automatic milking
system. scott.co.nz/scott-milktech.
Shneiderman, B. (1996). The eyes have it: A task by
data type taxonomy for information visualizations. In
Proc. IEEE Symp. Vis. Lang., pages 336–343.
Sminchisescu, C. and Triggs, B. (2001). Covariance scaled
sampling for monocular 3D body tracking. In Proc.
IEEE CVPR, pages 447–454.
Sussman, M. and Wright, G. (1999). The correlation coeffi-
cient technique for pattern matching. In Proc. ISMRM,
page 203.
Westberg, M. (2009). Time of flight based teat de-
tection. In Tech. Report LiTH-ISY-EX-09/4154-
SE, Univ. of Link¨oping, Sweden. liu.diva-
portal.org/smash/get/diva2:224321/FULLTEXT01.pdf.
Westin, C., Peled, S., Gubjartsson, H., Kikinis, R., and
Jolesz, F. (1997). Geometrical diffusion measures for
MRI from tensor basis analysis. In Proc. ISMRM,
pages 17–42.
Yuille, A., Hallinan, P., and Cohen, D. (1992). Feature ex-
traction from faces using deformable templates. IJCV,
8(2):99–111.
VISAPP2015-InternationalConferenceonComputerVisionTheoryandApplications
530
