
Ensemble Learning Optimization for Diabetic Retinopathy Image
Analysis
Hanan S. Alghamdi, Lilian Tang and Yaochu Jin
Faculty of Engineering and Physical Sciences, University of Surrey, Guildford, Surrey, U.K.
Ke
ywords: Ensemble Learning, Ant Colony Optimization, Diabetic Retinopathy, Ensemble Diversity.
Abstract: Ensemble Learning has been proved to be an effective solution to learning problems. Its success is mainly
dependent on diversity. However, diversity is rarely evaluated and explicitly used to enhance the ensemble
performance. Diabetic Retinopathy (DR) automatic detection is one of the important applications to support
the health care services. In this research, some existing statistical diversity measures were utilized to
optimize ensembles used to detect DR related signs. Ant Colony Optimization (ACO) algorithm is adopted
to select the ensemble base models using various criteria. This paper evaluates several optimized and non-
optimized ensemble structures used for vessel segmentation. The results demonstrate the necessity of
adopting the ensemble learning and the advantage of ensemble optimization to support the DR related signs
detection.
1 INTRODUCTION
Diabetic retinopathy (DR) is one of the common eye
diseases associated with diabetes. As the rising
prevalence of diabetes worldwide, DR will become a
more important problem. Early detection of DR is
very essential for effective treatment. Given the
increasing number of DR patients worldwide and the
need of regular eye examination, the development of
automated screening of DR has received a lot of
attention from many research communities. The
main goals are to reduce the ophthalmologists’
workload and to improve the health care services.
DR computer-aided-diagnosis (DR-CAD) systems
are designed to distinguish between normal and
abnormal retinal images, in which DR symptoms
appear. Figure 1 shows two samples of retinal
fundus images; normal and image with DR lesion
called haemorrhages. Vessel segmentation is a vital
component of DR-CAD systems. Retinal blood
vessels must be excluded to reduce the false
positives in the detection of pathological lesions
such as haemorrhages shown in Figure 1-b. The
automatic detection of vessels can also be useful in
in locating other anatomical structures such as optic
disc and fovea. Furthermore, vessel segmentation is
an important diagnosis key for several retinal
pathologies leading to vascular anomalies. Many
vessel segmentation techniques and algorithms have
Figure 1: Retinal Fundus Images Samples.
been developed in the literature. However, the
presence of noise, the variability of image
acquisition equipment, and the presence of some
pathological lesion make the vessel segmentation
process more and more challenging. This
emphasizes the need for developing more accurate
automated techniques (Preethi and Vanithamani,
2012) (Khan, Shaikh, and Mansuri, 2011) (Fraz et
al., 2012). Vessel segmentation studies can be
classified into two main groups, rule-based
approaches and machine learning approaches
(Marin, Aquino, Gegundez-Arias, and Bravo, 2011).
Adaptive thresholding (Xu and Luo, 2010) (Jiang,
Society, and Mojon, 2003), vessel tracking (Liu and
Sun, 1993) (Vlachos and Dermatas, 2010)
(Delibasis, Kechriniotis, Tsonos, and Assimakis,
2010), mathematical morphology (Zana and Klein,
1999) (Zana and Klein, 2001), and matched filtering
a) Normal Retina
b) Retina with DR Lesions
(haemorrhages)
471
S. Alghamdi H., Tang L. and Jin Y..
Ensemble Learning Optimization for Diabetic Retinopathy Image Analysis.
DOI: 10.5220/0005296604710477
In Proceedings of the 10th International Conference on Computer Vision Theory and Applications (VISAPP-2015), pages 471-477
ISBN: 978-989-758-089-5
Copyright
c
2015 SCITEPRESS (Science and Technology Publications, Lda.)

(Zhang, Zhang, Zhang, and Karray, 2010)
(Chaudhuri, Chatterjee, Katz, Nelson, and
Goldbaum, 1989), are all examples of the rule based
approach. On the other hand, machine learning
approach which can be supervised or unsupervised
learning, is used to classify all pixels in an image
into vessel or non-vessel classes. Supervised
learning, such as work presented in (Becker and
Rigamonti, 2013) and (Ricci and Perfetti, 2007) is
based on training a classifier on a set of manually
labelled reference images known as gold standard or
ground truth data. By contrast, unsupervised
learning performs the vessel segmentation without
any prior labelling information. Examples of such
approaches were suggested in (Ricci and Perfetti,
2007) and (Tolias and Panas, 1998). In this research
we adopt heterogeneous ensemble learning for pixel
classification.
The use of ensemble models or ensemble
classifiers has proved to provide better result than a
single complex algorithm in many problems as
ensembles are able to better resolve the bias-
variance trade-off. However, it is well known in the
literature that in order for the ensemble models to
have better performance, diversity should be
maintained. This diversity manifests itself as
disagreement or ambiguity among the ensemble
members and the performance of any ensemble
models is largely dependent on diversity. Diversity
is usually supposed to be enforced by the designing
process such as using different training samples.
Despite of its importance, how the diversity
could be utilized to enhance the performance of
ensemble is rarely studied, which calls for further
investigations.
In this paper, we adopt several ensemble
structures used for retinal vessel segmentation. By
developing ensemble models we are aiming to
obtain much more accurate and robust learning
model that outperforms any individual base model.
An ant colony optimization algorithm is used to
optimize the ensemble structures based on several
criteria including the diversity and the ensemble
members’ performances. The results confirm the
effectiveness of the ensemble learning and the
advantage of ensemble optimization.
The rest of the paper is organized as follows:
Section 2 presents some existing vessel detection
techniques that we have used as the base models in
the ensembles. Section 3 discusses some important
aspects of ensemble learning and motivates the
importance of ensemble optimization. Section 4
describes our ensemble optimization approach.
Section 5 presents and discusses the results of the
optimized ensembles. Section 6 concludes the paper
and suggests further works.
2 VESSEL SEGMNATION
METHODS
The large numbers of vessel segmentation
approaches available in the literature makes the
process of choosing base models to construct
ensemble systems more complex and challenging. In
spite of this fact, we evaluated several methods
available from the literature found to achieve good
performance. Moreover, we developed a new fast
and efficient classifier model. All these methods
were used in constructing different ensemble
structures. In the following, we describe each type of
the base models used in constructing ensembles used
in this paper for vessel segmentation.
In (Soares, Leandro, Cesar Júnior, Jelinek, and
Cree, 2006) Bayesian classifier is applied with class-
conditional probability density distribution (PDF)
defined as a linear combination of Gaussian models.
The feature set consists of two-dimensional Gabor
wavelet transform responses taken at different
scales, augmented with pixels intensity. The method
is called Gaussian Mixture Model (GMM). The
number of Gaussian models k varies in each
experiment. The approach was trained and tested on
DRIVE and STARE publically available datasets.
The training phase was performed on both datasets.
The resulted classifiers were also tested on both
datasets.
We also developed a simple and fast vessel
segmentation algorithm based on pixel
classification. Linear discriminant classifier (LDC)
(Richard O. Duda , Peter E. Hart, 2000) is used with
Principle Component Analysis (PCA) a classical
dimension reduction method to select different
number of features. The feature set consists of the
output of Gaussian filters and its derivatives up to
order 2 taken at multiple variances and the green
channel intensity of the original image. Features
were normalized to zero mean and unit variance.
DRIVE training set was used for training the
classifier. This approach is similar to the one used in
(Niemeijer, 2006) in which kNN (k=30) is used to
obtain the vessel non-vessel probability map and
then thresholding is performed to get the binary
segmentation. However, LDC shows extremely fast
and efficient training and testing phases compared to
the kNN classifier. This efficiency is crucial in
VISAPP2015-InternationalConferenceonComputerVisionTheoryandApplications
472

constructing ensembles as many models should be
trained and used for classification.
However, when using LDC for pixel classification,
we have noticed that the boundary between the field
of view (FOV) and the black background result in
many false positives (FP) on the boundary. Thus, we
enhanced the result of the LDC classifier by
adopting the diffusion approach used in (Huynh,
2013). The process starts by relabeling five pixels on
the boundary as background then diffuse the colour
in FOV through the background by using the heat
equation. After the diffusion, the features are
extracted and tested using the LDC classifier in a
space reduced by PCA.
We also tested an algorithm called Multi Scale
Line Tracking Algorithm (MSLTA) (Vlachos and
Dermatas, 2010). The algorithm starts by extracting
a set of pixels, called seeds from the image
histogram. The histogram is divided into three
sections by two threshold values T_low and T_high.
The threshold T_low is estimated by the percentage
of pixels belonging to background, while the
threshold T_high is estimated by the percentage of
pixels belonging to bright structure. Pixels with
intensity between these two values are expected to
be blood vessel and extracted as seeds for line
tracking algorithm. All seed pixels are evaluated
using five different scales to construct a confidence
matrix used to get the initial candidate blood vessels.
Then a 3×3 median filter is applied to remove FP
pixels and to fill gaps in some blood vessels lines.
Finally, morphological directional filtering and
morphological reconstruction are applied to further
enhance the result.
In (Goh, 2011), adaptive thresholding is used on
the contrast-enhanced image to get candidate blood
vessel objects. Then two kinds of detectors are used
to make the final decision. In the first detector, the
linear properties of the detected objects are
evaluated to filter out non-blood vessel objects. In
the second detector, features of the obtained objects
are extracted and used by the classifier ensemble.
The ensemble consists of an optimized set of neural
networks trained using different training sets or
different subsets of features. The base models are
generated using different neural networks, different
initial weights and different number of hidden units.
This results in 270 base models. These base models
are optimized by using Genetic Algorithm. The
probability of each base model to be selected is
proportional to its accuracy compared to the sum of
all ensemble models accuracies.
3 ENSEMBLE LEARNING
We constructed five non-optimized ensemble
models using the methods described previously.
Ensemble A is constructed based on GMM methods
trained and tested on DRIVE using different number
of Gaussian models (k=1, 5, 10, 15, 20). As all of
these methods are similar except in one parameter,
the diversity is not expected to be high. Ensemble B
is also constructed using GMM methods however,
STARE dataset is used to train some of the
classifiers which are then tested on DRIVE. Thus,
we expect the diversity of ensemble B is higher than
that of ensemble A, as different training sets are
used.
Ensemble C was constructed by using different
LDC-PCA methods with different number of
features. Ensemble D was formed by all GMM and
LDC-PCA methods. MSLTA, the adaptive
thresholding approach, kNN classifier and all of the
GMM and LDC-PCA methods were combined
together to form ensemble E. Therefore, as different
training datasets, features, methods and parameters
are used in this case. Thus the diversity of this
ensemble is expected to be the highest.
We evaluated the performance of all models on
DRIVE testing dataset. The evaluation is performed
quantitatively by comparing classification
performance in terms of accuracy, sensitivity and
specificity. The results are shown in Table 1.
We also estimate the diversity of the five
ensembles by calculating the diversity disagreement
measure (Schapire, 2003) and relate this to the
improved ensembles’ performances. The greater the
disagreement measure, the higher the ensemble
diversity. Figure 2 shows an example of the visual
results of the five non-optimized ensembles
compared to the gold standard and to an expert
human observer.
The results in Table 1 highlight some interesting
aspects of ensemble learning. First, we can see that
as the diversity increases, the improvement of the
ensemble performance becomes more evident. For
instance, the least diverse ensemble is C which
consists of the same models trained on the same
features and only the number of features is different
in each model. Ensemble C manifests the lowest
improvement in accuracy and no improvement in
specificity. On the other hand, the greatest diversity
is manifested in ensemble E where different
algorithms, different classifier parameters, different
features and different training sets where used. This
indeed accompanies with the greatest improvement
in ensemble accuracy and specificity which is indeed
EnsembleLearningOptimizationforDiabeticRetinopathyImageAnalysis
473
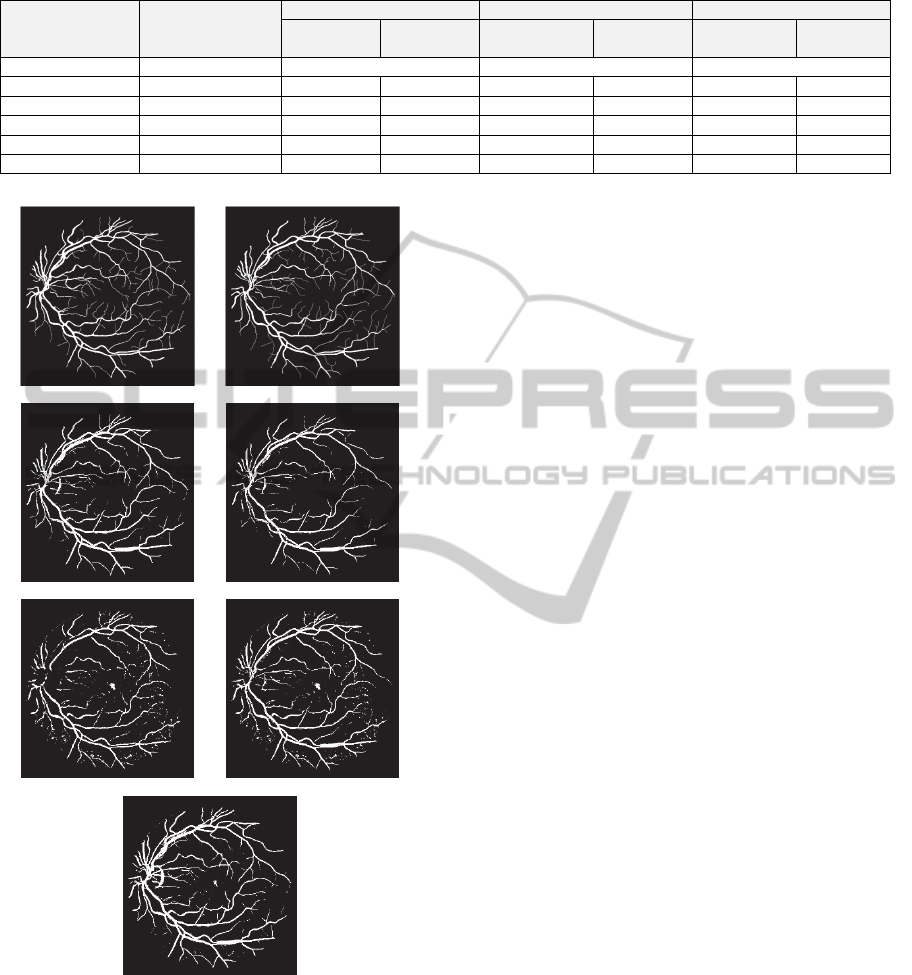
Table 1: Performance evaluation of non-optimized ensembles.
Ensemble
Disagreement
Diversity Measure
Accuracy Specificity Sensitivity
Base Model
Average
Ensemble
Base Model
Average
Ensemble
Base Model
Average
Ensemble
Human Observer - 94.72 97.25 77.60
A 0.0234 94.00 94.43 97.08 96.89 73.13 77.86
B 0.0260 93.75 94.52 97.66 98.34 67.13 68.57
C 0.0094 91.33 91.44 98.50 98.21 41.69 44.55
D 0.0348 92.94 94.46 97.94 98.68 58.65 65.68
E 0.0385 92.58 94.22 97.97 99.09 55.53 60.89
Gold Standard Human Observer
A B
C D
E
Figure 2: Example of Vessel Segmentation Results of non-
optimized ensembles.
higher than the specificity achieved by the expert
human observer.
Consequently, we assume that this relationship
between the diversity and the improvement of the
ensemble performance can be utilized to construct a
better performance ensemble.
However, ensemble E achieved highest specificity
but has lowest sensitivity compared to other
ensembles. Thus, we assume that when increasing
the number of base models, the overall performance
may not be improved and the sensitivity in particular
may be decreased significantly. Thus it is more
desirable to construct ensemble with a small number
of models not only to reduce the complexity but also
to obtain an ensemble that outperforms its best
models. At the same time to achieve better
specificity we should maximize this number as much
as possible.
4 ENSEMBLE LEARNING
OPTIMIZATION
A direct approach of selecting a subset of base
models to construct an ensemble is to select models
which have the highest performance. This approach
has several weaknesses, including over-fitting,
sensitivity to the noise and possible selection of
identical base models.
Since the success of ensemble learning is largely
related to the base models performance as well as
the diversity among these models, these aspects
should all incorporated into the selection of base
models process. Moreover, the performance of any
base model should be evaluated based on its
individual performance as well as its performance
within the ensemble. In other words, selecting high
performance base models is not sufficient to ensure
the constructing of better ensemble. The base
models should be diverse and each base model
should contribute to enhance the overall ensemble
performance.
Motivated by the above reasons, in this research
we propose an ACO-Based algorithm to search and
select the base models in an attempt to construct
better performance ensemble to support DR
automatic detection.
By employing the ACO algorithm in optimizing
ensemble learning we aim to select the base models
VISAPP2015-InternationalConferenceonComputerVisionTheoryandApplications
474
which perform well as individual and contribute well
to the overall ensemble performance. The main
advantages of this approach are to alleviate over-
fitting by reducing the number of models, thus
reducing the model complexity. The standard ACO
algorithm is used in this research to optimize the 20
base classifier models presented in Table 1 based on
different heuristics.
The problem of optimizing classifier ensemble
can be described as an ACO problem. The base
classifiers can be represented as vertices in a graph
with edges representing the next classifier to be
selected to construct the ensemble. Heuristic
desirability and pheromone trail intensity are
associated with each classifier. Each ant will select
randomly the first classifier to construct its
ensemble. Several measures were used to evaluate
the constructed solutions as ensemble accuracy,
sensitivity and specificity. Updating pheromones
phase is achieved by decreasing all the pheromone
values associated with all classifiers through
pheromone evaporation and by increasing the
pheromone values associated with best so far
ensemble. For example if sensitivity is employed
then that means the more sensitive the ensemble is,
the more pheromone quantity will be added to
classifiers used in that ensemble. The ACO-
ensemble optimization algorithm proposed in this
study is illustrated in
5 RESULTS AND DISCUSSIONS
Several experiments were conducted to optimize the
ensemble. First, accuracy, sensitivity and specificity
of the base models are used in each ensemble as
heuristics to guide the ACO search. These measures
are also used to evaluate the ants’ constructed
solutions. This results in three different optimized
ensembles shown in Table 3. The results show that
optimizing ensembles based on accuracy or
sensitivity results in much higher sensitivity, higher
accuracy and comparable specificity compared with
ensembles optimized by specificity. Thus, in the
subsequent experiments, accuracy and sensitivity are
used to evaluate the ant’s candidate solution.
Diversity is incorporated into the optimization
process of ensembles. ACO search is guided by
seven diversity measures available from the
literature (Brown, Wyatt, Harris, and Yao, 2005).
Results are shown in
Table 4 and Table 5.
Table 4 and Table 5, show that using
disagreement diversity measures to select the base
models during the ACO optimization, lead to the
best accuracy compared to all other diversity
measures.
The specificity and sensitivity achieved by
employing disagreement and Q-static however, are
Table 2: ACO proposed algorithm for ensemble
optimization.
Input: classifiers oracle outputs for some training data
samples
O = ( o
1
, o
2
, …, o
n
)
Output: base model classifiers for ensemble
1. Initialize ACO Parameters
2. Initialize Pheromone;
3. Determine the population of ants (m);
4. For each ant k do
Repeat
Choose in probability the classifier
to include;
Use the heuristic to adjust the
probability selection;
Append the partial solution with the
candidate classifier
Until ant k has chosen p classifiers
Evaluate the constructed ensemble ܧ
;
Use ensemble performance to
evaluate the constructed ensemble
If (termination condition not met) do
For each classifier ܿ
used in ensemble ܧ
Update Pheromone
b
ased on the solution quality,
ࡸࢋࢍ࢚ࢎ
End for
For each classifier ܿ
do
Evaporate Pheromone
End for
Else terminate;
Table 3: Vessel segmentation optimized ensembles guided
by ensemble accuracy, specificity and sensitivity.
Ensemble
Accuracy Specificity Sensitivity
# ACO Heuristic
1 Accuracy 94.72 97.75 74.10
2 Specificity 92.46 98.57 50.52
3 Sensitivity 94.27 96.46 79.48
Table 4: Vessel segmentation optimized ensembles guided
by diversity and ensemble accuracy.
Experiment Settings
Accuracy Specificity Sensitivity
# Diversity Measure
1
Q-statistic
94.73 97.85 73.59
2
Disagreement
94.75 97.93 73.17
3
Double-fault
94.60 97.56 74.50
4
Kappa-statistic
94.66 98.00 71.91
5
Entropy
94.69 97.61 74.86
6
Generalized diversity
94.70 97.71 74.24
7
Coincident failure
diversity
94.66 97.83 73.15
EnsembleLearningOptimizationforDiabeticRetinopathyImageAnalysis
475
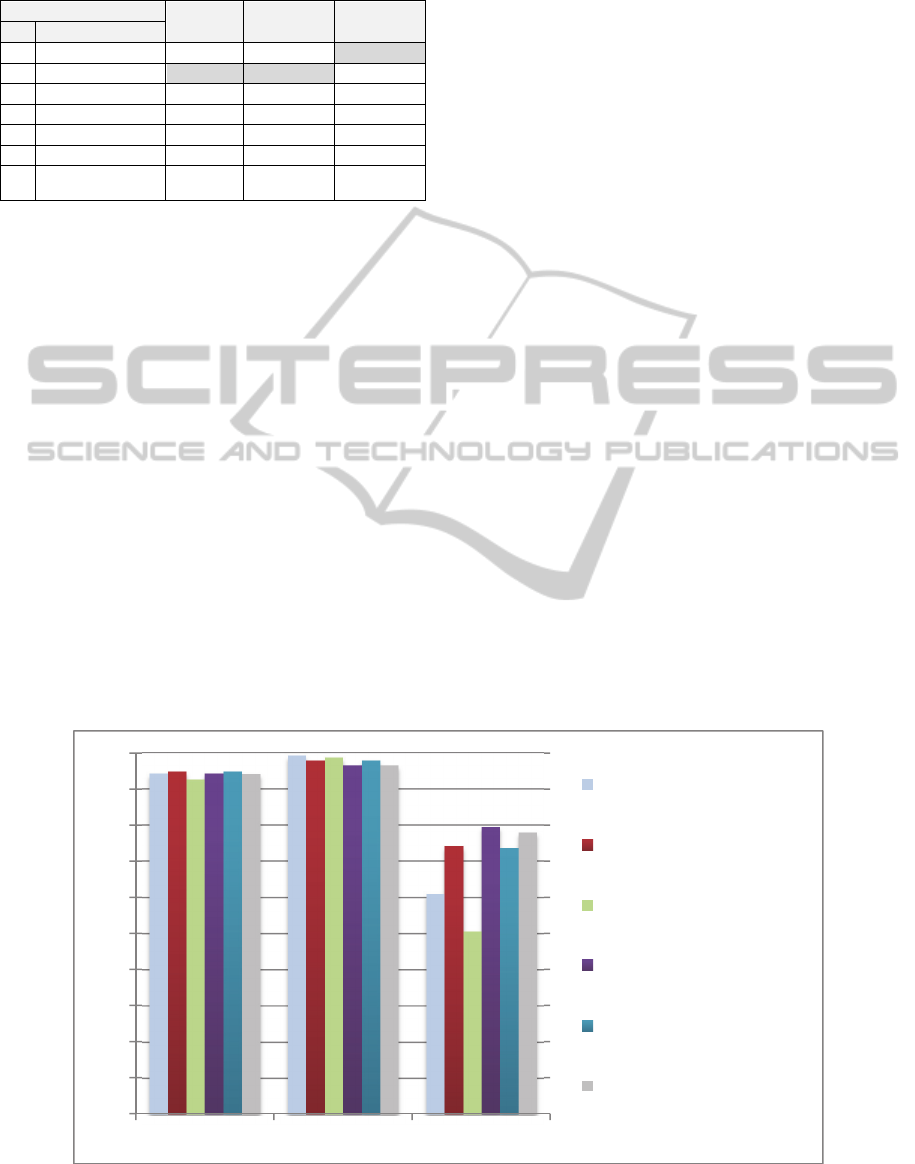
Table 5: Vessel segmentation optimized ensembles guided
by diversity and ensemble sensitivity.
Experiment Settings
Accuracy Specificity Sensitivity
# Diversity Measure
1
Q-statistic
94.12 96.50
77.88
2
Disagreement
94.66 97.33 76.52
3
Double-fault
94.15 96.97 74.94
4
Kappa-statistic
94.61 97.22 76.88
5
Entropy
94.56 97.26 76.29
6
Generalized diversity
94.56 97.10 77.36
7
Coincident failure
diversity
94.62 97.22 76.96
comparable to the other measures. In Table 6, the
best sensitivity achieved is due to incorporating the
Q-statistic diversity measure into the ACO
optimization. Although in this case Q-statistic results
in low specificity, when looking at the visual
segmentation result, we assume that these errors can
be reduced by excluding the OD and FOV
boundaries from the image before the segmentation.
In order to compare the performance of non-
optimized and optimized ensembles, their
performance is graphically illustrated in Figure 3.
The result of Q-statistic is used in this figure for
the Accuracy-Diversity and Sensitivity-Diversity
optimized ensembles. The reason of this is that Q-
statistic gives the highest performance ensembles
compared to other diversity measures. As shown in
the figure, ensembles optimized by sensitivity
resulting in highest sensitivity and very comparable
results in specificity and accuracy compared to the
best ensemble. Based on these findings, we propose
to adopt the sensitivity optimized ensembles for
blood vessel segmentation in the DR diagnosis
system.
6 CONCLUSIONS AND FUTURE
WORKS
In this paper several optimized and non-optimized
ensemble structures used for vessel segmentation
have been evaluated. All of the developed ensembles
were evaluated with multiple performance
indicators, i.e., accuracy, sensitivity and specificity
as well as the diversity aspect of these ensembles.
The diversity was evaluated using different
statistical diversity measures. The relationship
between the performance measurers and the
diversity measures were analysed.
Based on the findings in this work, we aim to
further study the development and evaluation of a
fully optimized ensemble learning model to support
the DR related signs detection. This model is
expected to enhance several DR system components
such as blood vessel detector, optic disc detector, red
lesion detector and bright lesion detector. Moreover,
as the model is of a generic form, it should also be
applicable to other complex pattern recognition
problems.
The optimization should be performed to learn
the parameters of the base model, select the base
models; optimize the number of the base models and
to learn the features used for each model. Moreover,
the optimization should also employ the diversity
measures and the performance of base models.
Figure 3: Comparisons of different ensembles structures performance.
0
10
20
30
40
50
60
70
80
90
100
Accuracy Specificity Sensitivity
Ensemble of all methods
Accuracy -Accuracy
Optimized Ensemble
Specificity -Specificity
Optimized Ensemble
Sensitivity -Sensitivity
Optimized Ensemble
Accuracy -Diversity
Optimized Ensemble
Sensitivity -Diversity
Optimized Ensemble
VISAPP2015-InternationalConferenceonComputerVisionTheoryandApplications
476

REFERENCES
Becker, C., and Rigamonti, R. (2013). KernelBoost :
Supervised Learning of Image Features For
Classification.
Brown, G., Wyatt, J., Harris, R., and Yao, X. (2005).
Diversity creation methods: a survey and
categorisation. Information Fusion, 6(1), 5–20.
doi:10.1016/j.inffus.2004.04.004.
Chaudhuri, S., Chatterjee, S., Katz, N., Nelson, M., and
Goldbaum, M. (1989). Detection of blood vessels in
retinal images using two-dimensional matched filters.
IEEE Transactions on Medical Imaging, 8(3), 263–9.
doi:10.1109/42.34715.
Delibasis, K. K., Kechriniotis, A. I., Tsonos, C., and
Assimakis, N. (2010). Automatic model-based tracing
algorithm for vessel segmentation and diameter
estimation. Computer Methods and Programs in
Biomedicine, 100(2), 108–22. doi:10.1016/j.cmpb.
2010.03.004.
Fraz, M. M., Remagnino, P., Hoppe, a, Uyyanonvara, B.,
Rudnicka, a R., Owen, C. G., and Barman, S. a.
(2012). Blood vessel segmentation methodologies in
retinal images--a survey. Computer Methods and
Programs in Biomedicine, 108(1), 407–33.
doi:10.1016/j.cmpb.2012.03.009.
Goh, J. (2011). The Reading of Diabetic Retinopathy
Images - An Evolutionary Approach, (June).
Huynh, N. (2013). A FILTER BANK APPROACH TO
AUTOMATE VESSEL EXTRACTION WITH
APPLICATIONS. California State University.
Jiang, X., Society, I. C., and Mojon, D. (2003). Adaptive
Local Thresholding by Verification-Based
Multithreshold Probing with Application to Vessel
Detection in Retinal Images æ, 25(1), 131–137.
Khan, M. I., Shaikh, H., and Mansuri, A. M. (2011). A
Review of Retinal Vessel Segmentation Techniques
And Algorithms, 2(5), 1140–1144.
Liu, I., and Sun, Y. (1993). Recursive tracking of vascular
networks in angiograms based on the detection-
deletion scheme. IEEE Transactions on Medical
Imaging, 12(2), 334–41. doi:10.1109/42.232264.
Marin, D., Aquino, A., Gegundez-Arias, M. E., and Bravo,
J. M. (2011). A new supervised method for blood
vessel segmentation in retinal images by using gray-
level and moment invariants-based features. IEEE
Transactions on Medical Imaging, 30(1), 146–58.
doi:10.1109/TMI.2010.2064333.
Niemeijer, M. (2006). Automatic Detection of Diabetic
Retinopathy in Digital Fundus Photographs.
Preethi, M., and Vanithamani, R. (2012). Review of
Retinal Blood Vessel Detection Methods for
Automated Diagnosis of Diabetic Retinopathy, 262–
265.
Ricci, E., and Perfetti, R. (2007). Retinal blood vessel
segmentation using line operators and support vector
classification. IEEE Transactions on Medical Imaging,
26(10), 1357–65. doi:10.1109/TMI.2007.898551.
Richard O. Duda, Peter E. Hart, D. G. S. (2000).
Patter
Classification (Second Edi.). John Wiley and Sons,
New York,.
Schapire, R. E. (2003). Measures of Diversity in Classifier
Ensembles, 181–207.
Soares, J. V. B., Leandro, J. J. G., Cesar Júnior, R. M.,
Jelinek, H. F., and Cree, M. J. (2006). Retinal vessel
segmentation using the 2-D Gabor wavelet and
supervised classification. IEEE Transactions on
Medical Imaging, 25(9), 1214–22. Retrieved from
http://www.ncbi.nlm.nih.gov/pubmed/16967806.
Tolias, Y. a, and Panas, S. M. (1998). A fuzzy vessel
tracking algorithm for retinal images based on fuzzy
clustering. IEEE Transactions on Medical Imaging,
17(2), 263–73. doi:10.1109/42.700738.
Vlachos, M., and Dermatas, E. (2010). Multi-scale retinal
vessel segmentation using line tracking. Computerized
Medical Imaging and Graphics : The Official Journal
of the Computerized Medical Imaging Society, 34(3),
213–27. doi:10.1016/j.compmedimag.2009.09.006.
Xu, L., and Luo, S. (2010). A novel method for blood
vessel detection from retinal images. Biomedical
Engineering Online, 9, 14. doi:10.1186/1475-925X-9-
14.
Zana, F., and Klein, J. C. (1999). A multimodal
registration algorithm of eye fundus images using
vessels detection and Hough transform. IEEE
Transactions on Medical Imaging, 18(5), 419–28.
doi:10.1109/42.774169.
Zana, F., and Klein, J. C. (2001). Segmentation of vessel-
like patterns using mathematical morphology and
curvature evaluation. IEEE Transactions on Image
Processing : A Publication of the IEEE Signal
Processing Society, 10(7), 1010–9. doi:10.1109/
83.931095.
Zhang, B., Zhang, L., Zhang, L., and Karray, F. (2010).
Retinal vessel extraction by matched filter with first-
order derivative of Gaussian. Computers in Biology
and Medicine, 40(4), 438–45. doi:10.1016/j.comp
biomed.2010.02.008.
EnsembleLearningOptimizationforDiabeticRetinopathyImageAnalysis
477
