
Color Object Recognition based on Spatial Relations between Image
Layers
Micha
¨
el Cl
´
ement, Micka
¨
el Garnier, Camille Kurtz and Laurent Wendling
Universit
´
e Paris Descartes, LIPADE – SIP (EA 2517), 45 rue des Saints-P
`
eres, 75006 Paris, France
Keywords:
Object Recognition, Spatial Relations, Force Histograms, Mean Shift Segmentation, Shape Matching.
Abstract:
The recognition of complex objects from color images is a challenging task, which is considered as a key-
step in image analysis. Classical methods usually rely on structural or statistical descriptions of the object
content, summarizing different image features such as outer contour, inner structure, or texture and color
effects. Recently, a descriptor relying on the spatial relations between regions structuring the objects has been
proposed for gray-level images. It integrates in a single homogeneous representation both shape information
and relative spatial information about image layers. In this paper, we introduce an extension of this descriptor
for color images. Our first contribution is to consider a segmentation algorithm coupled to a clustering strategy
to extract the potentially disconnected color layers from the images. Our second contribution relies on the
proposition of new strategies for the comparison of these descriptors, based on structural layers alignments
and shape matching. This extension enables to recognize structured objects extracted from color images.
Results obtained on two datasets of color images suggest that our method is efficient to recognize complex
objects where the spatial organization is a discriminative feature.
1 INTRODUCTION
Object recognition from color images is an important
topic in image analysis that has been largely studied in
various imaging domains. The object recognition task
is generally performed in three steps (Andreopou-
los and Tsotsos, 2013): (1) extraction of salient re-
gions using a segmentation algorithm; (2) description
of these regions with quantitative features modeling
different types of information (e.g., color, texture or
shape); (3) recognition of the objects of interest by
classifying the characterized regions. A limit of this
approach is that these different types of features (and
their combinations) are sometimes not discriminant
enough to successfully describe the content of com-
plex objects, in particular when they are represented
by color images.
For the last decades, the spatial disposition of ob-
jects in a scene (or between object subparts) has re-
ceived much attention in the domain of image anal-
ysis (Santosh et al., 2012; Morales-Gonz
´
alez and
Garc
´
ıa-Reyes, 2013). Moreover, it has been stated
that structural relations between image components
are fundamental in the human perception of image
similarity. Therefore, the spatial relations between the
regions composing an object can be considered as im-
portant features to recognize the nature of the object
itself. However, as far as we know they are rarely used
for color object recognition.
Literature about spatial relations for image anal-
ysis can be structured in two main categories: qual-
itative and quantitative approaches. Qualitative ap-
proaches use symbolic relations such as positioning
(left, right, below, etc.) or topological relations (in-
side, outside, etc.) (Egenhofer, 1989; Inglada and
Michel, 2009). When dealing with complex objects,
it is necessary to capture a precise description of their
different structuring patterns, and to characterize both
large-scale and low-scale directional relations. Be-
sides, depending on the content meaning, these pat-
terns may be represented by unconnected subsets of
pixels. Therefore, in our context the spatial relations
cannot be summarized in a symbolic manner. Quan-
titative approaches gather methods that precisely de-
scribe the relative positions between objects. Fuzzy
quantitative methods are popular in different appli-
cation domains such as spatial reasoning in medi-
cal images (Bloch and Ralescu, 2003; Bloch, 2005)
or handwritten symbol recognition (Delaye and An-
quetil, 2011). These methods produce a fuzzy land-
scape per considered potential direction, but combin-
ing them in order to capture the omnidirectional spa-
427
Clément M., Garnier M., Kurtz C. and Wendling L..
Color Object Recognition based on Spatial Relations between Image Layers.
DOI: 10.5220/0005291304270434
In Proceedings of the 10th International Conference on Computer Vision Theory and Applications (VISAPP-2015), pages 427-434
ISBN: 978-989-758-089-5
Copyright
c
2015 SCITEPRESS (Science and Technology Publications, Lda.)
tial organization of possibly sparse objects is not ob-
vious. Another quantitative strategy is based on the
model of force histograms (Matsakis and Wendling,
1999), thereafter noted F-Histograms. This model
handles sparse object descriptions and summarizes
their relative position in a single histogram. Basically,
an F-Histogram between two objects is a circular dis-
tribution measuring their relative attraction along ev-
ery desired directions.
Based on this model, the authors of (Garnier et al.,
2012) proposed a new object descriptor called F-
Histogram Decomposition (FHD). The key idea of
this descriptor is to encode the pairwise spatial rela-
tions between disjoint layers of pixels composing an
object using F-Histograms. This work led to encour-
aging results, showing the interest of considering an
homogeneous representation of directional spatial re-
lations for object description. However, this approach
has been proposed only for gray-level images, and the
decomposition strategy does not consider the content
of the image to create the layers, but “hard” pixel
layers based on pre-defined image intensity values.
Consequently, this approach cannot straightforwardly
deal with complex color images.
In this article, we present an extension of this ap-
proach for the recognition of complex objects in color
images. The contributions of this article are twofold.
First, we propose an extension of the FHD descrip-
tor for color textured images by considering a robust
object decomposition strategy. This “content-based”
decomposition strategy relies on a combination of the
Mean Shift segmentation algorithm coupled to the
K-Means clustering algorithm enabling to extract bi-
nary image layers supposed to represent relevant ob-
ject subparts. Second, we present different strategies
for the comparison and matching of FHD descriptors.
Given two objects to be compared, the idea is to align
the different image layers based on various types of
information (i.e., luminance, shape), before compar-
ing their corresponding F-Histograms. These match-
ings, which involve F-Histogram matrix reorganiza-
tions, enable to enhance FHD comparisons supported
by dissimilarity computations in the context of color
images. These contributions allow for robust struc-
tured object recognition from complex images.
This article is organized as follows. Sec. 2 intro-
duces our method for color object description based
on spatial relations between image layers. Sec. 3 de-
scribes the experimental validations carried out with
this method on two color image datasets. Conclusions
and perspectives will be found in Sec. 4.
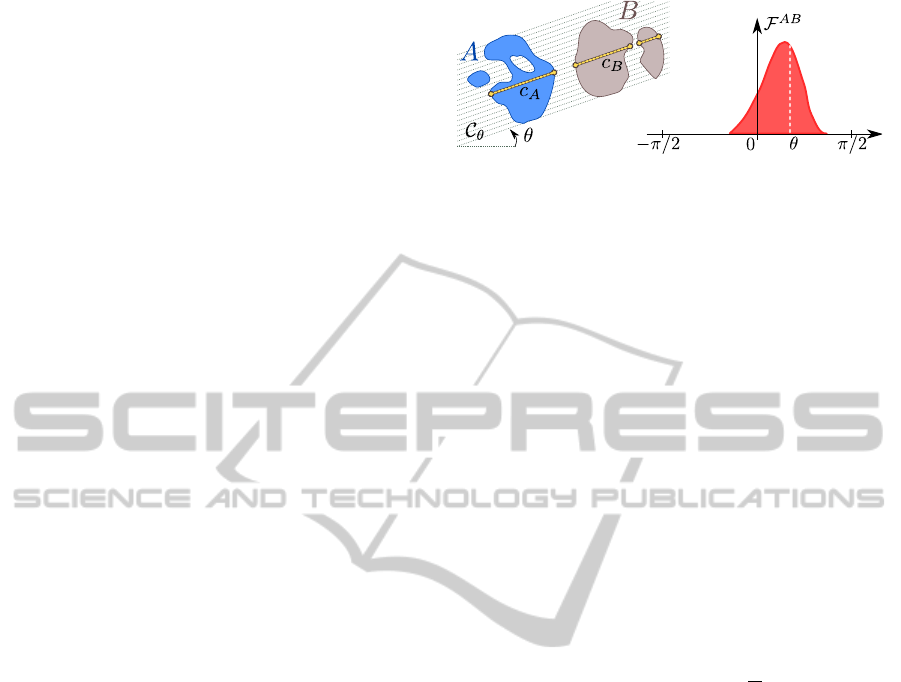
Figure 1: The force of attraction between A and B along
the direction θ is the integral sum of forces computed on
longitudinal cuts (C
A
,C
B
).
2 METHODOLOGY
First, we briefly recall the F-Histograms model
(Sec. 2.1). Afterwards, we present our strategy for the
decomposition of color objects into structural layers
(Sec. 2.2). Then, the FHD object descriptor for color
images is presented (Sec. 2.3). Finally, we propose
different matching strategies for the efficient compar-
ison of such FHD descriptors (Sec. 2.4).
2.1 Force Histograms Background
An F-Histogram allows to assess the directional spa-
tial relations between two binary objects (Matsakis
and Wendling, 1999). It relies on the definition of
a force of attraction between points. Given two points
located at a distance d from each other, their force
of attraction is defined by ϕ
r
(d) =
1
d
r
where r char-
acterizes the kind of force processed. When r = 0,
all points are treated with equal importance (constant
force), whereas when r = 2, more importance is given
to closer points (gravitational force). Instead of di-
rectly studying all pairs of points between the two ob-
jects, the force of attraction between two segments is
considered. Let I and J be two segments on a line
of angle θ, D
θ
IJ
the distance between them and |.| the
segment length. The force of attraction f
r
of I with
regard to J is given by:
f
r
(I,J) =
Z
|I|+D
θ
IJ
+|J|
D
θ
IJ
+|J|
Z
|J|
0
ϕ
r
(u− v)dvdu. (1)
Given two binary objects A and B, a θ-oriented
line in the image forms two sets of segments be-
longing to each object: C
A
= ∪{I
i
}
i=1..n
and C
B
=
∪{J
j
}
j=1..m
(see Fig. 1). The mutual attraction be-
tween these segments is defined as:
F(θ,C
A
,C
B
) =
∑
I∈C
A
∑
J∈C
B
f
r
(I,J). (2)
Then, the set of all θ-oriented parallel lines C
θ
going
through the whole image, gives us the global attrac-
tion F
AB
(θ) between A and B along a direction θ.
VISAPP2015-InternationalConferenceonComputerVisionTheoryandApplications
428
C
1
C
2
C
3
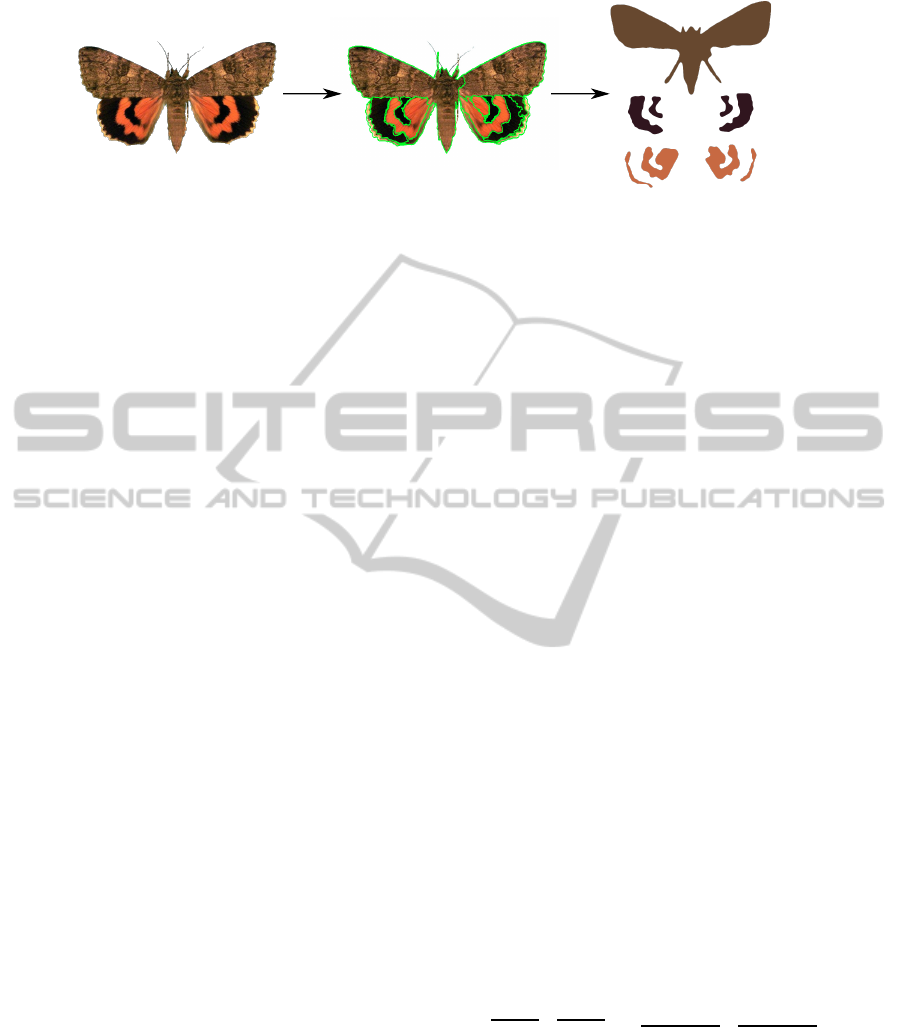
(a) Query image I. (b) Mean Shift segmentation. (c) Reconstruction with K-Means.
Figure 2: Illustration of the color image decomposition into structural layers.
Finally, the F-Histogram F
AB
is obtained by com-
puting F
AB
onto a set of angles θ ∈ [−π,+π], sum-
marizing the relative position of A and B. By ax-
iomatic definitions of the function F, the following
properties, useful to characterize similar patterns, can
be verified (Matsakis and Wendling, 1999): transla-
tion invariance as objects are processed independently
of their location in the image, symmetry considering
opposite directions, scale invariance if the histograms
are normalized and rotation invariance (after circular
shifts), because the approach is isotropic.
2.2 Decomposition into Image Layers
In order to capture the inner spatial relations structur-
ing an object, we first have to decompose it into dis-
tinct subparts. To this end, we use a decomposition
strategy based on a segmentation algorithm. How-
ever, in our context, the subparts of the object can
be composed of disconnected sets of pixels. Con-
sequently, we couple our segmentation strategy to a
clustering algorithm enabling to reconstruct the dif-
ferent structural image layers of the object.
2.2.1 Color Image Segmentation
Color image segmentation is still an open research is-
sue and no generic robust algorithm exists yet. In this
work, we choose to employ the Mean Shift algorithm
(Comaniciu and Meer, 2002) which has been success-
fully used during the last decade for both the classifi-
cation and the segmentation of textured color images.
The Mean Shift segmentation algorithm performs as
follows. Let I be an input color image (see Fig. 2 (a)).
For a given pixel of I, this algorithm builds a set of
neighboring pixels within a given spatial radius h
s
and
color range h
r
. The spatial and color center of this set
is then computed and the algorithm iterates with this
new spatial and color center. A third parameter M
allows to define the minimum size of the regions to
be kept after segmentation. The Mean Shift segmen-
tation algorithm produces a set of R non-overlapping
segments S
i
modeling a partition of I, and exposing
homogeneous color properties (see Fig. 2 (b)).
2.2.2 Color Image Layers Reconstruction
Resulting from the Mean Shift segmentation, a struc-
tural subpart of the object can be disconnected in dif-
ferent segments (e.g., see the orange parts on the but-
terfly wings in Fig. 2 (b)). Thus, our goal is to recon-
nect the segments sharing similar color intensity val-
ues into the same structural layers. Consequently, we
apply the classical K-Means clustering algorithm on
the R image segments S
i
issued from the Mean Shift
segmentation, to automatically reconstruct the struc-
tural layers of the object. The K-Means algorithm
has been used with N seeds to produce N clusters of
segments sharing similar color properties in the RGB
space. These clusters of segments model the N struc-
tural layers C
i
of the object (see Fig. 2 (c)). Note that
any clustering algorithm could be used.
2.3 F-Histogram Decomposition
Once the object has been decomposed into N struc-
tural layers, we then compute an F-Histogram be-
tween every pair of layers (C
i
,C
j
) according to the
strategy proposed in (Garnier et al., 2012). The color
F-Histogram Decomposition (FHD) of an object de-
picted in an image I is thus the set defined as:
F
C
i
C
i
r
∀i∈{1..N}
|
{z }
shape
∪
n
F
C
i
C
j
r
o
∀(i, j)∈{1..N}
2
, j>i
|
{z }
spatial relations
. (3)
These F-Histograms can be represented as a ma-
trix (see Fig. 3) encoding N shape descriptors (when
i = j), and N(N − 1)/2 spatial relations descrip-
tors between pairwise layers (when i > j). An F-
Histogram computed on a layer with itself induces a
natural overlapping, only allowing to use a constant
force of attraction (i.e., r = 0). In this study, for com-
parability and normalization purposes, we also use a
ColorObjectRecognitionbasedonSpatialRelationsbetweenImageLayers
429
C
3
C
2
C
1
C
2
C
1
C
3
C
1
C
2
C
3
C
1
C
2
C
3
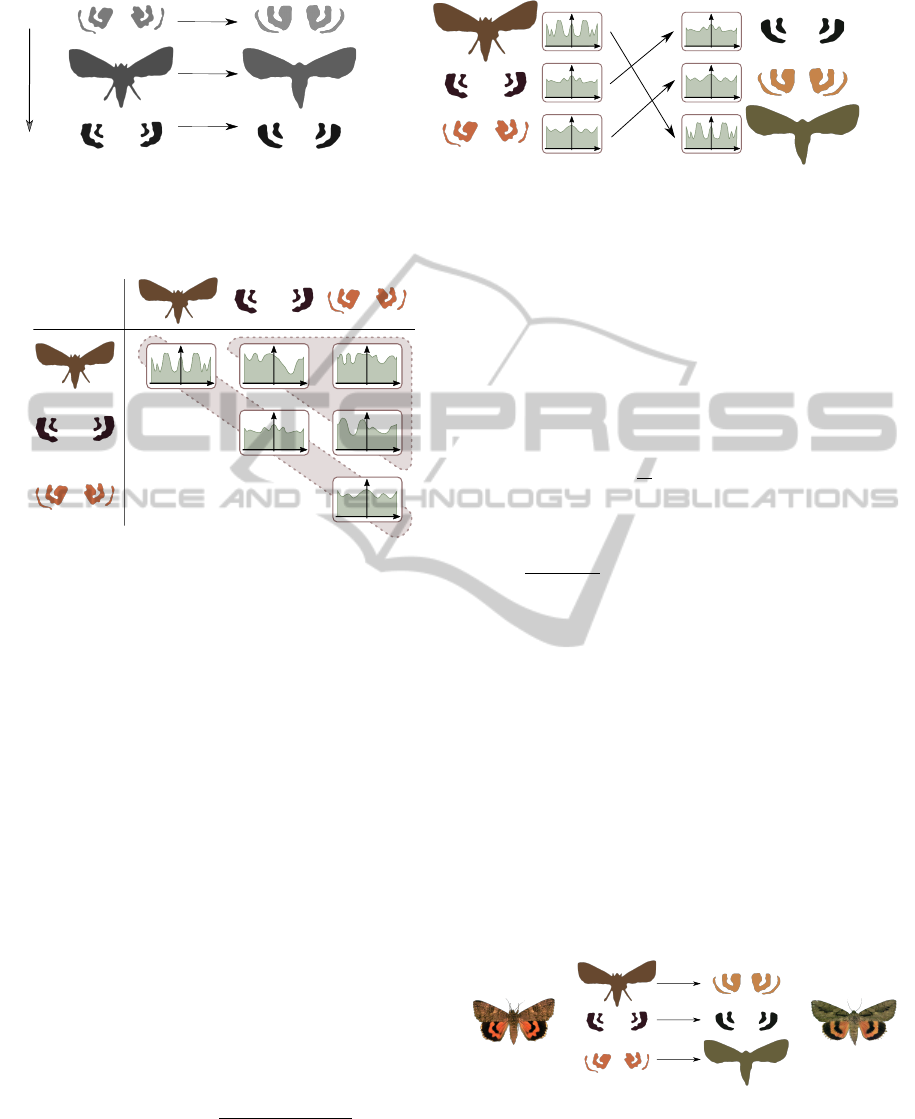
(a) Color-based matching.
(b) Shape-based matching.
L*
Figure 4: Illustration of the two proposed FHD matching strategies.
C
1
C
2
C
3
C
1
C
2
C
3
Figure 3: Force Histogram Decomposition (FHD) of an ob-
ject. An F-Histogram is computed between every pair of
layers (C
i
,C
j
) issued from the image decomposition step.
constant force for spatial relations F-Histograms, re-
sulting in an homogeneous descriptor.
As a consequence of F-Histograms properties,
FHD descriptors are naturally translation invariant
and symmetric. Depending on the application re-
quirements, scale invariance is obtained by normaliz-
ing the F-Histograms, and rotation invariance can be
pursued by estimating their mode or by minimizing
the distance between shifted FHD descriptors.
2.4 Comparison of FHD Descriptors
Comparing FHD descriptors can be done by evaluat-
ing the dissimilarity between the two matrices of F-
Histograms, using a distance metric. Based on the
results of (Garnier et al., 2012), we use the χ
2
dis-
tance to compare pairwise F-Histograms. Given two
F-Histograms F
A
and F
B
computed along θ
max
direc-
tions, the χ
2
distance between them is defined as:
d
χ
2
(F
A
,F
B
) =
θ
max
∑
i=0
(F
A
(i) − F
B
(i))
2
F
A
(i) + F
B
(i)
. (4)
As noted before, the FHD descriptor includes both
shape descriptions (on the diagonal) and pairwise spa-
tial relations (on the upper triangle). The semantic
meaning of these descriptions being different, we can
split the overall distance metric into two distinct parts,
that is, for two FHD descriptors Q and T:
D(Q, T ) = αD
shape
(Q,T) + (1 − α)D
spatial
(Q,T),
(5)
where the distance between shapes and the distance
between spatial relations are respectively defined as:
D
shape
(Q,T) =
1
N
N
∑
i=1
d
χ
2
F
C
i
C
i
Q
,F
C
i
C
i
T
, (6)
D
spatial
(Q,T) =
2
N(N − 1)
N
∑
i=1
N
∑
j=i+1
d
χ
2
F
C
i
C
j
Q
,F
C
i
C
j
T
, (7)
and with α ∈ [0, 1] balancing the weight given to
shape descriptions compared to spatial relations. In
the experimental section of this paper, we study the
influence of this parameter on the retrieval results.
This approach for comparing FHD descriptors is
only relevant if the underlying image layers struc-
turing the two objects are correctly aligned in the
two matrices. On the contrary, if the underlying im-
age layers are misaligned (see Fig. 5), the induced
FHD descriptors will lead lead to meaningless pair-
wise comparisons. This case is particularly likely to
occur since we are dealing with color images, given
that there is no natural order between image layers
associated with intensity values in the RGB space.
C
1
C
2
C
3
C
1
C
2
C
3
Object A Object B
Figure 5: Illustration of a typical case where similar objects
described with FHD descriptors can be incorrectly com-
pared due to a misalignment of their structural layers.
Therefore, before applying the pairwise dissimi-
larity measure described above, it seems crucial to
employ a matching strategy between the structural
VISAPP2015-InternationalConferenceonComputerVisionTheoryandApplications
430

layers of the objects. Finding such a matching be-
tween two FHD descriptors is a combinatorial prob-
lem (for N layers, there exists N! possible matchings),
but the complexity of it can be effectively reduced
by making assumptions on the underlying image lay-
ers. Thereafter, we propose different matching strate-
gies based on specific alignments of the image layers.
In our approach, FHD descriptors are computed only
once, and the matching step only requires reorganiza-
tions of the F-Histograms matrices.
Color-based Matching. This matching strategy is
based on the assumption that corresponding layers in
the two objects will be similar in terms of colorime-
try. To this effect, the image layers of each FHD de-
scriptor are sorted according to the luminance value
of the pixels composing the clusters issued from the
decomposition step. An illustration of the color-based
matching strategy is shown in Fig. 4 (a). This strategy
being based on the decomposition step only, it can be
applied prior to the computation of the descriptors.
Therefore, no dynamic reorganization is required and
the corresponding F-Histograms in the two descrip-
tors can be compared in a simple pairwise manner.
Shape-based Matching. Another approach when
comparing two FHD descriptors is to assume that the
corresponding layers in the two objects will be similar
in terms of shape. Fig. 4 (b) illustrates the principle of
this matching strategy: each layer is matched with the
one presenting the closest shape F-Histogram. To ap-
ply this strategy, we can assimilate it to an optimiza-
tion problem where the goal is to minimize the overall
distance D
shape
(Q,T) between shape F-Histograms in
two FHD descriptors Q and T . The exact solution re-
quires the enumeration of the N! matching possibil-
ities and can be considered as an optimal matching
(from an optimization point of view). It is obviously
not suitable for FHD descriptors of arbitrary number
of layers. An approximate solution consists in match-
ing the layers sequentially in a greedy manner. That
is, for each layer of Q, we pick the closest layer of T in
terms of distance between their shape F-Histograms.
From an algorithmic point of view, this only requires a
quadratic computational time, and can be considered
as a good compromise. These shape-based matching
strategies (optimal and greedy) require a dynamic re-
organization of the F-Histogram matrices during the
comparison process.
The choice of a matching strategy is strongly
application dependent, and each strategy presents
its downsides and benefits. While the color-based
strategy is simple and can be considered as a pre-
Figure 6: Samples from the Peale and the Motorbikes
datasets: butterfly from different species and motorbikes
from different categories.
processing step, it will fail if the color is not a dis-
criminative feature (e.g., if two objects have a similar
structure but different colors). On the other hand, the
idea of matching the layers according to their shape is
more relevant, but with a higher computational com-
plexity and an increased sensibility to noise.
3 EXPERIMENTS
We involved the presented framework in object recog-
nition and retrieval tasks from color images.
3.1 Datasets
We used two datasets of color images: a collection
of butterfly images and a collection of motorbike im-
ages. Samples of these datasets are shown in Fig. 6.
As we focus on the proposition of a new descriptor
for object recognition, we choose to validate this ap-
proach on specific datasets where the objects are de-
picted on an homogeneous background, avoiding any
object detection issues.
The Peale dataset is a subset of the Peale collec-
tion
1
and is composed of 318 color butterfly images
grouped in 28 classes according to their species, each
class containing a variable number of butterflies. But-
terflies are a typical case where inner spatial relations
are a distinguishing feature making the wings patterns
a direct link with the species. The same database lim-
ited to grayscale images was previously used in (Gar-
nier et al., 2012) to introduce FHD descriptors and to
assess the descriptive strength of the spatial relations.
The Motorbikes dataset is a subset of a collection
of various motorcycles from the side made available
by Caltech
2
. Our subset is composed of 265 motor-
bikes images with an homogeneous background. As
for the butterflies, motorbikes are an interesting case
where the shape and spatial disposition of the wheels,
body and engine parts are discriminative features. We
1
http://clade.ansp.org/entomology
2
http://vision.caltech.edu/archive.html
ColorObjectRecognitionbasedonSpatialRelationsbetweenImageLayers
431
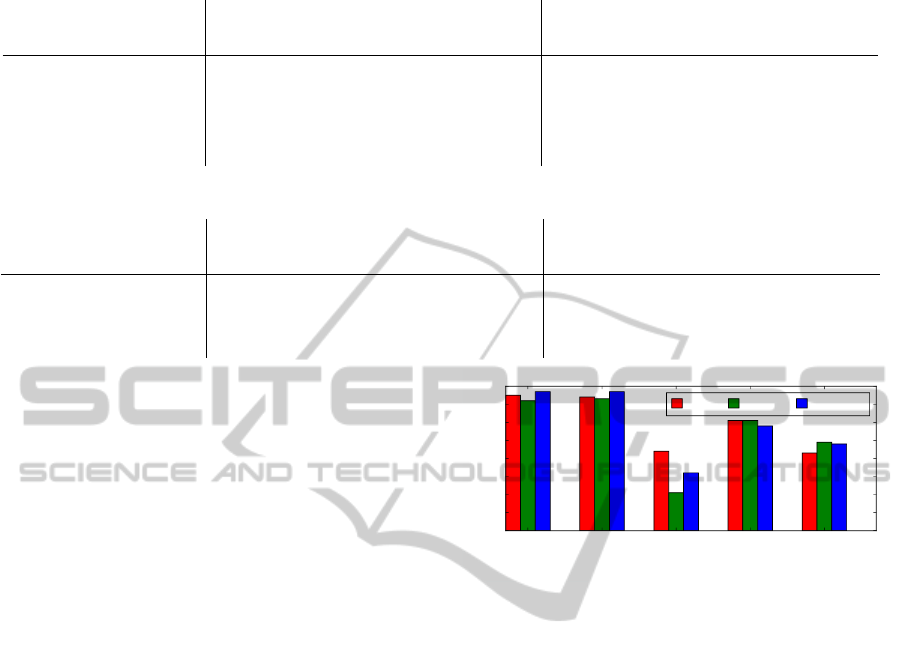
Table 1: Evolution of the recognition rate R for different decomposition methods, by varying the number of layers N.
R (Peale) R (Motorbikes)
Decomposition / N 2 3 4 5 6 2 3 4 5 6
Grayscale level-sets 26.1 30.7 31.9 37.4 40.8 65.2 59.1 58.1 55.6 63.1
Mean Shift (h
r
= 4) 42.8 45.0 44.0 42.8 45.0 69.8 70.9 63.8 63.8 63.0
Mean Shift (h
r
= 8) 47.5 35.8 42.1 38.4 35.5 67.2 64.9 63.0 54.0 54.3
Mean Shift (h
r
= 12) 39.9 32.4 36.2 31.1 25.2 65.3 63.4 67.2 67.2 66.0
Table 2: Evolution of the recognition rate R for the different matching strategies, by varying the number of layers N.
R (Peale) R (Motorbikes)
Matching strategy / N 2 3 4 5 6 2 3 4 5 6
Color-based 42.8 45.0 44.0 42.8 45.0 69.8 70.9 63.8 63.8 63.0
Greedy shape-based 41.2 45.0 34.3 34.3 30.8 67.9 64.9 62.6 54.0 54.3
Optimal shape-based 42.1 40.6 39.3 35.2 33.0 69.8 66.8 64.2 67.2 66.0
manually labeled the motorbikes into five categories:
cross, cruiser, moped, sport and standard.
3.2 Protocol and Setup
For each dataset, object recognition is performed us-
ing the nearest neighbor strategy. The label of the
closest image in the feature space spanned by FHDs
is assigned to the object to be recognized. We used
a leave-one-out cross validation strategy, that is, for
each test image, the remaining of the dataset serves as
training data. The quality of the results is then evalu-
ated using classical quality indexes: the global recog-
nition rate R , and the class-by-class F-Measure F1.
The robustness of our approach with regard to the
decomposition step has been evaluated by studying
the influence of the Mean Shift parameters (h
s
, h
r
and
M), as well as the number of clusters N used for K-
Means, producing different scales and levels of ob-
ject decompositions, and resulting in FHD descrip-
tors of different sizes. The minimum size of the re-
gions has been set to M = 100, and the spatial band-
width has also been set to h
s
= 8 (neighborhood of
17 × 17 pixels, see (Comaniciu and Meer, 2002)),
according to the average size of the images in the
datasets. For global evaluation, we assigned an equal
weight (α = 0.5 in Eq. 5) to shapes and spatial rela-
tions. The influence of this parameter is also studied
in a class-by-class manner. Besides, all F-Histograms
are computed along 180 directions, regularly span-
ning the [0,2π[ interval.
3.3 Results
Influence of the Decomposition Step. Tab. 1
presents the recognition rates obtained on the two
Class 1
(54 samples)
Class 2
(86 samples)
Class 3
(27 samples)
Class 4
(65 samples)
Class 5
(33 samples)
Label
0.0
0.1
0.2
0.3
0.4
0.5
0.6
0.7
0.8
F
1
score
Color Greedy Optimal
Figure 7: Class-by-class F
1
scores obtained for the three
matching strategies on the Motorbikes dataset.
datasets for different object decomposition methods.
The first row presents the results obtained by consid-
ering the original version of FHDs applied on gray-
level images using quantized level-sets (Garnier et al.,
2012). The remaining rows show the results obtained
by considering our extension of FHDs for color im-
ages. We observe that our extension performs better
than the original gray-levels version. This confirms
our hypothesis that considering a content-based de-
composition strategy yields more relevant image lay-
ers. Besides, according to the different Mean Shift
results, we can deduce that for these two specific
datasets, it is more suitable to adopt an oversegmen-
tation strategy.
Influence of the Matching Strategy. Tab. 2
presents the recognition rates for the different match-
ing strategies on the two datasets. The first row shows
the results obtained with the color-based matching
strategy while the remaining rows present the results
obtained with the shape-based matching strategies
(greedy and optimal). On the Peale dataset, we can
observe that the color-based strategy performs glob-
ally better than the shape-based ones for all values of
VISAPP2015-InternationalConferenceonComputerVisionTheoryandApplications
432
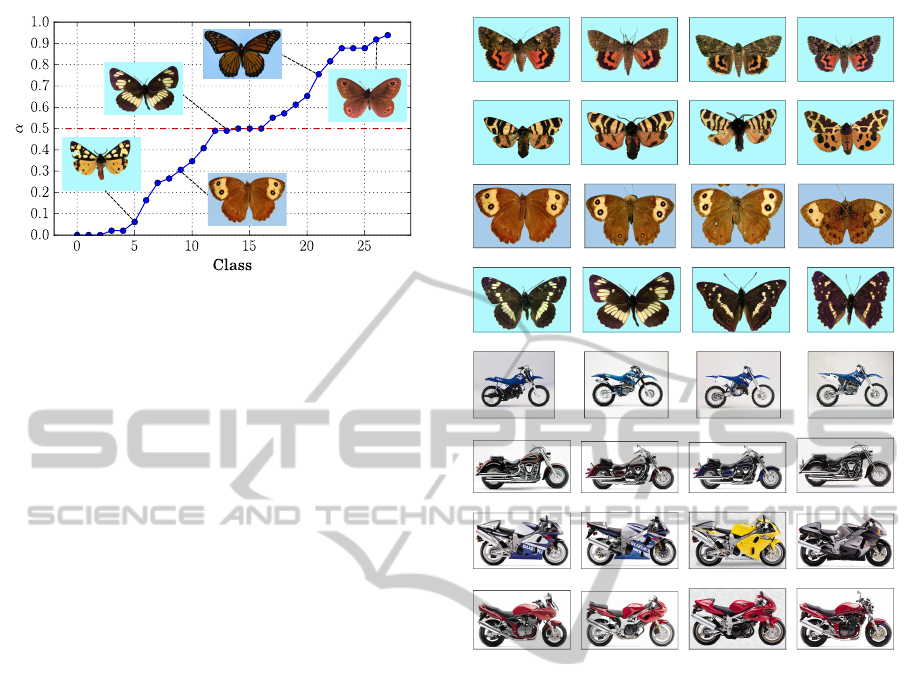
Figure 8: Best α weights obtained for each class of the Peale
dataset (with N = 3). Classes are sorted by increasing val-
ues of α. Lower values indicate a stronger weight on spatial
relations, while higher values indicate a stronger weight on
shape descriptions.
N. This may be due to the fact that for most species of
butterflies, the color of each layer is one of the most
discriminative feature. On the contrary, on the Motor-
bikes dataset the best scores are mostly obtained with
the optimal shape-based strategy. These results con-
firm that the shape-based strategy is more adapted to
recognize objects where color is less discriminative.
On this dataset, the greedy version of the shape-based
matching produces comparable results to the optimal
one, but with a much lower computational cost. Fig. 7
also present the class-by-class F
1
scores obtained for
the different matchings on the Motorbikes dataset,
showing notably that the greedy strategy does not al-
ways perform worse than the optimal one.
Influence of the α Parameter. We also studied the
impact of the parameter α representing the weight
given to shapes compared to spatial relations (see
Eq. 5). Instead of setting α = 0.5 as in the previous
experiments, we evaluated the best local weights for
each class of the dataset. We exhaustively computed
the class-by-class recognition results for varying val-
ues of α ∈ [0,1] with a step of 0.02. For each class
i, we record the α
i
values leading to the best local
recognition rate for this specific class. Fig. 8 presents
the result of this study on the Peale dataset. This fig-
ure highlights the idea that depending on the class,
spatial relations or shape descriptions can be more or
less discriminant features. Among the 28 classes of
this dataset, about one third is more oriented towards
spatial information, another third towards shape infor-
mation, and the rest is balanced between both.
Qualitative Evaluation. Fig. 9 shows some repre-
sentative object retrieval results. Color-based match-
ing was used on the Peale dataset (with N = 3), while
Query d = 3.98 d = 5.18 d = 6.29
Query d = 3.54 d = 4.72 d = 4.78
Query d = 6.47 d = 7.76 d = 7.89
Query d = 13.08 d = 15.83 d = 16.49
Query d = 14.81 d = 15.23 d = 15.28
Query d = 6.71 d = 7.65 d = 7.71
Query d = 5.59 d = 9.34 d = 9.67
Query d = 6.73 d = 7.13 d = 7.48
Figure 9: Retrieval results for the Peale and the Motorbikes
datasets. Query images are depicted in the left column. Dis-
similarity rankings go from lowest (left) to highest (right).
shape-based matching was used on the Motorbikes
dataset (with N = 4).
Comparative Study. We compared the results ob-
tained in this study to the ones obtained with the
GFD (Zhang and Lu, 2002) and dSIFT (Bosch et al.,
2006) descriptors with the same experimental proto-
col. The GFD is derived by applying two-dimensional
Fourier transform on a polar-raster sampled image.
Note that GFDs exclusively encode shape informa-
tion. The computation of GFDs requires to set the ra-
dial and the angular resolutions (R and T). In our ex-
periments, GFDs are computed with R = 4 and T = 9,
thus giving a signature of 36 bins. Dense SIFTs are
extracted with a step of 16 pixels and at two scales,
4 and 8, giving both local information and a more
global one. For each keypoint of the query image,
the matching algorithm searches for the best keypoint
in the target image. If the resulting match gives a
good contrast, this point vote goes to the target image.
The finally matched image is the one with the highest
votes. Tab. 3 presents the recognition rates obtained
ColorObjectRecognitionbasedonSpatialRelationsbetweenImageLayers
433

Table 3: Recognition rates R for dSIFT, GFD and FHD.
GFD dSIFT FHD
Peale 28.6 43.4 47.5
Motorbikes 65.7 50.9 70.9
with these two methods, compared to the best results
obtained with FHD descriptors. The results obtained
with both GFDs and dSIFTs are slightly lower than
the ones obtained with the proposed color FHD de-
scriptors, showing that FHDs are more suited to rec-
ognize complex structured objects where spatial orga-
nization is a discriminative feature.
4 DISCUSSION
This article has introduced a novel approach for ob-
ject recognition in color images. The main original-
ity of this approach lies in the extension of an object
descriptor using both shape and relative spatial infor-
mation about the subparts of the object to be recog-
nized. These subparts are obtained by considering a
content-based decomposition relying on the combina-
tion of an image segmentation algorithm and a clus-
tering algorithm. This decomposition strategy makes
it possible to deal with the problem raised by the tex-
tural properties of the objects in color images. Exper-
imental validations on two datasets have shown that
describing objects with such shape and spatial rela-
tions features between structural image layers yields
interesting recognition results.
Our work presents some limitations. From a
methodological point of view, the image decomposi-
tion approach could be affected by the clustering step,
which is based on color information. For instance, if
different subparts of an object share the same color,
it will lead to inconsistent image decompositions. In
addition, the number of resulting clusters has to be set
a priori and can be not adapted to the described ob-
ject. From an applicative point of view, the datasets
used were relatively small and present high intra-class
variance making it difficult to accurately evaluate the
behavior of our method.
In the future, we plan to enhance the FHD de-
scriptor by considering a multi-layer strategy where
the number of layers extracted per image may be au-
tomatically adapted depending on the image content.
We also plan to involve this framework into biomedi-
cal object recognition tasks where the object of inter-
est can be mixed up with the background.
ACKNOWLEDGEMENTS
This work was sponsored by the French National Re-
search Agency project SPIRIT #11-JCJC-008-01.
REFERENCES
Andreopoulos, A. and Tsotsos, J. K. (2013). 50 Years of
object recognition: Directions forward. Comput. Vis.
Image Und., 117(8):827–891.
Bloch, I. (2005). Fuzzy spatial relationships for image pro-
cessing and interpretation: A review. Image Vision
Comput., 23(2):89–110.
Bloch, I. and Ralescu, A. L. (2003). Directional relative po-
sition between objects in image processing: A com-
parison between fuzzy approaches. Pattern Recogn.,
36(7):1563–1582.
Bosch, A., Zisserman, A., and Muoz, X. (2006). Scene clas-
sification via pLSA. In Proc. of ECCV 2006, volume
3954 of LNCS, pages 517–530.
Comaniciu, D. and Meer, P. (2002). Mean shift: A robust
approach toward feature space analysis. IEEE Trans.
Pattern Anal. Mach. Intell., 24(5):603–619.
Delaye, A. and Anquetil, E. (2011). Fuzzy relative posi-
tioning templates for symbol recognition. In Proc. of
IEEE ICDAR 2011, pages 1220–1224.
Egenhofer, M. J. (1989). A formal definition of binary topo-
logical relationships. In Foundations of Data Organi-
zation and Algorithms, volume 367 of LNCS, pages
457–472.
Garnier, M., Hurtut, T., and Wendling, L. (2012). Object
description based on spatial relations between level-
sets. In Proc. of IEEE DICTA 2012, pages 1–7.
Inglada, J. and Michel, J. (2009). Qualitative spatial reason-
ing for high-resolution remote sensing image analysis.
IEEE Trans. Geosci. Remote Sens., 47(2):599–612.
Matsakis, P. and Wendling, L. (1999). A new way to repre-
sent the relative position between areal objects. IEEE
Trans. Pattern Anal. Mach. Intell., 21(7):634–643.
Morales-Gonz
´
alez, A. and Garc
´
ıa-Reyes, E. (2013). Sim-
ple object recognition based on spatial relations and
visual features represented using irregular pyramids.
Multimed. Tools Appl., 63(3):875–897.
Santosh, K., Lamiroy, B., and Wendling, L. (2012). Symbol
recognition using spatial relations. Pattern Recogn.
Lett., 33(3):331–341.
Zhang, D. and Lu, G. (2002). Shape-based image retrieval
using Generic Fourier Descriptor. Signal Process. Im-
age, 17(10):825–848.
VISAPP2015-InternationalConferenceonComputerVisionTheoryandApplications
434
