
Spectral and Time Domain Parameters for The Classification of
Atrial Fibrillation
Diana Batista
1
and Ana Fred
1,2
1
Instituto Superior Técnico, University of Lisbon, Avenida Rovisco Pais, 1, 1049-001 Lisboa, Portugal
2
Instituto de Telecomunicações, Avenida Rovisco Pais, 1, 1049-001 Lisboa, Portugal
Keywords: Atrial fibrillation, ECG, Wavelet, Pattern Analysis, Artificial Neural Network, k-Nearest Neighbours,
Support Vector Machine.
Abstract: Atrial fibrillation (AF) is the most common type of arrhythmia. This work presents a pattern analysis
approach to automatically classify electrocardiographic (ECG) records as normal sinus rhythm or AF. Both
spectral and time domain features were extracted and their discrimination capability was assessed
individually and in combination. Spectral features were based on the wavelet decomposition of the signal
and time parameters translated heart rate characteristics. The performance of three classifiers was evaluated:
k-nearest neighbour (kNN), artificial neural network (ANN) and support vector machine (SVM). The MIT-
BIH arrhythmia database was used for validation. The best results were obtained when a combination of
spectral and time domain features was used. An overall accuracy of 99.08 % was achieved with the SVM
classifier.
1 INTRODUCTION
An electrocardiogram (ECG) is a recording of the
heart’s electrical activity. This recording can be
obtained in a non-invasive manner by placing
electrodes on the surface of the chest. The basic
components of the ECG waveform are depicted in
Figure 1. The RR interval, time period between
consecutive R waves, is used to compute the heart
rate. Its regularity / irregularity is one of the first
steps when analysing an ECG strip.
Figure 1: Basic components of the ECG waveform (Huff,
2006).
Besides the standard 12-lead ECG, widely used
in clinical practice, a number of other cardiac
monitoring tools have been developed in the last few
decades. Portable ECG devices that allow the
diagnosis of arrhythmias (disturbances in rate,
rhythm, or conduction) include Holter monitors,
mobile cardiac outpatient telemetry systems, event
recorders and patch monitors. An enormous amount
of data can be collected by such devices and it is
therefore essential to develop algorithms that aid in
the analysis of the records.
The problem of automatic detection of
arrhythmic events from ECG records has been
largely addressed. Many authors have focused on the
classification of beat types and, to a lesser extent,
rhythm classification has also been attempted. The
types of beats / rhythms included and the
methodologies adopted vary widely. A truthful
comparison of the results is rather difficult since
databases used for validation are not always
publically available.
In this paper we present an algorithm that
distinguishes between normal sinus rhythm and the
most common arrhythmia, atrial fibrillation (AF).
Regarding the type of features, our focus is on
spectral and time-domain parameters. Individual and
combined assessment of these types of features are
carried out. The performance of three different
329
Batista D. and Fred A..
Spectral and Time Domain Parameters for The Classification of Atrial Fibrillation.
DOI: 10.5220/0005283403290337
In Proceedings of the International Conference on Bio-inspired Systems and Signal Processing (BIOSIGNALS-2015), pages 329-337
ISBN: 978-989-758-069-7
Copyright
c
2015 SCITEPRESS (Science and Technology Publications, Lda.)

classifiers is compared and the MIT-BIH arrhythmia
database is used to validate the algorithm.
The remaining of this paper is organized as
follows. In section 2 a brief review of the state-of-
the-art concerning automatic beat / rhythm
classification from ECG records is offered.
Extracted features, validation process and classifiers
used are detailed in section 3. In section 4 the results
obtained are presented and discussed. Finally,
section 5 contains the conclusions.
2 STATE-OF-THE-ART
In the last few decades a considerable effort was
dedicated to develop methods for automatic analysis
of ECG records. A large number of algorithms were
developed to differentiate between different types of
beats. The problem of detection and classification of
arrhythmic rhythms was also addressed. All these
studies vary widely in terms of features extracted
from the ECGs and classification scheme.
Temporal and morphological information were
often combined to classify different beat types.
(Chazal et al., 2004) used RR interval features,
heartbeat interval features and ECG morphology
features to distinguish between 5 beat types. Linear
discriminants were used for classification with an
overall accuracy of 84.5 %. Ectopic and normal
beats were considered in (Iliev et al., 2007) where
the features consisted of a QRS pattern matrix and
the deviation of RR interval from the mean RR
interval. Sensitivity and specificity values of,
respectively, 99.81 % and 98.87 % were reported.
(Silipo and Marchesi, 1998) used an artificial neural
network structured as an autoassociator with inputs
based on beat morphology and RR interval features.
Recognition rates of 99 %, 96 % and 75 % were
obtained respectively for normal beats, ventricular
ectopic beats and supraventricular ectopic beats.
To distinguish between normal sinus rhythm and
AF ECG records, many authors have focused solely
on features related with the heart rate. (Moody and
Mark, 1983) and later (Artis et al., 1991) developed
algorithms based on RR interval analysis. The first
approach used Markov process models whilst the
second achieved better results with an artificial
neural network (sensitivity and specificity values of,
respectively, 92.86 % and 92.34 % were reached).
(Tateno and Glass, 2001) constructed standard
density histograms of RR and ΔRR intervals
(difference between two successive RR intervals).
The performance of the coefficient of variation test
and the Kolmogorov-Smirnov test was compared.
When using the Kolmogorov-Smirnov test based on
the ΔRR intervals, a sensitivity of 94.4 % and a
specificity of 97.2 % were achieved with the MIT-
BIH atrial fibrillation database. More recently, the
density histogram of ΔRR intervals was used to
construct the ΔRR interval distribution difference
curve (Huang et al., 2011). That is, the difference
between the distribution of RR intervals before and
after the current RR interval. The authors proceeded
to detect and determine the boundaries of AF events.
Using the same database, sensitivity and specificity
values of 96.1% and 98.1%, respectively, were
obtained.
In (Park et al., 2009) the dynamics of inter-beats
intervals were analysed using a Poincaré plot. The
number of clusters in the plot, the mean stepping
increment of inter-beat intervals and the dispersion
of the points around a diagonal line were used, in
combination with a support vector machine
classifier. The authors reported specificity and
sensitivity values of, respectively, 92.9 % and 91.4
%.
(Dash et al., 2009) used three statistical measures
to deal with the variability, randomness and
complexity of the heart beat intervals sequence. The
root mean square of successive RR differences, the
Turning Points Ratio and Shannon entropy were
employed to detect onset of AF and non-AF.
Sensitivity and specificity values above 90 % were
achieved both with the MIT-BIH atrial fibrillation
and arrhythmia databases.
(Langley et al., 2012) showed the effectiveness
of detecting AF in short duration beat interval
recordings. Three algorithms were evaluated:
coefficient of variation, mean successive difference
and coefficient of sample entropy. The latter
achieved a sensitivity of 95.2 % and a specificity of
93.4 %, with 10 seconds recordings.
(Yang et al., 1994) used not only RR-based
features, but also other observations and measures
from 12-lead ECGs, and studied the performance of
deterministic logic and artificial neural networks
classifiers. The best results were obtained with the
artificial neural network for which sensitivity and
specificity reached values of 92.0 % and 92.3 %
respectively. In (Kaiser et al., 2010) a decision tree
classifier was used with features extracted from the
RR interval tachogram. The authors reported a
sensitivity of 99.1 % and a specificity of 88.3 %.
Frequency analysis methods were also used in
the feature extraction process. The more traditional
Fourier transform was naturally explored (Clayton et
al., 1994) but more attention has been paid to
wavelet transform which allows a multi-scale
decomposition and overcomes some drawbacks in
terms of frequency resolution. Energy parameters
derived from the wavelet transform were used both
in (Khadra et al., 1997) and (Al-Fahoum and Howitt,
1999) to distinguish between 4 rhythm types
BIOSIGNALS2015-InternationalConferenceonBio-inspiredSystemsandSignalProcessing
330
recurring respectively to a set of rules and a neural
network. The latter study achieved a better
performance with an overall accuracy of 97.5 %. A
beat by beat classification was attempted in (Güler,
2005) using a combined neural network model and
statistical features from the wavelet decomposition.
Four beat types were considered and an overall
classification rate of 96.94 % was reached. (Kara
and Okandan, 2007) computed the power spectral
density of each wavelet scale and average values
over sub-bands were fed to an artificial neural
network to distinguish between normal sinus rhythm
and AF records. An accuracy of 100 % was achieved
on a small, private, database. (Martis et al., 2012)
compared the performance of support vector
machines, neural network and Gaussian mixture
model in the distinction of normal and 12 different
beat types. Features were obtained after a feature
selection method was applied to the wavelet
coefficients. The support vector machine performed
better with an accuracy of 95.60 %.
Feature sets containing both wavelet-based
features and heart rate information have also been
used for beat classification with promising results
(Inan et al., 2006; Prasad and Sahambi, 2003; Shen
et al., 2012; Ye et al., 2012). The types of beats
included in the analysis varied but all these studies
include in their feature sets wavelet coefficients and
RR-related information. Neural networks and
support vector machines were the preferred
classifiers.
The different tasks addressed by the cited
studies, in terms of beats or rhythms included in the
analysis, hamper a truthful comparison of the
algorithm’s performance. Furthermore, although the
MIT-BIH arrhythmia database is commonly used for
validation, some authors opt for using databases that
are not publically available.
In this paper 60 seconds ECG records are
considered. We attempt to distinguish between
rhythm types independently of the occurrence of a
particular beat (e.g. a normal sinus rhythm segment
may contain a premature ventricular contraction).
The MIT-BIH arrhythmia database is used for
validation.
3 METHODOLOGY
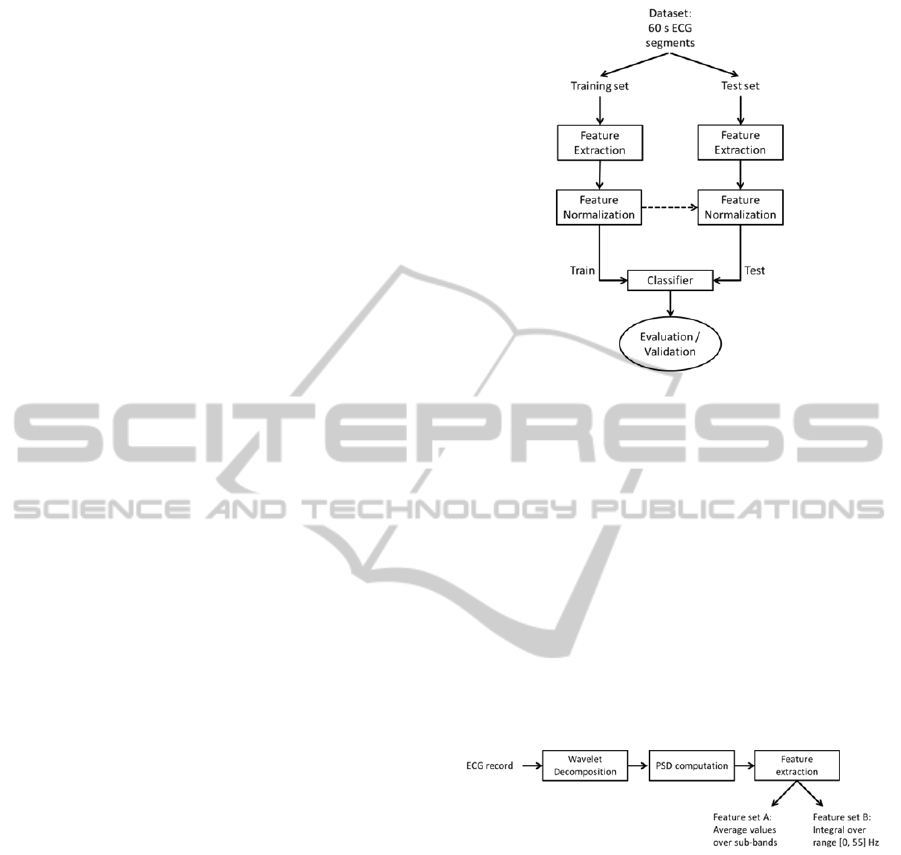
The methodology proposed in this paper is
schematized in Figure 2, encompassing the
following steps: feature extraction, feature
normalization, classifier training and testing. In the
following subsections we will detail these steps.
Figure 2: Automatic signal analysis methodology.
3.1 Feature Extraction
Two types of features were explored in this analysis:
spectral parameters, derived from the wavelet
decomposition of the ECG signals; and time domain
parameters, translating heart rate characteristics.
3.1.1 Spectral parameters
Spectral parameters were extracted following the
scheme shown in Figure 3. The power spectral
density (PSD) of the wavelet decomposition of the
signals was computed and two different feature sets
were constructed.
Figure 3: Feature extraction process of the spectral
parameters.
Signals were decomposed until the sixth level
using the quadratic spline wavelet, depicted in
Figure 4. Details of this wavelet function and the
coefficients of the corresponding finite impulse
response filters are given in (Mallat and Zhong,
1992). Figure 5 shows a 10 s extract of the
decomposition of a normal sinus rhythm ECG. The
decomposition was achieved with the redundant
discrete wavelet transform (RDWT), or algorithme à
trous (Fowler, 2005).
SpectralandTimeDomainParametersforTheClassificationofAtrialFibrillation
331
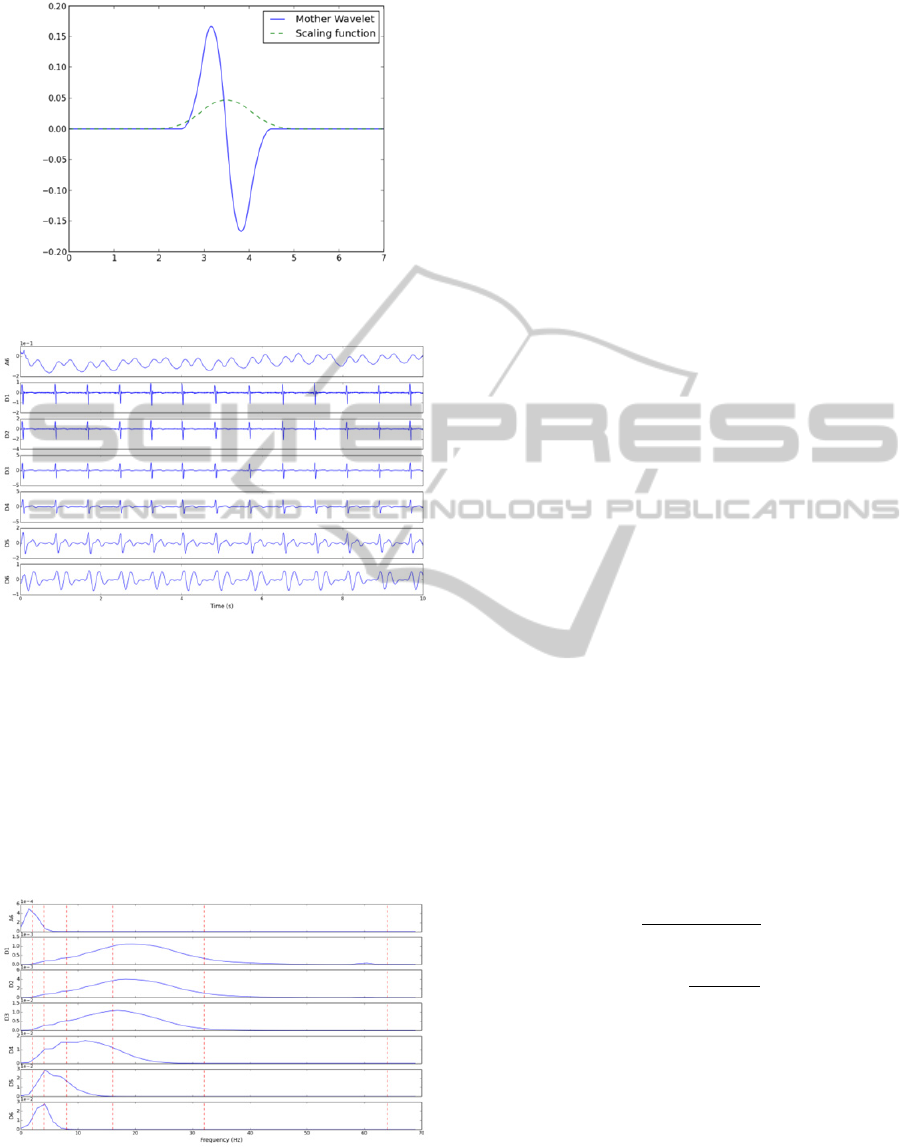
Figure 4: Mother wavelet and scaling function of the
quadratic spline wavelet.
Figure 5: Approximation (A6) and detail (D1 to D6)
coefficients of the wavelet decomposition of a 10 s normal
sinus rhythm ECG.
For each one of the 7 signals, corresponding to
the coefficients of 6 detail and one approximation
signals, the PSD was computed. Welch’s method,
relying upon the concept of modified periodograms,
was adopted (Welch, 1967). Segments of 256
samples with 50 % overlap were used and a Hanning
window was employed. Figure 6 depicts the PSD of
the signals shown previously.
Figure 6: PSD of each one of the approximation (A6) and
detail (D1 to D6) wavelet coefficients. Dotted red lines
delimitate the sub-bands of feature set A.
Two feature sets of wavelet-based features were
extracted:
For each one of the 7 PSD signals, the
average value of the PSD over predefined sub-
bands was computed. The 6 sub-bands considered
were: [0, 2]; [2, 4]; [4, 8]; [8, 16]; [16, 32]; and
[32, 64] Hz. These sub-bands are depicted in
Figure 6. This feature set, henceforth referred to as
feature set A, contains therefore 42 features (6
values for each one of the 7 signals). The same
features are referred by Kara et al. (2007).
For each one of the 7 PSD signals, the
integral over the range [0, 55] Hz was calculated.
This computation was performed using the
trapezoidal rule. A total of 7 features are in this
way selected to represent each pattern. This feature
set shall be referred to as feature set B.
3.1.2 Time parameters
To complement the information given by the
spectral features, two time domain parameters were
selected: average RR interval and standard deviation
of RR intervals. These ought to be particularly
interesting in the distinction of AF and normal
rhythm due to the inherent irregularity of AF.
Feature set C contains these two parameters.
3.2 Feature Normalization
An important step in classification tasks is feature
normalization. This can highly influence the
classifier’s performance. Once the dataset was
divided into training and test sets, features from the
training set were normalized and the same
transformation was then applied to the test set. Two
normalization schemes were considered: feature
scaling to the range [0, 1] and feature
standardization. These operations are detailed in
Equations (1) and (2).
x
xminx
maxx minx
(1)
x
x
μ
x
σx
(2)
3.3 Classifiers
The performance of three supervised learning
classifiers was assessed: k-nearest neighbour (kNN),
multilayer perceptron (MLP) and support vector
machine (SVM). The kNN classifier simply assigns
to a new pattern the label of the majority of the k
closest neighbours. The Euclidian distance was used
as a measure of similarity between patterns, and all
features were weighted equally.
BIOSIGNALS2015-InternationalConferenceonBio-inspiredSystemsandSignalProcessing
332

MLPs are the most common type of artificial
neural networks (ANNs). The network first goes
through a learning stage when labelled patterns are
presented to it and weights between neurons are
adjusted according to the desired output. Further
details about MPs, the backpropagation training
algorithm and acceleration techniques can be found
in (Beale and Fiesler, 1997). Here, a single hidden
layer was used and the most suitable number of
neurons in this layer was found for each
classification task. The activation function used in
this analysis was the logic sigmoid and a momentum
term of 0.1 was used to accelerate the training phase.
In the last few years SVMs have become
increasingly popular on the nonlinear classification
of patterns. By using the so-called kernel trick, data
is mapped unto a higher dimension where it can be
linearly separated (Fletcher, 2009). The radial basis
function kernel, given by equation 3 and dependent
on the kernel parameter , was used in this analysis.
The penalty parameter , which controls the trade-
off between smoothness of the decision boundary
and misclassifications, takes also a user-defined
value. These parameters were experimentally tuned
for best performance.
k
,
e
(3)
3.4 Validation setup
Cross-validation was implemented to test the
algorithm. A stratified 4-fold cross-validation was
used: for each one of the 4 possible combinations, 3
folds were used as training data and the fourth
served as test. This process was repeated for 50 runs,
and for each run a balanced dataset was generated by
randomly sampling on the existing data.
To evaluate the classifier’s performance a couple
of accuracy measures, besides the error rate, were
computed. Using the usual notation for true
positives, true negatives, false positives and false
negatives (that is TP, TN, FP and FN) we can define
the precision (or positive predictive value) and the
recall (or sensitivity) as shown in equations (4) and
(5). The F
1
score, also known as F-score or F-
measure, is the harmonic mean of precision and
sensitivity and can be obtained by equation (6).
Precision
TP
TP FP
(4)
Recall
TP
TP FN
(5)
F
2TP
2TP FP FN
(6)
4 RESULTS AND DISCUSSION
4.1 Database Characterization
The algorithm was tested using records from the
MIT-BIH arrhythmia database (Moody and Mark,
2001). A total of 48 two-channel Holter records are
available, each approximately 30 minutes long. The
upper signal is usually a modified limb lead II
(MLII) but occasionally a modified lead V5. The
lower signal is most often a modified lead V1
(occasionally V2 or V5, and in one instance V4). All
signals were digitized at a sample rate of 360 Hz.
The database includes different sets of annotations
verified by more than one cardiologist. All beats are
identified and labelled according to their type (i.e.
normal beat, premature ventricular contraction…).
Annotations that mark the beginning of a rhythm
type are also available.
For this analysis only MLII records were used
(records number 102 and 104 were therefore
excluded). In order to perform rhythm classification
each record was split into multiple segments
according to rhythm annotations. Additional cuts
were made in a non-overlapping manner to obtain
segments of predefined length (60 s). A total of 911
normal sinus rhythm and 98 atrial fibrillation
segments were obtained in this manner. For the
features based on the location of the R peaks, the
position annotations present on the database were
used. This assures that the performance of the
algorithm is not affected by possible mistakes on the
detection of the peaks.
4.2 Experimental Results
The experimental results obtained with the different
feature sets and with combinations of features sets
are presented next. For each experiment, multiple
tests were performed in order to choose the most
suitable classifiers’ parameters and only the best
results are reported. For the ANN this consisted of
varying the number of neurons in the hidden layer.
For the kNN we varied the number of neighbours
considered for classification, . Regarding the SVM,
the penalty parameter, , and the kernel parameter,
, were varied in a logarithmic scale, respectively
between [10
-2
, 10
8
] and [10
-5
, 10
3
]. Chosen
parameters were the ones that ensured a smaller test
error.
For both the kNN and the ANN classifiers the
two types of normalization schemes were attempted.
Feature standardization was applied for the SVM
classifier.
SpectralandTimeDomainParametersforTheClassificationofAtrialFibrillation
333

4.2.1 Experimental results based on RR
features
A first attempt was made to distinguish between
normal sinus rhythm and AF ECG segments relying
only on heart rate related features (feature set C).
The classifiers’ parameters that led to the best
performance are summarized in Table 1. For the
ANN the best result corresponded to standardized
features with 10 neurons in the hidden layer. For the
kNN classifier the best performance was achieved
when features were standardized and three
neighbours were considered. Concerning the SVM
classifier, values of 1 and 10 respectively for the
penalty, , and kernel, , parameters led to a more
successful classification.
The results obtained for the three classifiers are
summarized in Table 2, showing mean values and
standard deviations. We highlighted in bold the
highest values of precision, recall and F-score for
each class and the minimum test error achieved.
Overall, the SVM classifier was the one that
performed better, achieving a test error of 4.53 ±
1.50 %. ANN and kNN classifiers have a similar
performance in terms of test error. For the ANN it is
interesting to note that precision and recall values
respectively for normal and AF rhythms are
considerably high (approximately 99 %).
4.2.2 Experimental results based on spectral
features
Average PSD values
The results obtained using as features only the
average PSD over the 6 sub-bands (feature set A) are
shown in Table 3. The classifiers’ parameters that
led to these results are given in Table 1.
The best results were obtained with the SVM
classifier.
Large range power features
The best results obtained when using as features the
integral of the PSD of the wavelet decomposition
(feature set B) are presented in Table 4. Table 1
summarizes the corresponding classifiers’
parameters.
It is clear that the SVM classifier offered the best
results whilst the performance of the ANN was
considerably worst.
Table 1: Best classifiers' parameters for each classification task.
Feature set Classifier Normalization Parameters
A
ANN Scaling 55 Hidden Neurons
kNN Standardization
1
SVM Standardization
10
; 10
B
ANN
Standardization
15 Hidden Neurons
kNN
1
SVM
10
; 1
C
ANN
Standardization
10 Hidden Neurons
kNN
3
SVM
1 ; 10
A + C
ANN Scaling 35 Hidden Neurons
kNN Scaling
1
SVM Standardization
10
; 10
B + C
ANN
Standardization
14 Hidden Neurons
kNN
1
SVM
10 ; 1
Table 2: Results obtained with feature set C.
Classifier Rhythm Precision (%) Recall (%) F-score (%) Test error (%)
ANN
Normal
98.66 ± 1.00 90.31 ± 1.86 94.21 ± 1.22
5.49 ± 1.15
Atrial Fibrillation 91.27 ± 1.62
98.72 ± 0.98
94.78 ± 1.08
kNN
Normal
97.93 ± 1.34 91.4 ± 2.61 94.44 ± 1.77
5.31 ± 1.65
Atrial Fibrillation 92.19 ± 2.22 97.98 ± 1.34 94.90 ± 1.55
SVM
Normal
96.79 ± 1.41 94.23 ± 2.20 95.39 ± 1.55
4.53 ± 1.50
Atrial Fibrillation
94.56 ± 2.01
96.71 ± 1.50
95.53 ± 1.47
BIOSIGNALS2015-InternationalConferenceonBio-inspiredSystemsandSignalProcessing
334
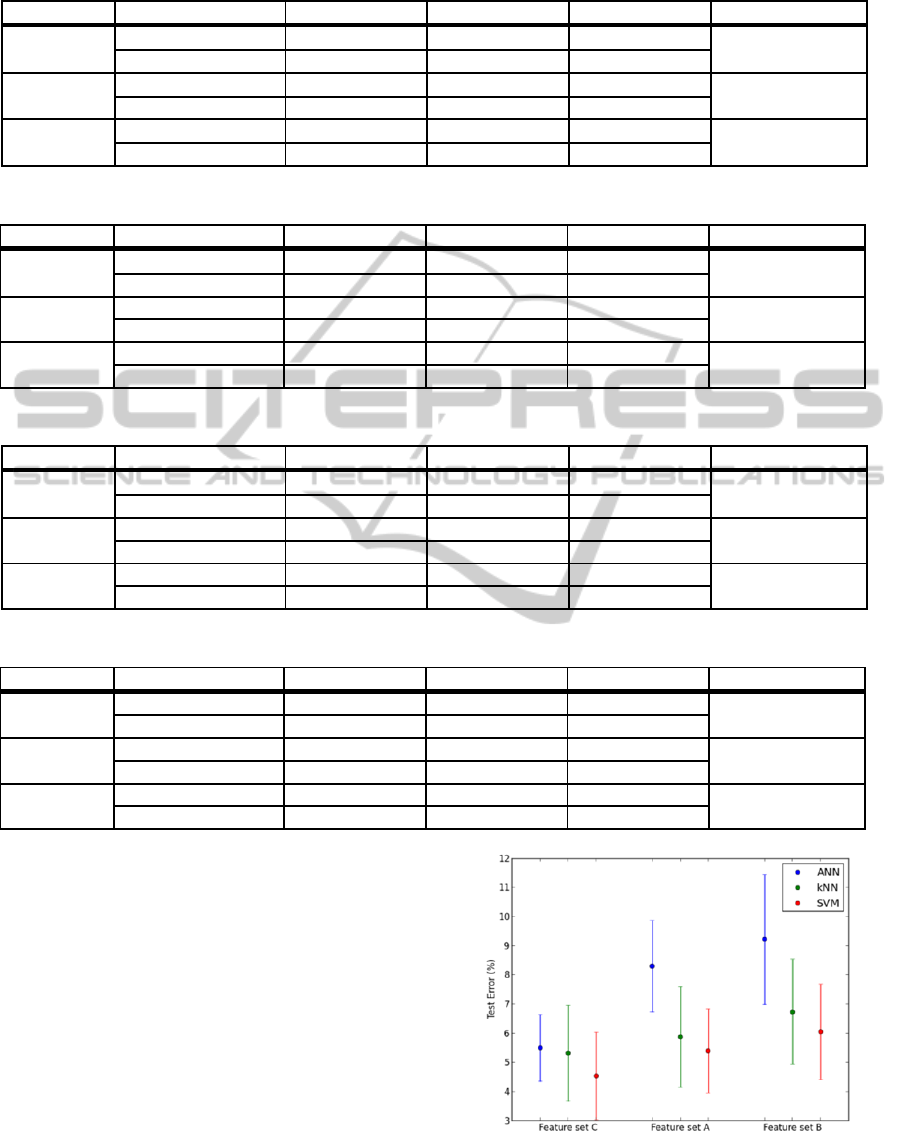
Table 3: Results obtained with feature set A.
Classifier Rhythm Precision (%) Recall (%) F-score (%) Test error (%)
ANN
Normal
96.90 ± 1.83 86.36 ± 3.08 91.06 ± 1.83
8.29 ± 1.57
Atrial Fibrillation 88.18 ± 2.28 97.07 ± 1.84 92.24 ± 1.41
kNN
Normal
96.92 ± 1.11 91.27 ± 3.08 93.87 ± 1.88
5.87 ± 1.72
Atrial Fibrillation 92.04 ± 2.62
96.99 ± 1.15
94.35 ± 1.60
SVM
Normal
95.56 ± 1.62 93.77 ± 2.00 94.54 ± 1.46
5.39 ± 1.44
Atrial Fibrillation
94.10 ± 1.85
95.45 ± 1.70
94.66 ± 1.44
Table 4: Results obtained with feature set B.
Classifier Rhythm Precision (%) Recall (%) F-score (%) Test error (%)
ANN
Normal
95.24 ± 2.30 86.16 ± 3.60 90.18 ± 2.49
9.21 ± 2.23
Atrial Fibrillation 87.83 ± 2.84 95.41 ± 2.33 91.26 ± 2.06
kNN
Normal 96.73 ± 1.31 89.70 ± 3.38 92.91 ± 2.01
6.73 ± 1.80
Atrial Fibrillation 90.75 ± 2.80
96.84 ± 1.31
93.56 ± 1.63
SVM
Normal
96.74 ± 1.46 91.13 ± 2.67 93.70 ± 1.76
6.04 ± 1.64
Atrial Fibrillation
91.93 ± 2.31
96.78 ± 1.49
94.17 ± 1.55
Table 5: Results obtained with feature sets A + C.
Classifier Rhythm Precision (%) Recall (%) F-score (%) Test error (%)
ANN
Normal
99.17 ± 0.95 94.55 ± 2.57 96.73 ± 1.58
3.13 ± 1.46
Atrial Fibrillation 94.98 ± 2.22
99.19 ± 0.93
96.98 ± 1.37
kNN
Normal 98.29 ± 0.72 94.35 ± 2.48 96.19 ± 1.38
3.67 ± 1.27
Atrial Fibrillation 94.77 ± 2.17 98.31 ± 0.72 96.44 ± 1.19
SVM
Normal 98.23 ± 1.23
96.69 ± 2.05 97.39 ± 1.40
2.55 ± 1.33
Atrial Fibrillation
96.89 ± 1.80
98.20 ± 1.25
97.49 ± 1.28
Table 6: Results obtained with feature sets B + C.
Classifier Rhythm Precision (%) Recall (%) F-score (%) Test error (%)
ANN
Normal
99.36 ± 0.58
94.67 ± 2.30 96.89 ± 1.26
2.98 ± 1.16
Atrial Fibrillation 95.11 ± 1.98
99.37± 0.57
97.14 ± 1.08
kNN
Normal 99.06 ± 0.60 95.75 ± 2.10 97.31 ± 1.17
2.60 ± 1.10
Atrial Fibrillation 96.07 ± 1.85 99.04 ± 0.67 97.48 ± 1.04
SVM
Normal 98.64 ± 0.83
99.59 ± 0.64 99.10 ± 0.64
0.92 ± 0.66
Atrial Fibrillation
99.61 ± 0.62
98.57 ± 0.92
99.06 ± 0.68
One can refer to Figure 7 to compare the results
of the three sets of features. Considering the
wavelet-based feature sets, we can note that the
performance of all classifiers declined when using
the large range power features. This can possibly be
explained by some loss of information due to the
reduction of the feature set from 42 to 7 features.
However it is worth mentioning that this reduction
considerably diminishes the training time. Among
all feature sets, the time domain features allow a
better differentiation between normal sinus rhythm
and AF segments. In the next section an attempt to
improve classifiers’ performance by combining
different types of features is explored.
Figure 7: Means and standard deviations of the test errors
for feature sets C, A and B.
SpectralandTimeDomainParametersforTheClassificationofAtrialFibrillation
335
4.2.3 Experimental results based on
combination of features
Average PSD values + time parameters
Average values over sub-bands were combined with
average RR and standard deviation of RR intervals
to construct a new feature set (feature set A + C).
The best results obtained and the corresponding
classifiers’ parameters are summarized respectively
in Table 5 and Table 1.
The SVM classifier was the one that achieved
the best performance reaching a test error of 2.55 ±
1.33 %. Contrary to what happened when using
solely RR or wavelet based features, the ANN
performed better than the kNN classifier.
Large range power features + time
parameters
A feature set containing 9 features was constructed
by combining integral values of the PSD with RR-
based features (feature set B + C). The results
obtained for the three classifiers are presented in
Table 6. Table 1 shows the corresponding
classifiers’ parameters.
The accuracy of the SVM classifier reached a
value higher than 99 %. The performance of the
kNN surpassed the one of the ANN.
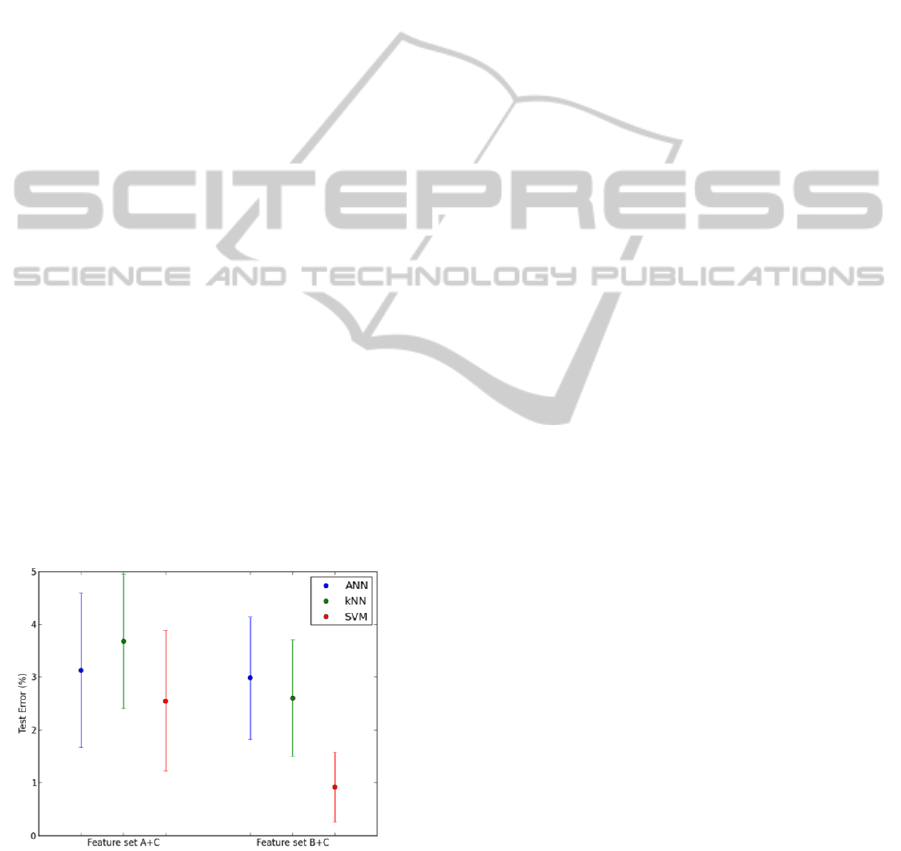
By comparing the results obtained here with the
ones obtained previously, we can conclude that the
combination of wavelet and RR-based features is
beneficial for all three classifiers. Furthermore, the
feature set constructed with integral values of the
PSD of the wavelet decomposition, average RR and
standard deviation of RR intervals offers the most
promising results. This is made clear in Figure 8.
Figure 8: Means and standard deviations of the test errors
for feature sets A + C and B + C.
In all cases studied the SVM classifier
outperformed the results of the other two classifiers.
Despite its more complex formulation and its ability
to model nonlinear data, the ANN classifier was
often surpassed by the much simpler kNN classifier.
Moreover we noted that the training time required
by the ANN largely exceeded that of kNN and
SVM.
5 CONCLUSIONS
This paper addressed the problem of classification of
60 seconds one-lead ECG segments as AF or normal
sinus rhythm. The PSD of the wavelet
decomposition of the signal at all scales was
computed and two sets of features were extracted.
An additional feature set containing average RR and
standard deviation of RR intervals was considered.
We compared the performance of three supervised
learning classifiers on this classification task, using
benchmarked data from the MIT-BIH arrhythmia
database.
A first analysis of the feature sets considered
individually demonstrated the superior
discrimination capability of heart rate related
features when compared to wavelet-based features.
This was true for all three classifiers. Better
performances could be obtained when combining the
two types of features. An accuracy of 99.08 % was
achieved with the SVM classifier whilst kNN and
ANN could not reach such a good performance
(accuracies of 97.40 and 97.02 % respectively).
Interesting tests could be performed to try to
improve classifiers’ performance. Here we used the
quadratic spline wavelet and decompose the signal
until the sixth level. A more systematic procedure
could have been undertaken to choose the most
suitable wavelet function. It should be mentioned
that a few tests were performed with Daubechies 10
wavelets but the results were poorer. The
decomposition level may also be varied. Another
interesting test would be to assess the accuracy of
the classifiers with segments of different lengths.
In this paper we restricted our analysis to the
distinction of AF and normal sinus rhythm ECG
records. Although AF is the most common
arrhythmia one could argue that it would be more
realistic to include other types of rhythms in this
classification task. Ongoing work addresses this
issue by including additional arrhythmias.
ACKNOWLEDGMENTS
This work was partially funded by Fundação para a
Ciência e Tecnologia (FCT) under grant PTDC/EEI
- SII/2312/2012, whose support the authors
gratefully acknowledge.
BIOSIGNALS2015-InternationalConferenceonBio-inspiredSystemsandSignalProcessing
336

REFERENCES
Al-Fahoum, A. and Howitt, I. (1999). Combined wavelet
transformation and radial basis neural networks for
classifying life-threatening cardiac arrhythmias.
Medical & biological engineering & computing,
37(5), pp.566--573.
Artis, S., Mark, R. and Moody, G. (1991). Detection of
atrial fibrillation using artificial neural networks.
pp.173--176.
Beale, R. and Fiesler, E. (1997). Handbook of neural
computation. 1st ed. Bristol: Institute of Physics Pub.
Clayton, R., Murray, A. and Campbell, R. (1994).
Recognition of ventricular fibrillation using neural
networks. Medical and Biological Engineering and
Computing, 32(2), pp.217--220.
Dash, S., Chon, K., Lu, S. and Raeder, E. (2009).
Automatic Real Time Detection of Atrial Fibrillation.
Ann Biomed Eng, 37(9), pp.1701-1709.
De Chazal, P., O'Dwyer, M. and Reilly, R. (2004).
Automatic classification of heartbeats using ECG
morphology and heartbeat interval features.
Biomedical Engineering, IEEE Transactions on,
51(7), pp.1196--1206.
Fletcher, T. (2009). Support vector machines explained.
Tutorial paper. [online] Available at:
http://www.tristanfletcher.co.uk/. [Accessed 5 Nov.
2014]
Fowler, J. (2005). The redundant discrete wavelet
transform and additive noise. Signal Processing
Letters, IEEE, 12(9), pp.629--632.
Güler, I. (2005). ECG beat classifier designed by
combined neural network model. Pattern recognition,
38(2), pp.199--208.
Huang, C., Ye, S., Chen, H., Li, D., He, F. and Tu, Y.
(2011). A Novel Method for Detection of the
Transition Between Atrial Fibrillation and Sinus
Rhythm. IEEE Transactions on Biomedical
Engineering, 58(4), pp.1113-1119.
Huff, J. (2006). ECG workout. 1st ed. Ambler, PA:
Lippincott Williams & Wilkins.
Iliev, I., Krasteva, V. and Tabakov, S. (2007). Real-time
detection of pathological cardiac events in the
electrocardiogram. Physiological measurement, 28(3),
p.259.
Inan, O., Giovangrandi, L. and Kovacs, G. (2006). Robust
neural-network-based classification of premature
ventricular contractions using wavelet transform and
timing interval features. Biomedical Engineering,
IEEE Transactions on, 53(12), pp.2507--2515.
Kaiser, S., Kirst, M. and Kunze, C. (2010). Automatic
Detection of Atrial Fibrillation for Mobile Devices.
Springer, pp.258--270.
Kara, S. and Okandan, M. (2007). Atrial fibrillation
classification with artificial neural networks. Pattern
Recognition, 40(11), pp.2967--2973.
Khadra, L., Al-Fahoum, A. and Al-Nashash, H. (1997).
Detection of life-threatening cardiac arrhythmias using
the wavelet transformation. Medical and Biological
Engineering and Computing, 35(6), pp.626--632.
Langley, P., Dewhurst, M., Di Marco, L., Adams, P.,
Dewhurst, F., Mwita, J., Walker, R. and Murray, A.
(2012). Accuracy of algorithms for detection of atrial
fibrillation from short duration beat interval
recordings. Medical Engineering & Physics, 34(10),
pp.1441-1447.
Mallat, S. and Zhong, S. (1992). Characterization of
signals from multiscale edges. IEEE Transactions on
pattern analysis and machine intelligence, 14(7),
pp.710--732.
Martis, R., Krishnan, M., Chakraborty, C., Pal, S., Sarkar,
D., Mandana, K. and Ray, A. (2012). Automated
screening of arrhythmia using wavelet based machine
learning techniques. Journal of medical systems,
36(2), pp.677--688.
Moody, G. and Mark, R. (1983). A new method for
detecting atrial fibrillation using RR intervals.
Computers in Cardiology, 10, pp.227-230.
Moody, G. and Mark, R. (2001). The impact of the MIT-
BIH arrhythmia database. Engineering in Medicine
and Biology Magazine, IEEE, 20(3), pp.45--50.
Park, J., Lee, S. and Jeon, M. (2009). Atrial fibrillation
detection by heart rate variability in Poincare plot.
BioMed Eng OnLine, 8(1), p.38.
Prasad, G. and Sahambi, J. (2003). Classification of ECG
arrhythmias using multi-resolution analysis and neural
networks. 1, pp.227--231.
Shen, C., Kao, W., Yang, Y., Hsu, M., Wu, Y. and Lai, F.
(2012). Detection of cardiac arrhythmia in
electrocardiograms using adaptive feature extraction
and modified support vector machines. Expert Systems
with Applications, 39(9), pp.7845--7852.
Silipo, R. and Marchesi, C. (1998). Artificial neural
networks for automatic ECG analysis. Signal
Processing, IEEE Transactions on, 46(5), pp.1417--
1425.
Tateno, K. and Glass, L. (2001). Automatic detection of
atrial fibrillation using the coefficient of variation and
density histograms of RR and ΔRR intervals. Med.
Biol. Eng. Comput., 39(6), pp.664-671.
Welch, P. (1967). The use of fast Fourier transform for the
estimation of power spectra: a method based on time
averaging over short, modified periodograms. IEEE
Transactions on audio and electroacoustics, 15(2),
pp.70--73.
Yang, T., Devine, B. and Macfarlane, P. (1994). Artificial
neural networks for the diagnosis of atrial fibrillation.
Medical and Biological Engineering and Computing,
32(6), pp.615--619.
Ye, C., Kumar, B. and Coimbra, M. (2012). Heartbeat
classification using morphological and dynamic
features of ECG signals. Biomedical Engineering,
IEEE Transactions on, 59(10), pp.2930--2941.
SpectralandTimeDomainParametersforTheClassificationofAtrialFibrillation
337
