
Dynamic Response of Electrocardiographic Indices During Abrupt Heart
Rate Changes
Comparison between Young and Middle-aged Subjects
Marcos Javier Teperino
1
, Mar´ıa Paula Bonomini
1
, Pablo Daniel Cruces
1,2
and Pedro David Arini
1,2
1
Instituto de Ingenier´ıa Biom´edica, Facultad de Ingenier´ıa, Universidad de Buenos Aires, Buenos Aires, Argentina
2
Instituto Argentino de Matem´atica, ’Alberto P. Calder´on’ CONICET, Buenos Aires, Argentina
Keywords:
Ventricular Repolarization Dispersion, T-wave Morphology, Age.
Abstract:
Abnormal modifications in ventricular repolarization dispersion (VRD) have been shown to constitute a sub-
strate for malignant arrhythmias. In this work, we have induced abrupt heart rate (HR) changes to young
and middle-aged healthy subjects through a Tilt-test and have analyzed the evolution of several VRD indices.
Duration ones, based on electrocardiogram intervals; energy ones, developed through a Principal Components
Analysis (PCA) in T-wave; and the morphology ones, extracted feature from an absolute T-wave. In both
groups, results have shown significant decreases in early repolarization duration. These changes are responsi-
ble for the alterations in the total repolarization duration, because T-wave peak-to-end has not shown statistical
significance. Moreover, we have found significant decreases in total, early and late repolarization energy, and
in the T-wave amplitude. In another sense, we have observed that the repolarization energy obtained by PCA
jointly with early T-wave slope and amplitude have been able to reflect VRD differences between young and
middle-aged subjects. Finally, this work provides the range of values for VRD in normal conditions during
abrupt HR changes. Outside this range, we could assume that it exists a cardiac risk.
1 INTRODUCTION
The electrical inhomogeneities in the cardiac repolar-
ization process along the ventricular wall are usually
called ventricular repolarization dispersion (VRD).
Several works have shown that abnormal alterations
of VRD are associated with a higher risk of develop-
ing ventricular arrhythmias (Surawicz, 1997).
Some authors have shown that alterations in VRD
are correlated with changes in T-wave width (Fuller
et al., 2000). It has also shown that T-wave widening
can result from a differential shortening or lengthen-
ing of the action potential duration in both apex-base
and transmural (Arini et al., 2008).
The T-wave peak-to-end interval has been sug-
gested as a marker of transmural VRD (Zareba et al.,
2000; Antzelevitch et al., 2007; Smetana et al.,
2011), and so, the T-wave peak as an indicator of
the full repolarization of epicardium. The transla-
tion of this concept to the standard electrocardiogram
(ECG) is not straightforward, making it difficult to
interpret of the relationship between T-wave peak-to
end and transmural dispersion in a clinical population
(Smetana et al., 2011). Another study has shown that
during Valsalva maneuver the T-wave width shorten-
ing seems to result from a width reduction from the
onset to the T-wave peak rather than from the peak to
the T-wave end (Minchol´e et al., 2006).
Moreover, others have proposed repolarization in-
dices such as the QT interval (Pueyo et al., 2004)
or the T-wave peak-to-end interval (Minchol´e et al.,
2011) depend on heart rate (HR) and such dependence
has also been related to arrhythmic risk. However,
some researchers have objected the validity of these
two indices as markers of VRD (Malik et al., 2000;
Opthof et al., 2007) and have questioned their depen-
dence of HR (Andersen et al., 2008). It has also been
suggested that several morphological indices, such as
the slopes and the area of the T-wave, are independent
of HR (Merri et al., 1989).
On the other hand, several VRD descriptors based
on Principal Component Analysis (PCA) have been
used to differentiate normal and abnormal VRD pat-
terns (Zabel et al., 2002) and have been used to quan-
tify pathological characteristics of VRD at high HR
(Smetana et al., 2004).
Finally, some authors have found that most repo-
larization indices are independent of age (Merri et al.,
264
Javier Teperino M., Bonomini M., Cruces P. and Arini P..
Dynamic Response of Electrocardiographic Indices During Abrupt Heart Rate Changes - Comparison between Young and Middle-aged Subjects.
DOI: 10.5220/0005253102640269
In Proceedings of the International Conference on Bio-inspired Systems and Signal Processing (BIOSIGNALS-2015), pages 264-269
ISBN: 978-989-758-069-7
Copyright
c
2015 SCITEPRESS (Science and Technology Publications, Lda.)

1989). Nevertheless, others have shown that aging
modulates the normal VRD (Huang et al., 2010).
In the present work, we have analyzed the re-
sponse of several ECG indices to HR changes. So,
we have determined the range of normal values out-
side which we could assume that it exists a cardiac
risk. Finally, we have studied how aging might influ-
ence in the dynamic response of electrocardiographic
indices during abrupt HR changes.
2 METHODS
2.1 Database
A total of 17 subjects without previous cardiovascu-
lar diseases were retrospectively studied. Two groups
were selected: Young Subjects (8 subjects, with a
mean of 26.5±7.5 years old) and Middle-aged Sub-
jects (9 subjects, with a mean of 65.8±11.2 years
old). Subjects were recruited in the medical insti-
tution Cl´ınica San Camilo of the Buenos Aires, Ar-
gentina and in all cases informed consent was signed.
Each subject recorded has undergone a head-up tilt
test trial according to the following protocol: 5 min
in the supine position, 5 min tilted head-up to an an-
gle of 70 degrees, and 18 sec during table movement.
This method generates an abrupt acceleration of the
heart rate. The ECG leads I, III, V1-V6 were recorded
during the whole test using ECG View Eccosur equip-
ment with a sampling rate of 1000 Hz.
2.2 Preprocessing
The ECG signals have been preprocessed as fol-
lows: 1) QRS complexes have been detected and
normal beats have been selected according to the
method in (Mendieta, 2012), 2) A Butterworth high-
pass filter (0.5Hz, bidirectional) has been applied
for baseline wander rejection and in order to reduce
high frecuency noise, a Butterworth low-pass filter
(100Hz, bidirectional) has been used, and 3) T-waves
and QRS-complexes have been delineated using the
wavelet-transform based method in (Mendieta, 2012).
2.3 Repolarization Indices
Several indices have been selected to describe the fol-
lowing characteristics of VRD on the surface ECG: 1)
Duration, 2) Energy and 3) Morphology.
For all indices we have applied a multilead cri-
terion to determine wave boundaries, where QRS
END
and T
END
are respectively the lastest reliable QRS-
complex and T-wave ends at any lead (I, III, V1-
V6). Also, the T-wave peak (T
PEAK
) and R-wave peak
(R
PEAK
) as median values of all leads have been com-
puted with an outlier protection rule.
For each i
th
beat, we havecomputed the aforemen-
tioned characteristics of VRD.
1) Indices of Duration: The total repolarization
duration index (T
RD
), quantifying the total ventric-
ular repolarization time, has been calculated as;
T
RD
i
= T
END
i
− QRS
END
i
(1)
The early repolarization duration index (E
RD
)
and the T-wave peak-to-end interval index (T
PE
),
which several authors have linked to the full repolar-
ization of epicardium and transmural repolarization
respectively (Antzelevitch et al., 2007), have been
computed as;
E
RD
i
= T
PEAK
i
− QRS
END
i
(2)
and,
T
PE
i
= T
END
i
− T
PEAK
i
(3)
2) Indices of Energy: We have obtained T-wave
energy based on the PCA of the ECG leads. For the
calculus of PCA indices in each i
th
beat, it has been
considered three windows, one for total repolariza-
tion duration (time between QRS
END
and T
END
) and
one for each portion (early and late) of the same T-
wave (partitioned in T
PEAK
). PCA has been applied in
the set of the independent leads, from which 8 eigen-
values have been obtained. We have denoted them
by λ
i, j
(j = 1, . . . , 8), where they are sorted so that
λ
i,1
≥ λ
i,2
≥ ..... ≥ λ
i,8
≥ 0. Then, we have computed
the Total energy as the sum of the eight eigenvalues.
E
i
=
8
∑
l=1
λ
i,l
(4)
This way, we have obtained E
T
for the full T-
wave; E
ET
for the first half of the T-wave (or Early T-
wave) and E
LT
for the Late T-wave (or T-wave peak-
to-end).
3) Indices of Morphology: Afterwards, we have
computed an absolute T-wave (T
ABS
), through the sum
of the eight T-waves in each i
th
beat, let
T
ABS
i
(k) =
∑
j=I,III,V1-V6
|x
j
(k)| k = QRS
END
i
, ... , T
END
i
(5)
where x
j
(k) is the ECG signal at lead j, then a
polynomial fitting has been applied for each i
th
T
ABS
obtaning
˜
T
ABS
i
. Then the following indices were cal-
culated: T-wave Amplitude index (T
A
), calculated
as the amplitude of the
˜
T
ABS
i
wave peak; Slope of
DynamicResponseofElectrocardiographicIndicesDuringAbruptHeartRateChanges-ComparisonbetweenYoungand
Middle-agedSubjects
265
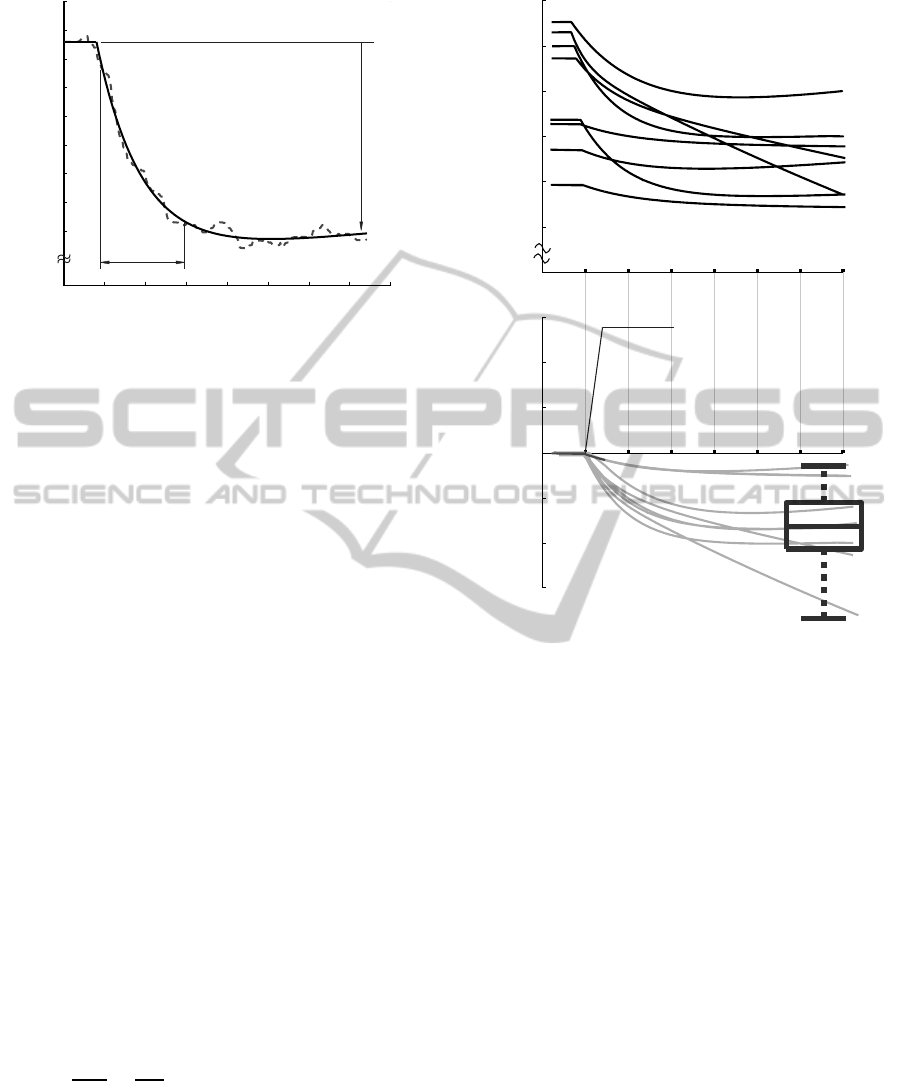
0 100 200 300 400
175
185
195
205
215
0
E
RD
[ms]
t [s]
t
r
[s]
∆E
RD
[ms]
Figure 1: Example of characterization of E
RD
index. The
dotted line shows the index value and bold line represents
the fitting curve.
Early T-wave index (S
ET
), maximum slope obtained
through a five point centered derivative in whole first
half of
˜
T
ABS
i
wave and Slope of Late T-wave index
(S
LT
), absolute value of the maximum slope obtained
through the five point centered derivative in whole
second half of
˜
T
ABS
i
wave.
2.4 Series of Repolarization Indices
For each index, the values beat-to-beat have been con-
catenated and so obtained the series of values over
time: RR, T
RD
, E
RD
, T
PE
, E
T
, E
ET
, E
LT
, T
A
, S
ET
and S
LT
, during the Tilt-test Maneuver. A numerical
interpolation has been applied using the R
PEAK
values
as time reference for all beats in order to resample to
1 Hz. It has also been applied a median filter with a
windows size of 20 seconds. Series have been charac-
terized through a numerical fitting with a linear com-
bination of two exponentials, as shown in Eq. (6),
where a
0
, ... , a
3
are the fitting parameters.
e
f
(n)
= a
0
e
a
1
.n
+ a
2
e
a
3
.n
(6)
The optimization is based on the minimization of
the sum squared error (SSE) of each series, as illus-
trated in Eq. (7) where I
(n)
represents the index under
study.
∂e
r
2
∂a
k
=
∂
∂a
k
N
∑
n=1
(I
(n)
−
e
f
(n)
)
2
= 0 (7)
We have obtained the optimum starting point of
the Tilt-test Maneuver (so-called t
0
), by minimizing
the global error function for each adjustment an so,
each series have been computed. An example of this
fitting is shown in Fig. 1.
0
160
180
200
220
240
260
50 100 150 200 250 300 350
-40
-60
-20
0
20
40
60
E
RD
[ms]
t [s]
t
0
∆E
RD
[ms]
Figure 2: Evolution of E
RD
for several subjects of the
database. Example of normalization for statistical analysis
(SA#1).
2.5 Characterization of Repolarization
Series and Statistical Analysis
In order to analyze just the dynamics of each series
following abrupt HR changes, we have performed a
normalization procedure by subtracting, for all series
samples, the value at t
0
of each series, see Eq. (8).
For convenience, we have named I = I(t) where I rep-
resents the evaluated index.
∆I = I− I(t
0
) (8)
We have characterized each series of repolariza-
tion indices through two parameters, such as
1) Index variation (∆), which characterize the in-
dex value difference between t
0
(0%) and 100% of
change. Also, we have determined the indices with
statistically significant changes respect to zero value
(t
0
) applying a two-sided Wilcoxon signed rank test.
This procedure has been so-called Statistical Analy-
sis #1, SA#1 (see Fig. 2).
2) Response time (t
r
), the time required to change
from 10% to 90% of index value, as can be observed
in Fig. 1.
BIOSIGNALS2015-InternationalConferenceonBio-inspiredSystemsandSignalProcessing
266

Moreover, another statistical analysis has been
performed for the comparison between two popu-
lations, Young and Middle-aged Subjects. A non-
parametric two-sided Mann-Whitney U test has been
used and when p < 0.05, differences have been con-
sidered statistically significant. This procedure has
been so-called Statistical Analysis #2 , SA#2.
3 RESULTS
The statistical results obtained for each series are
shown in Fig. 3.a for young subjects and in Fig.
3.b for middle-aged subjects. Except ∆T
PE
in both
population and ∆S
LT
in middle-aged subjects, all in-
dices have shown significant differences in their val-
ues in response to physiological changes induced by
abrupt HR changes. Moreover, not all indices reach
the steady state at the same time. Table 1 shows t
r
val-
ues in Mean±SEM for all proposed VRD indices in
both population. Finally, in Table 2 we have pointed
out the comparison between the two groups.
Table 1: Response time t
r
expressed in seconds
(Mean±SEM) for both groups Young and Middle-aged
Subjects.
Indice Young Middle-aged
RR 171.3± 27.0 90.7± 27.3
T
RD
163.3± 21.9 100.0± 11.4
E
RD
150.6± 26.3 107.0± 11.3
T
PE
177.6± 30.2 104.2± 30.8
E
T
135.3± 26.9 149.3± 23.7
E
ET
133.1± 25.5 145.2± 23.0
E
LT
129.3± 24.5 147.8± 26.2
T
A
122.9± 26.7 134.1± 27.6
S
ET
114.8± 27.0 163.8± 29.8
S
LT
150.6± 33.8 158.6± 29.7
Table 2: Comparison (SA#2) between Young and Middle-
aged Subjects (Mean±SEM).
Young Middle-aged p value
∆E
T
35.59±8.30 7.40±2.38 <0.05
∆E
ET
23.68±5.92 5.46±1.95 <0.05
∆E
LT
7.19±2.09 1.74±0.47 <0.05
∆T
A
1.03±0.28 0.43±0.14 <0.05
∆S
ET
0.018±0.005 0.006±0.004 <0.05
4 DISCUSSION
In this work we have proposed a multilead crite-
rion to analyze VRD alterations caused by abrupt HR
changes using duration, energy and morphology in-
dices. To do so, we have studied each of them sepa-
rately and then, we have hypothesized about their re-
lationships and implications.
Duration variables. We have observed, in both
young and middle-aged subjects, a statistical signif-
icant decrease of ∆T
RD
and ∆E
RD
in response to RR
interval decrease, while ∆T
PE
has not changed (see
Fig. 3.a and Fig. 3.b). These results are consistent
with a previous work (Cruces et al., 2014). In the lat-
ter, we have shown alterations in both T
W
(T-wave
width) and T
OP
(T-wave onset-to-peak duration) dur-
ing HR changes in another database (Autonomic Ner-
vous System Database, University of Zaragoza). Our
results are comparable to those in (Merri et al., 1989),
where it has shown that QT interval and early du-
ration (time interval between QRS-complex-end and
T-wave-peak) are the only intervals with significant
changes in VRD under HR changes . Conversely, An-
dersen et al. have calculated HR dependence for ECG
duration markers showing independence in both T
W
and T
PE
(Andersen et al., 2008). In another sense,
as it can be seen in Table 2, no significant changes
in the duration indices have been observed in young
with respect to middle-aged subjects according to the
procedure SA#2 described in Subsection 2.5.
Energy Variables. We have performed the energy of
the T-wave by applying PCA method with the infor-
mation of all ECG leads. In response to HR increases
we have found statistically significant decreases of
∆E
T
, ∆E
ET
and ∆E
LT
in both young and middle-aged
subjects (applying SA#1), as we have shown in Fig.
3.a and Fig. 3.b.
Andersen et al. have computed and analyzed sim-
ilar indices, such as early and late T-wave areas. They
have shown dependence of HR in each one (Andersen
et al., 2008), then we have consistent results with our
energy indices obtained by PCA procedure.
Also, as we have observed in Table 2, the energy
of total (∆E
T
), early (∆E
ET
) and late (∆E
LT
) repolar-
ization have been able to reflects VRD differences be-
tween young subjects with respect middle-aged sub-
jects (Subsection 2.5 SA#2).
Morphology Variables. Regarding morphologic
analysis in young subjects, we have found statistically
significant decreases in ∆T
A
, ∆S
ET
and ∆S
LT
(see Fig.
3.a). Moreover, ∆T
A
and ∆S
ET
were significantly in
middle-aged subjects and not significance of ∆S
LT
in-
dex (see Fig. 3.b). Results obtained in young sub-
jects were consistent with another work (Andersen
et al., 2008), who have shown significant changes in
both up and down slopes T-wave. Andersen et al.
have concluded that those variations were just about
T-wave amplitude decrease, because they have not
DynamicResponseofElectrocardiographicIndicesDuringAbruptHeartRateChanges-ComparisonbetweenYoungand
Middle-agedSubjects
267
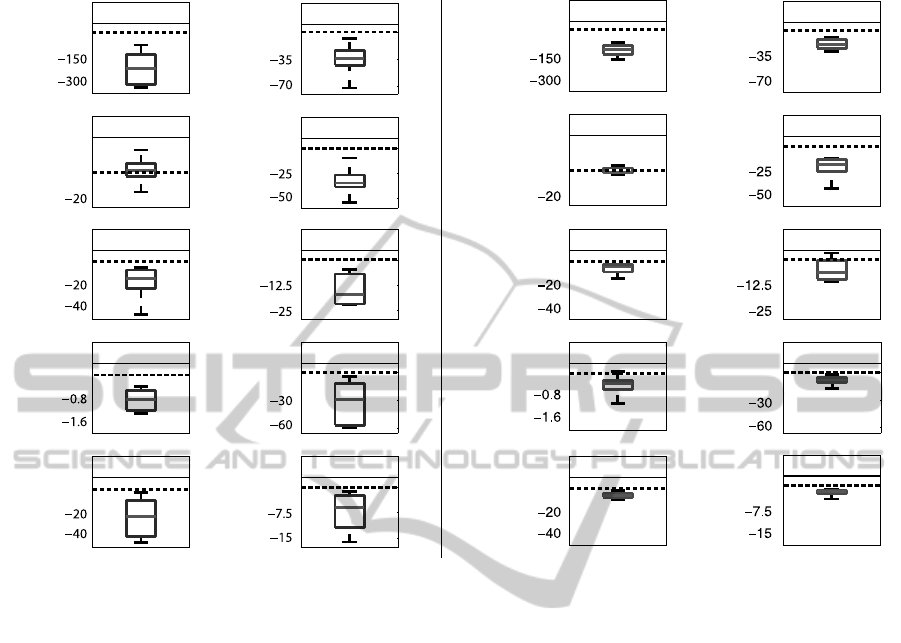
0
0
0
20
0
0
0
0
0
0
0
0
mv111
mv111
0
0
20
0
0
0
0
0
0
0
(a) (b)
∆RR
∆RR
∆E
RD
∆E
RD
∆T
PE
∆T
PE
∆T
RD
∆T
RD
∆S
ET
∆S
ET
∆S
LT
∆S
LT
∆T
A
∆T
A
∆E
T
∆E
T
∆E
ET
∆E
ET
∆E
LT
∆E
LT
[%]
[%]
[%]
[%]
[%]
[%]
[msec]
[msec]
[msec]
[msec]
[msec][msec][msec][msec]
[mV/sec]
[mV/sec]
[mV/sec]
[mV/sec]
xx
xx
x
x
x
xx
xx
xx
#
#
##
NS
NS
NS
Figure 3: Box and Whisker diagram for all VRD indices. (a) Young subjects; (b) Middle-aged subjects. Statistical significance
(SA#1) has been represented as ’x’ for p<0.05 and ’#’ for p<0.005. Non significant changes have been indicated as NS.
found modifications in T-wave onset-to-peak. How-
ever, our results suggest that both T-wave amplitude
and early repolarization duration were responsible for
those variations. Also, we have found significant
differences between young subjects and middle-aged
subjects in T
A
and S
ET
indices (as we have explained
in SA#2). Conversely, no significant changes in S
LT
has been observed with SA#2.
Response Time. Table 1 shows that RR index reach
the steady state after duration, energy and morphol-
ogy VRD indices for young subjects. Conversely,
for middle-aged subjects the time required to change
from 10 % to 90 % (t
r
) in the VRD indices are greater
than the t
r
measured in the RR index. These results
allows us to hypothesize that there are different times
of adaptation under abrupt HR changes, possibly re-
lated to aging effects. Also, as it can be seen, dura-
tion indices have shown faster adaptation to high HR
in middle-aged subjects than in young subjects. How-
ever, energy and morphology indices are faster in the
latter population.
5 CONCLUSION
Given that E
RD
and T
RD
indices have shown statis-
tical significance and T
PE
has not, we have also con-
cluded that HR increases induce a shift in the T-wave
peak position towards the QRS-complex. We have
concluded that under abrupt changes in HR, the main
alterations of VRD correspond to the variations in the
the duration of action potentials which do not affect
differentially epicardium from endocardium tissues.
Moreover, T
A
, S
ET
, E
T
, E
ET
and E
LT
have
shown statistically significant differences under HR
increases. We can hypothesize that these effects
have a physiological limit because several repolariza-
tion indices reach the steady state before RR interval
(Young Subjects) and others indices have presented
aging effects due to they reach the steady state after
RR interval (Middle-aged Subjects).
Some authors have shown that several repolar-
ization indices are independent of age (Merri et al.,
1989), nevertheless others have shown that aging
modulates the normal VRD (Huang et al., 2010). In
our study we have concluded that the energy of to-
tal (E
T
), early (E
ET
) and late (E
LT
) repolarization have
BIOSIGNALS2015-InternationalConferenceonBio-inspiredSystemsandSignalProcessing
268

been able to reflects VRD differences between young
and middle-aged healthy subjects.
Finally, this study constitutes a basis for setting
normal conditions of the ventricular repolarization
process in young and middle-aged subjects.
ACKNOWLEDGEMENTS
This work was supported by Consejo Nacional de In-
vestigaciones Cient´ıficas y T´ecnicas CONICET, un-
der project PIP #538 and PICT 2008 #2108 Agencia
Nacional de Promoci´on Cient´ıfica y Tecnol´ogica, Ar-
gentina.
REFERENCES
Andersen, M., Xue, J., Graff, C., Kanters, J., Toft, E., and
Struijk, J. (2008). New descriptors of T-wave mor-
phology are independent of heart rate. J Electrocar-
diol, 41:557–561.
Antzelevitch, C., Viskin, S., Shimizu, W., Yan, G., Kowey,
P., Zhang, L., Sicouri, S., Di Diego, J., and Burash-
nikov, A. (2007). Does Tpeak-Tend provide an index
of transmural dispersion of repolarization? Hearth
Rhythm, 4(8):1114–1119.
Arini, P. D., Bertr´an, G. C., Valverde, E. R., and Laguna, P.
(2008). T-wave width as an index for quantification of
ventricular repolarization dispersion: Evaluation in an
isolated rabbit heart model. Biomed Signal Proc and
Control, 3:67–77.
Cruces, P., Bonomini, M., Teperino, M., Minchol´e, A., La-
guna, P., and Arini, P. (2014). Normal ventricular
repolarization dispersion range with abrupt heart rate
changes. In Computing in Cardiology. In press.
Fuller, M. S., Sndor, G., Punske, B., Taccardi, B., MacLeod,
R. S., Ershler, P. R., Green, L. S., and Lux, R. L.
(2000). Estimates of repolarization and its dispersion
from electrocardiographic measurements: direct epi-
cardial assesment in the canine heart. J Electrocardiol,
33:171–180.
Huang, J.-H., Lin, Y.-Q., Pan, N.-H., and Chen, Y.-J.
(2010). Aging modulates dispersion of ventricular re-
polarization in the very old of the geriatric population.
Heart Vessels, 25:500–508.
Malik, M., Acar, B., Gang, Y., Yap, Y. G., Hnatkova, K., and
Camm, A. J. (2000). QT dispersion does not represent
electrocardiographic interlead hetereogeneity of ven-
tricular repolarization. J Cardiovasc Electrophysiol,
11:835–843.
Mendieta, J. G. (2012). Algoritmo para el delineado
de se˜nales ECG en un modelo animal empleando
t´ecnicas avanzadas de procesamiento de se˜nales.
Master Thesis. , Facultad de Ingenier´ıa de la Univer-
sidad de Buenos Aires.
Merri, M., Benhorin, J., Alberti, M., Locati, E., and Moss,
A. J. (1989). Electrocardiographic quantitation of ven-
tricular repolarization. Circulation, 80:1301–1308.
Minchol´e, A., Mart´ınez, J., Arini, P., Risk, M., and Laguna,
P. (2006). T wave width alterations during valsalva
maneuver in diabetic patients. In Computers in Car-
diology, volume 33, pages 709–712.
Minchol´e, A., Pueyo, E., Rodriguez, J. F., Zacur, E.,
Doblar´e, M., and Laguna, P. (2011). Quantification
of restitution dispersion from the dynamic changes of
the T wave peak to end, measured at the surface ECG.
IEEE Trans Biomed Eng, 58(5):1172–1182.
Opthof, T., Coronel, R., Wilms-Schopman, F. J. G., Plot-
nikov, A. N., Shlapakova, I. N., Danilo, P., Rosen,
M. R., and Janse, M. J. (2007). Dispersion of re-
polarization in canine ventricle and the electrocardio-
graphic T wave: Tp-e interval does not reflect trans-
mural dispersion. Heart Rhythm, 4:341–348.
Pueyo, E., Smetana, P., Caminal, P., Bayes de Luna, A.,
Malik, M., and Laguna, P. (2004). Characterization
of QT interval adaptation to RR interval changes and
its use as a risk-stratifier of arrythmic mortality in
amiodarone-treated survivors of acute myocardial in-
farction. IEEE Trans Biomed Eng, 51(9):1511–1520.
Smetana, P., Batchvarov, V., Hnatkova, K., Camm, A. J.,
and Malik, M. (2004). Ventricular gradient and
nondipolar repolarization components increase at
higher heart rate. Am. J Physiol. Heart Circ. Physiol.,
286:H131–H136.
Smetana, P., Schmidt, A., Zabel, M., Hnatkova, K., Franz,
M., Huber, K., and Malik, M. (2011). Assessment of
repolarization heterogeneity for prediction of mortal-
ity in cardiovascular disease: peak to the end of the
T wave interval and nondipolar repolarization compo-
nents. J Electrocardiol, 44:301–308.
Surawicz, B. (1997). Ventricular fibrillation and disper-
sion of repolarization. J. Cardiovasc. Electrophysiol.,
8:1009–1012.
Zabel, M., Malik, M., Hnatkova, K., Papademetriou, M. D.,
Pittaras, A., Fletcher, R. D., and Franz, M. R. (2002).
Analysis of T-wave morphology from the 12-lead
electrocardiogram for prediction of Long-Term prog-
nosis in male US veterans. Circulation, 105:1066–
1070.
Zareba, W., Couderc, J., and Moss, A. (2000). Automatic
detection of spatial and temporal heterogeneity of re-
polarization In: Dispersion of ventricular repolariza-
tion pp.85-107. Futura Publishing Company, Inc.
DynamicResponseofElectrocardiographicIndicesDuringAbruptHeartRateChanges-ComparisonbetweenYoungand
Middle-agedSubjects
269
