
Fast Classification of Dust Particles from Shadows
Elio D. Di Claudio, Giovanni Jacovitti, Gianni Orlandi and Andrea Proietti
Department of Information Engineering, Electronics and Telecommunications (DIET),
University of Rome “La Sapienza”, Via Eudossiana 18, Rome, Italy
Keywords:
Dust Monitoring, Object Classification, Contour Analysis.
Abstract:
A fast and versatile method for classifying dust particles dispersed in the air is presented. The method uses
images captured by a simple imaging system composed of a photographic sensor array and of an illuminating
source. Such a device is exposed to free particulate deposition from the environment, and its accumulation is
measured by observing the shadows of the particles the air casts onto the photographic sensor. Particles are
detected and classified in order to measure their density and to analyse their composition. To this purpose,
the contour paths of particle shadows are traced. Then, distinctive features of single particles, such as dimen-
sion and morphology, are extracted by looking at corresponding features of the sequence of local orientation
changes of contours. Discrimination between dust and fibre particles is efficiently done using the varimax
norm of these orientation changes. It is shown through field examples that such a technique is very well suited
for quantitative and qualitative dust analysis in real environments.
1 INTRODUCTION
Detection and measurement of particulate air pollu-
tion is important in many applications, ranging from
public protection from outdoor airborne particulate
matter, to indoor air quality control, to environmental
infection control in health-care facilities, to dust con-
trol into clean-rooms in semiconductor and biotech-
nology factories, to aerosol monitoring in museums
and libraries, etc.
In particular, indoor air quality generally depends
upon the outside environment, as demonstrated by the
scientific community in the last years (Jones, 1999;
Anderson et al., 2012; Delgado-Saborit et al., 2011;
Frontczak and Wargocki, 2011). A critical element
that decisively affects the indoors quality of the air is
dust, especially due to the actual process of air cir-
culation, much more limited than outside. Dust en-
ters in indoor environments and persists there for a
long time, increasing the chances of contamination
and degradation due to environmental factors as light,
temperature, and micro-organisms (Coronas et al.,
2013).
The state of the art technologies for the moni-
toring of dust in indoor environments relies on the
use of expensive equipment, often needing highly
qualified staff and complex physical and chemical
analysis, as spectroscopy, spectrometry, IR analysis,
etc. Recently, other techniques have been developed,
based on imaging systems. However, they often make
use of very expensive microscopes and optical sys-
tems, as well as on chemical analysis or non-visible
spectrum investigations (Chichinadze and Kvavadze,
2013; Ozga et al., 2013; Kyropoulou, 2013). These
techniques are usually necessary to know the chemi-
cal composition of the particles, or when the environ-
ment is affected by very fine particles.
In many other cases, a less detailed knowledge of
the dust, especially concerning the morphological in-
formation about the shape and the size of the dust par-
ticles, is sufficient. In particular, our application is
mainly concerned with the estimation of the dust and
fibre count in the airflow. Obtaining this information
often requires the use of much less complex systems,
with respect to the above-mentioned techniques. Pat-
tern identification techniques using multiple features
generally have high computational costs and the im-
pact of each feature on the classification performance
may remain unclear and undermine the generalization
capabilities under different experiment settings.
A dust detection and analysis system based on im-
age processing techniques was presented in a recent
work (Proietti et al., 2014). It allows evaluating the
dusting speed and some specific morphological infor-
mation (i.e., shape and size of each dust deposition
elements).
241
Di Claudio E., Jacovitti G., Orlandi G. and Proietti A..
Fast Classification of Dust Particles from Shadows.
DOI: 10.5220/0005218802410247
In Proceedings of the International Conference on Pattern Recognition Applications and Methods (ICPRAM-2015), pages 241-247
ISBN: 978-989-758-077-2
Copyright
c
2015 SCITEPRESS (Science and Technology Publications, Lda.)

In this contribution, a very simple classification
technique based on particle contours only is pre-
sented.
The first appealing aspect of this approach is that
particle contours can be collected by using very sim-
ple imaging devices, such as the one illustrated in the
forthcoming section.
The second advantage is that contours process-
ing admits fast and accurate classification algorithms,
permitting high repetition rate and low consumption
operation. This performance is especially interesting
if high spatial sampling over wide areas is required
to relate for instance dust concentration to air flows,
employing wireless sensor networks, where it demon-
strated similar or better performance than some multi-
feature approaches, as shown in Sect. 4.
2 SENSING APPARATUS
The acquisition stage is based on an USB Microsoft
LifeCam HD-3000, which acquires 720p video im-
ages. The pixel size of its CMOS sensor is 3 µm
2
,
suited for capturing the finest particulate of interest in
the present application. In fact, for our purpose, the
camera was deprived of its lens, allowing the direct
deposition of dust on the image sensor. The sensor
was perpendicularly illuminated with a small white
LED light source in order to create sharp shadows of
particles in contact with the sensor. The sensor was
tilted by 45
◦
with respect to the floor to allow the de-
posit of dust, minimizing at the same time excessive
accumulation.
A typical collection of particle shadows visible in
an acquired image is shown in Figure 1.
Figure 1: The shadows of particles in a typical acquired
image.
3 CONTOUR PROCESSING
The collecting time between cleaning operation is
such that overlap of dust particles are rare events
which do not statistically affect the significance of the
measurements. This allows employing a fast detec-
tion and classification procedure described below.
Preliminarily, shadows are transformed in
grayscale and hard limited to obtain binary images,
where the inner part of any particle is black and the
background is white
1
.
The picture is then scanned by rows until the first
non-singleton particle contour is encountered. The
overall procedure is sequentially repeated on all shad-
ows collected in the picture, by cancelling out ex-
tracted shadows and single spurious pixels.
Figure 2: The particle shadow (left) and the one-step motion
vector of the l-th boundary pixel (right).
Looking at the generic k-th particle depicted in
Figure 2, its contour is first represented by the se-
quence of boundary pixels (the white ones adjacent
to the black ones).
In order to characterize the topological relation-
ship between the boundary pixels, these are listed in
a cyclic matrix B
k
containing their Cartesian coordi-
nates x
l
and y
l
, ordered so that the distance of each
pixel from the nearest one is at most one, both in hori-
zontal and vertical direction, proceeding (without loss
of generality) clockwise:
B
k
=
x
1
y
1
··· ···
x
l
y
l
··· ···
x
L
y
L
, l = 1. . . L . (1)
This matrix literally represents the k-th particle
boundary, since it allows to graphically reconstruct it.
Most important, it describes the dynamical behaviour
of the contour, i.e., it accounts for the topological rela-
tionship between consecutive elements, just like con-
1
Under the typical additive sensor noise (i.e., 2-10 stan-
dard deviation levels on a 255 grayscale image), the shadow
extraction was nearly insensitive to noise, as shown in the
experimental trials. For a 10 levels standard noise deviation,
a DCT denoising stage (Foi et al., 2007) before the thresh-
old operation allowed to regain the same performance as in
the noiseless case.
ICPRAM2015-InternationalConferenceonPatternRecognitionApplicationsandMethods
242
secutive elements of a time series reflect the dynam-
ical behaviour of the system generating it. Thus, in
principle, a particle can be regarded as a system gen-
erating a double circular signal (the boundary) and we
may look to the particle classification problem as a
classical problem of system identification. To make
this analogy more directly interpretable, let us con-
sider the first backward row difference of this matrix,
which defines a new cyclic matrix ∆
k
as:
∆
k
=
δ
x1
δ
y1
··· ···
δ
xl
δ
yl
··· ···
δ
xL
δ
yL
, (2)
where
δ
xl
= x
l modL+1
− x
(l−1)modL+1
,
δ
yl
= y
l modL+1
− y
(l−1)modL+1
,
(3)
where “mod” indicates the modulus (positive remain-
der) operator. Hence, ∆
k
entries δ
xl
δ
yl
can assume
the eight possible pair values: (1, 0), (0, 1), (−1, 0),
(0, −1), (1, 1), (1, −1), (−1, 1), (−1, −1).
Using a well-known terminology employed in
video coding, these pairs can be viewed as the mo-
tion vectors of a generic boundary pixel travelling
step by step along the particle contour (see Figure 2).
A similar concept was followed for pattern analy-
sis in the past (Bennett and MacDonald, 1975; Per-
soon and Fu, 1977; Arkin et al., 1991). Recently in
(Torgashov, 2014) motion vectors where represented
as complex sequences and cross-correlated with tem-
plates for recognition purposes. Here, we are inter-
ested in morphological analysis. For this purpose, we
examine the pixel motion along the boundary to sense
relevant and distinctive characteristics of the particle
contour, such as the succession and the curvature of
curves, and the length of straight lines in order to per-
form efficient classification of dust particles shape.
These characteristics are extracted by looking at
the collection of azimuth angles of the motion vec-
tors, which measures the direction of the generic pixel
during its step by step move along the contour. Let us
assemble these angles ϕ
l
in the new single column
matrix Φ
k
:
Φ
k
=
ϕ
1
···
ϕ
l
···
ϕ
L
, (4)
being
ϕ
l
= arctan 2
δ
yl
, δ
xl
,
|
ϕ
l
|
< π, (5)
where arctan2(δ
y
, δ
x
) is the four quadrant arctangent.
The incremental angles are then defined as
∆
ϕk
=
δ
ϕ1
···
δ
ϕl
···
δ
ϕL
, (6)
where
δ
ϕl
= ϕ
lmodL+1
− ϕ
(l−1)modL+1
. (7)
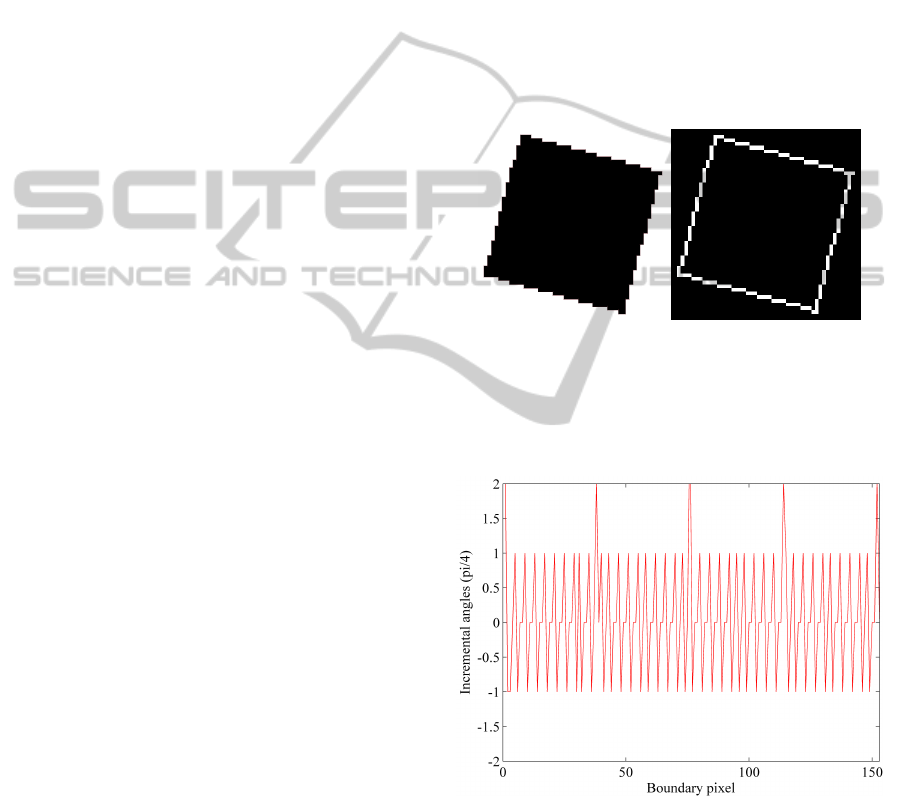
The incremental angles δ
ϕl
are multiples of 45
◦
,
which is a very crude quantization. By fact, ∆
ϕk
repre-
sents the particle boundary at a very small scale. This
is clearly visible in Figure 4 where the plot of the δ
ϕl
values calculated for the ideal particle of Figure 3 is
displayed.
Figure 3: The shadow of an ideal particle (left) along with
its boundary (right).
In order to obtain an interpretable plot, it is
first necessary to attenuate the space quantization by
smoothing the boundary.
Figure 4: The incremental angle of the motion vector for
each boundary position for the particle of Figure 3.
A very intuitive smoothing technique consists of
measuring the matrix of angles after M moves:
Φ
M
k
=
ϕ
M
1
···
ϕ
M
l
···
ϕ
M
L
, (8)
FastClassificationofDustParticlesfromShadows
243
being
ϕ
M
l
= arctan 2
δ
M
yl
, δ
M
xl
,
ϕ
M
l
< π, (9)
and
δ
M
xl
=
l+M−1
∑
i=l
δ
x,i modL
,
δ
M
yl
=
l+M−1
∑
i=l
δ
y,i modL
.
(10)
The incremental angles are assembled in the ma-
trix:
∆
M
ϕk
=
δ
M
ϕ1
···
δ
M
ϕl
···
δ
M
ϕL
, (11)
where
δ
M
ϕl
= ϕ
M
l modL+1
− ϕ
M
(l−1)modL+1
. (12)
Phase unwrapping is performed by choosing at
each point:
ˆ
δ
M
ϕl
= δ
M
ϕl
+ 2π argmin
k∈
{
−1,0,1
}
n
δ
M
ϕl
+ 2kπ
o
. (13)
The plot of these angles for the particle of Figure 3
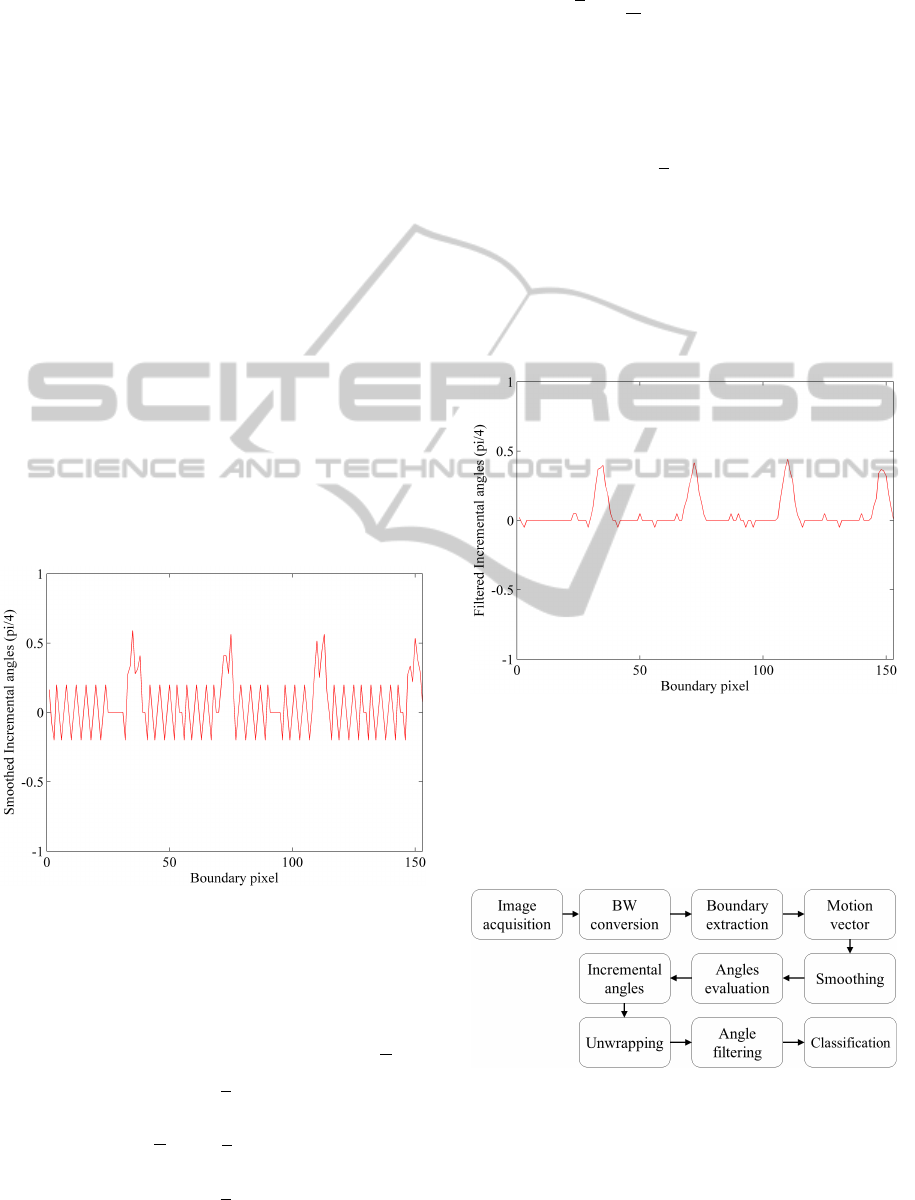
after contour smoothing is shown in Figure 5.
Figure 5: The incremental angle of the motion vector after
smoothing of the contour of the particle of Figure 3, with
M=6.
However, this sequence is still too noisy. A second
filter is then applied to the sequence
ˆ
δ
M
ϕl
in order to re-
ject the residual angle quantization noise, yielding the
filtered angle sequence assembled in the vector ∆
N
ϕk
:
∆
N
ϕk
=
δ
N
ϕ1
···
δ
N
ϕl
···
δ
N
ϕL
, (14)
where
δ
N
ϕl
=
1
N
l
∑
i=l−N+1
δ
M
ϕ·(imodL)
. (15)
which is a circular moving average FIR filter. More
elaborate filters could be devised, but in our experi-
ments we have adopted this filter for simplicity.
The final result of this two stage angular quantiza-
tion noise suppression is clearly visible in Figure 6
where the plot of the δ
N
ϕl
values calculated for the
same pattern of Figure 3 is shown. Now, the nature of
the particle is revealed by long sequences of small in-
cremental angles interrupted by peaks corresponding
to abrupt vertices. This example reveals how much
the sequence of incremental angles, (which is nothing
else but the sequence of local curvature estimates) is
suited for morphological analysis.
Figure 6: The incremental angle of the motion vector after
smoothing and angle filtering for the particle of Figure 3,
with M=6 and N=4.
In summary, the flowchart of the processing steps
is reported in Figure 7. It terminates with the pro-
posed particle classification algorithm, described in
the next section.
Figure 7: Flowchart of the proposed method.
ICPRAM2015-InternationalConferenceonPatternRecognitionApplicationsandMethods
244
4 PARTICLE CLASSIFICATION
In the present application, particle classification is
based on measuring their dimension and on calculat-
ing a metric for distinguishing dust from fibre shapes.
An obvious indicator of the particle dimension is
the length L of the δ
N
ϕl
sequence. As far as the shape
metric is concerned, let us preliminarily consider the
typical shape of a δ
N
ϕl
sequence for a dust particle, like
the one shown in Figure 8.
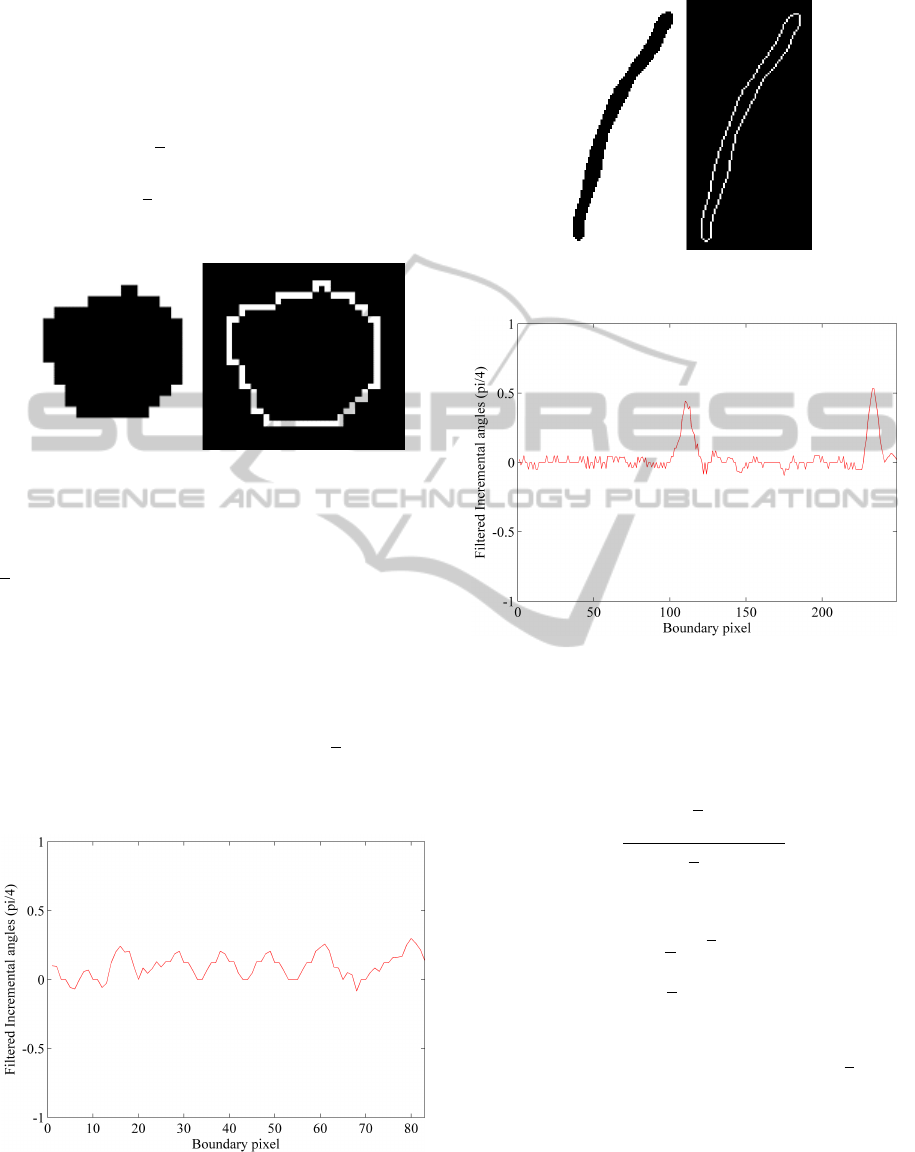
Figure 8: The shadow of a typical dust particle (left) along
with its boundary (right).
The shadow of these particles is characterized by
a morphological compactness, which implies that the
δ
N
ϕl
sequence exhibits moderate oscillations around
the average incremental steering of the boundary (see
Figure 9). Of course, this average diminishes versus
the particle size, while the sequence length grows.
By contrast, the shadows of fibres are character-
ized by long parallel contours with small curvature
connected by abruptly steering terminations (see Fig-
ure 10). Thus, the typical shape of the δ
N
ϕl
exhibits
two low valued extended intervals interrupted by two
peaks corresponding to terminations (see Figure 11).
Figure 9: The incremental angle versus the boundary po-
sition for the dust particle of Figure 8 after smoothing and
angle filtering, with M=6 and N=4.
Figure 10: The shadow of a typical fibre particle (left) along
with its boundary (right).
Figure 11: The incremental angle versus the boundary po-
sition for the fibre particle of Figure 10 after smoothing and
angle filtering, with M=6 and N=4.
Such a different behaviour of the incremental an-
gle is adequately captured by a metric constituted by
the so called varimax norm, defined as follows:
V = L
∑
L
l=1
h
δ
N
ϕl
− µ
i
4
∑
L
l=1
h
δ
N
ϕl
− µ
i
2
2
, (16)
where
µ =
1
L
L
∑
l=1
δ
N
ϕl
. (17)
In fact, interpreting δ
N
ϕl
as samples of a random
time series, the varimax norm is an estimate of its
marginal kurtosis. Then, it may be inferred that V for
dust particles should be close to 3 because their δ
N
ϕl
se-
quences resemble realizations of Gaussian processes.
Instead, it should assume much higher values for fi-
bres, due to the presence of isolated peaks against a
nearly Gaussian background (raising the tails of the
marginal distribution).
This expected behaviour is confirmed by experi-
ments. In Figure 12 examples of particles are shown
FastClassificationofDustParticlesfromShadows
245
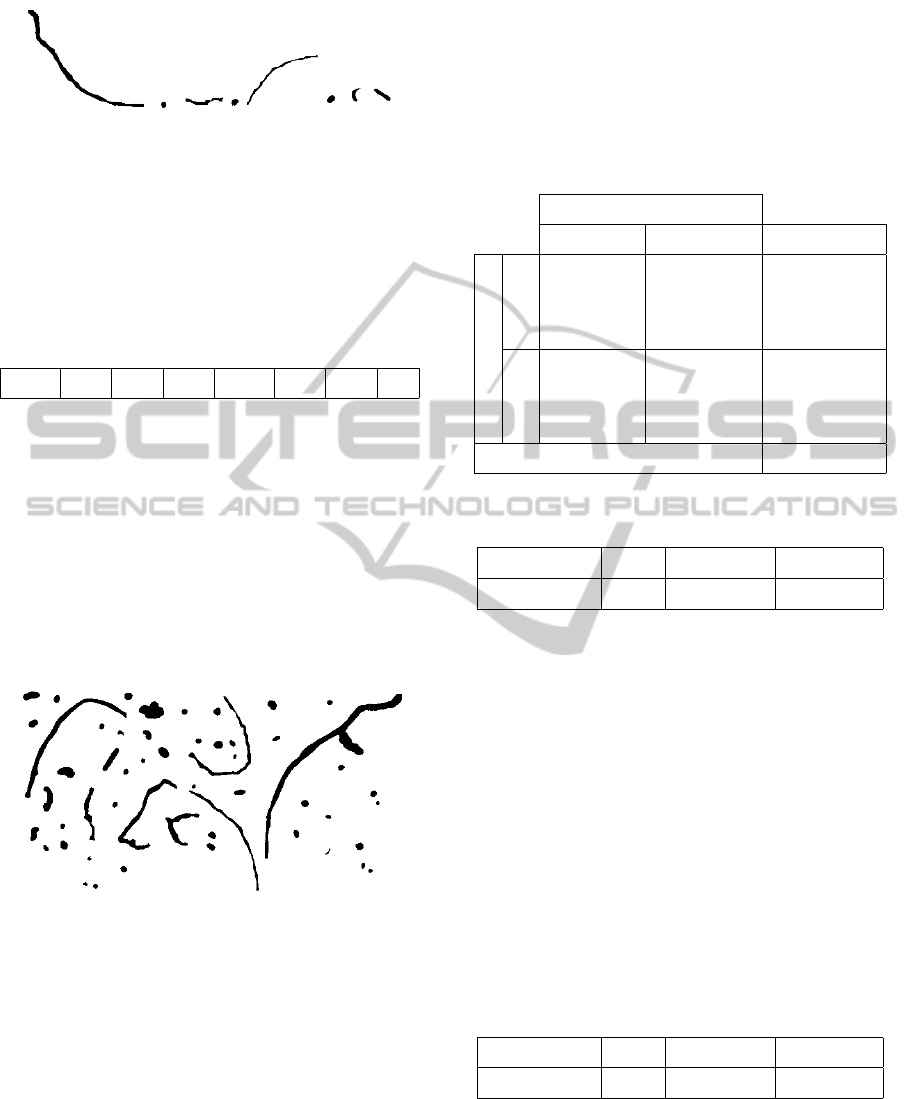
Figure 12: Some patterns from captured images.
along with associated V values described in Table 1.
This simple behaviour allows using a threshold rule to
discriminate dust against fibre particles. If V exceeds
a threshold T , then the particle is classified as fibre.
Table 1: The varimax values respectively related to the sam-
ple patterns of Figure 12 (in the same order), with M=6 and
N=4.
17.46 1.17 4.87 1.43 18.64 1.47 5.15 4.6
It is clear that fibre particles are characterized by
high values of V , typically exceeding 10, while dust
particles have V values typically less than three. In-
termediate values of V correspond to rare particles
that are hardly better discriminated without additional
information, coming from instance from microscopic
inspection.
Still, a first statistical assessment of the method
was provisionally conducted using human classifica-
tion as a reference for a set of particles drawn from
available images (see Figure 13).
Figure 13: The test image used for automatic/manual clas-
sification comparison.
This set was used as a training set for selecting
good parameters for automatic classification, yielding
M = 6 , N = 4 , T = 4 . (18)
Applying these parameters values to other test im-
ages, containing 250 objects not included in the train-
ing set and equally distributed among fibres and dust,
the results shown by the confusion matrix in Table 2
were obtained.
The above classification differences are merely in-
dicative, since reference data are subjective findings
of human observers.
For comparison purpose, the classification experi-
ment was repeated using the varimax norm and three
well-known classifiers, i.e., the k-nearest neighbour
classifier, the Naive Bayes classifier (Mitchell, 1997)
and the Sugeno-type FIS (Chiu, 1994).
Table 2: The confusion matrix of the automatic versus man-
ual labelling.
Automatic classified shapes
Dust Fibres Matching (%)
Dust
119 6 95.2
Manual labelled shapes
Fibres
3 112 97.6
Global matching 96.4
Table 3: Comparison of results performed with the other
classifiers using the single varimax norm as feature.
Classifiers k-nn NaiveBayes Sugeno FIS
Matching (%) 92.64 94.34 88.68
Results reported in Table 3 support the highly sat-
isfactory classification performance of the proposed
technique. Automated threshold selection technique
did not exhibit any advantage compared to the selec-
tion of made on the above a priori considerations.
In order to further assess the goodness of the pro-
posed method, a comparison was performed with a
multi-features classification based on four shape fea-
tures (length of the boundary, its surrounding area and
the lengths of the principal axes of the equivalent el-
liptical contour), using the same three aforementioned
classifiers. These tests, reported in Table 4, exhibit
similar or worst performance with respect to the pro-
posed approach, though implying higher computation
cost.
Table 4: Comparison of results obtained with additional
shape features.
Classifiers k-nn NaiveBayes Sugeno FIS
Matching (%) 90.57 96.22 92.45
Future work will include statistical comparison
with objective dust classification data obtained with
laboratory equipment, in order to estimate the error
rate of the method with high precision.
ICPRAM2015-InternationalConferenceonPatternRecognitionApplicationsandMethods
246

5 COMPUTATIONAL COST
After the image threshold operation, the classifica-
tion of each particle entails the following computation
steps:
• boundary tracking, which requires only logical
operations.
• backward difference, requiring 2L additions.
• 2M · L increments to determine motion vectors,
and computation of their angles (conveniently
done with a look-up table).
• circular moving average, which requires N ·L ad-
ditions.
• unwrapping, requiring 2L additions and magni-
tude comparisons.
• calculus of the mean value and the standard de-
viation of angles, requiring 2(L − 1) sums and L
squares.
• calculus of centred fourth order moments requir-
ing L −1 sums and L fourth degree powers.
In substance, most of the computational cost is
constituted by the N · L additions used for contour
smoothing, and the final 2L powers.
These costs are small compared to the ones in-
volved by classical feature based shape classification
techniques, requiring multiple scale filters, Fourier
transform, Radon transform, covariance, search of
maxima, etc.
6 CONCLUSIONS
The steering angles of the contours are important
indicators of the morphology of the particle shad-
ows. They allow effective particle classification us-
ing mostly sum based processing. The advantages of
the method herein presented are the simplicity of the
imaging apparatus and the low computational cost of
the classification process, which makes it especially
suited for distributed sensing applications.
REFERENCES
Anderson, J., Thundiyil, J., and Stolbach, A. (2012). Clear-
ing the air: A review of the effects of particulate mat-
ter air pollution on human health. Journal of Medical
Toxicology, 8(2):166–175.
Arkin, E., Chew, L., Huttenlocher, D., Kedem, K., and
Mitchell, J. (1991). An efficiently computable met-
ric for comparing polygonal shapes. Pattern Analy-
sis and Machine Intelligence, IEEE Transactions on,
13(3):209–216.
Bennett, J. R. and MacDonald, J. S. (1975). On the mea-
surement of curvature in a quantized environment.
IEEE Transactions on Computers, C-24(8):803–820.
Chichinadze, M. and Kvavadze, E. (2013). Pollen and
non-pollen palynomorphs in organic residue from the
hoard of ancient vani (western georgia). Journal of
Archaeological Science, 40(5):2237 – 2253.
Chiu, S. L. (1994). Fuzzy model identification based on
cluster estimation. Journal of intelligent and Fuzzy
systems, 2(3):267–278.
Coronas, M., Bavaresco, J., Rocha, J., Geller, A., Caramo,
E., Rodrigues, M., and Vargas, V. (2013). Attic dust
assessment near a wood treatment plant: Past air pol-
lution and potential exposure. Ecotoxicology and En-
vironmental Safety, 95:153–160.
Delgado-Saborit, J., Stark, C., and Harrison, R. (2011). Car-
cinogenic potential, levels and sources of polycyclic
aromatic hydrocarbon mixtures in indoor and outdoor
environments and their implications for air quality
standards. Environment International, 37(2):383–392.
Foi, A., Katkovnik, V., and Egiazarian, K. (2007). Point-
wise shape-adaptive dct for high-quality denoising
and deblocking of grayscale and color images. IEEE
Transactions on Image Processing, 16(5):1395–1411.
Frontczak, M. and Wargocki, P. (2011). Literature sur-
vey on how different factors influence human comfort
in indoor environments. Building and Environment,
46(4):922–937.
Jones, A. (1999). Indoor air quality and health. Atmospheric
Environment, 33(28):4535–4564.
Kyropoulou, D. (2013). Scanning electron microscopy with
energy dispersive x-ray spectroscopy: An analytical
technique to examine the distribution of dust in books.
Journal of the Institute of Conservation, 36(2):173–
185.
Mitchell, T. M. (1997). Machine Learning. McGraw-Hill,
Inc., New York, NY, USA, 1 edition.
Ozga, I., Bonazza, A., Ait Lyazidi, S., Haddad, M., Ben-
Ncer, A., Ghedini, N., and Sabbioni, C. (2013). Pol-
lution impact on the ancient ramparts of the moroc-
can city sal. Journal of Cultural Heritage, 14(3
SUPPL):S25–S33.
Persoon, E. and Fu, K. (1977). Shape discrimination using
fourier descriptors. IEEE Transactions on Systems,
Man and Cybernetics, 7(3):170–179.
Proietti, A., Leccese, F., Caciotta, M., Morresi, F., Santa-
maria, U., and Malomo, C. (2014). A new dusts sen-
sor for cultural heritage applications based on image
processing. Sensors (Switzerland), 14(6):9813–9832.
Torgashov, P. (2014). Contour analysis for image recogni-
tion in c#.
FastClassificationofDustParticlesfromShadows
247
