
Detection of Ruptures in Spatial Relationships in Video Sequences
Abdalbassir Abou-Elailah
1
, Valerie Gouet-Brunet
1
and Isabelle Bloch
2
1
Universit´e Paris-Est, IGN, SRIG, MATIS, 73 avenue de Paris, 94160 Saint Mand´e, France
2
Institut Mines-Telecom, Telecom ParisTech, CNRS LTCI, Paris, France
Keywords:
Spatial Relationships, Angle Histogram, Distances, Fuzzy Object Representation, Detection of ruptures.
Abstract:
The purpose of this work is to detect strong changes in spatial relationships between objects in video se-
quences, with a limited knowledge on the objects. First, a fuzzy representation of the objects is proposed
based on low-level generic primitives. Furthermore, angle and distance histograms are used as examples to
model the spatial relationships between two objects. Then, we estimate the distances between different angle
or distance histograms during time. By analyzing the evolution of the spatial relationships during time, rup-
tures are detected in this evolution. Experimental results show that the proposed method can efficiently detect
the ruptures in the spatial relationships, exploiting only low-level primitives. This constitutes a promising step
towards event detection in videos, with few a priori models on the objects.
1 INTRODUCTION
In the literature, there are many intelligent video
surveillance systems, and each system is dedicated
to a specific application, such as sport match analy-
sis, people counting, analysis of personal movements
in public shops, behavior recognition in urban en-
vironments, drowning detection in swimming pools,
etc.
1
The VSAM project (Visam, 1997) was probably
one of the first projects dedicated to surveillance from
video sequences. The goal of ICONS project (Icons,
2000) was to recognize the incidents in video surveil-
lance sequences. The goal of the three projects AD-
VISOR (Advisor, 2000), ETISEO (Etiseo, 2004) and
CareTracker (Caretaker, 2006) was to analyze record
streaming video, in order to recognize events in urban
areas and to evaluate scene understanding. The AVI-
TRACK project (Avitrackr, 2004) was applied to the
monitoring of airport runways, while the BEWARE
project (Beware, 2007) aimed to use dense camera
networks for monitoring transport areas (railway sta-
tions, metro).
In this context, an increasing attention is paid to
“event” detection. In (Piciarelli et al., 2008), an ap-
proach is proposed to detect anomalous events based
on learning 2-D trajectories. In (Saleemi et al., 2009),
a probabilistic model of scene dynamics is proposed
1
See http://www.cs.ubc.ca/∼lowe/vision.html for exam-
ples of companies and projects on these topics.
for applications such as anomaly detection and im-
provement of foreground detection. For crowded
scenes, tracking moving objects becomes very dif-
ficult due to the large number of persons and back-
ground clutter. There are many approaches proposed
in the literature for abnormal event detection, based
on spatio-temporal features. In (Jiang et al., 2009),
an unsupervised approach is proposed based on mo-
tion contextual anomaly of crowd scenes. In (Mehran
et al., 2009), a social force model is used for abnormal
crowd behavior detection. In (Cong et al., 2013b),
an abnormal event detection framework in crowded
scenes is proposed based on spatial and temporal con-
texts. The same authors proposed in (Cong et al.,
2013a) a similar approach based on sparse represen-
tations over normal bases. Recently, Hu et al. (Hu
et al., 2014) proposed a local nearest neighbor dis-
tance descriptor to detect anomaly regions in video
sequences. More recently, the authors in (Tran et al.,
2014) haveproposeda video event detection approach
based on spatio-temporal path search. It is also ap-
plied for walking and running detection.
In this paper, we adopt a different point of
view. We address the question of detecting struc-
tural changes or ruptures, which can be seen as a first
step for event detection. We propose to use low-level
generic primitives and their spatial relationships, and
we do not assume a known set of normal situations or
behaviors. To our knowledge, the proposed approach
is the first one that exploits low-level primitives and
110
Abou-Elailah A., Gouet-Brunet V. and Bloch I..
Detection of Ruptures in Spatial Relationships in Video Sequences.
DOI: 10.5220/0005213501100120
In Proceedings of the International Conference on Pattern Recognition Applications and Methods (ICPRAM-2015), pages 110-120
ISBN: 978-989-758-076-5
Copyright
c
2015 SCITEPRESS (Science and Technology Publications, Lda.)

spatial relationships in an unsupervised manner to de-
tect ruptures in video. In order to illustrate the interest
of spatial relationships, let us consider a car passing
another car on a road. For human beings, it is easy to
detect and recognize this kind of event. To learn an
intelligent system to detect and recognize this event,
one solution is to break down this event into the spa-
tial relationships between the objects (the two cars in
this case) at many points in time. For example, the
car A is behind the car B at the beginning. If the car
A wants to pass the car B, the spatial relationships be-
tween the two cars rapidly changes from behind state
to beside state and then to ahead state. Thus, detect-
ing ruptures in spatial relationships can be important
in detecting and recognizing actions or events in video
sequences.
We propose to detect in an unsupervised way
strong changes (or ruptures) in spatial relationships in
video sequences. This rules out supervised learning-
based algorithms which require specific training data.
This is useful in all situations where an action or
an event can be detected based on such changes or
ruptures. Here, we use Harris detector (Harris and
Stephens, 1988), and/or SIFT detector (Lowe, 2004)
to extract low-level primitives, which are suitable to
efficiently detect and track moving objects during
time in video sequences (Tissainayagam and Suter,
2005; Zhou et al., 2009). In order to associate fea-
tures points to objects (to compute the fuzzy repre-
sentation), the algorithm proposed in (Tissainayagam
and Suter, 2005; Zhou et al., 2009) can be used. The
work presented in this paper is considered as a further
analysis step after tracking the objects using feature
points. Furthermore, we propose a fuzzy represen-
tation of the objects, based on their feature points,
to improve the representation of the objects and of
the spatial relationships. Then, the structure of the
scene is modeled by spatial relationships between dif-
ferent objects using their fuzzy representation. There
are several types of spatial relationships: topological
relations, metric relations, directional relations, etc.
In this paper, we use directional and metric relation-
ships as an example. More specifically, we consider
the angle histogram (Miyajima and Ralescu, 1994)
for its simplicity and reliability, and similarly the dis-
tance histogram. In order to study the evolution of
the spatial relationships over time and to detect strong
changes in the video sequences, we need to measure
the changes in the angle or distance histograms dur-
ing time. Note that this approach differs from meth-
ods based on motion detection and analysis, since it
considers structural information and the evolving spa-
tial arrangement of the objects in the observed scene.
In the literature, many measures have been proposed
to measure the distance between two normalized his-
tograms. Here, we propose to adapt these measures to
angle histograms, in order to use them in our method.
Finally, a criterion is proposed to detect ruptures in
the spatial relationships based on distances between
angle or distance histograms over time.
The proposed methods for the fuzzy representa-
tion and detection of ruptures in the spatial relation-
ships are described in Section 2. Experimental results
are shown in Section 3 in order to evaluate the perfor-
mance of the proposed approach. Finally, conclusions
and future work are presented in Section 4.
2 RUPTURE DETECTION
APPROACH
The proposed approach is divided into two main parts.
In the first part, our goal is to estimate a fuzzy repre-
sentation of the objects exploiting only feature points.
In the second one, spatial relationships between ob-
jects are investigated, using this representation of the
objects. Based on the evolution of the spatial relation-
ships during time, strong changes in video sequences
are detected.
The fuzzy representation of the objects using the
features points is described in Section 2.1. Specifi-
cally, we study the spatial distribution of the feature
points that are extracted using a detector such as Har-
ris or SIFT, for a given object. Feature points can be
used to isolate and track objects in video sequences
(Tissainayagam and Suter, 2005; Zhou et al., 2009).
Thus, we suppose that each moving object is repre-
sented by a set of interest points isolated from oth-
ers with the help of such techniques. Here, we pro-
pose two different criteria to represent the objects as
regions, exploiting only the feature points. The first
one is based on the depth of the feature points, by as-
signing a value to each point based on its centrality
with respect to the feature points. The second one as-
signs a value to each point depending on the density
of its closest feature points. Finally, the depth and
density estimations are combined together, to form
a fuzzy representation of the object, where the com-
bined value at each pixel represents the membership
degree of this pixel to the object. This allows reason-
ing on the feature points or on the fuzzy regions de-
rived from them, without needing a precise segmen-
tation of the onjects.
In Section 2.2, the computation of the spatial rela-
tionships is discussed based on the fuzzy representa-
tion of the objects. As an example, we illustrate the
concept with the computation of the angle and dis-
tance histograms. Then, the existing distances be-
DetectionofRupturesinSpatialRelationshipsinVideoSequences
111

tween two normalized histograms are detailed, and
the adaptation of these distances to angle histograms
is also discussed. Finally, a criterion is defined as
the distance between the angle or distance histograms
during time, in order to detect ruptures in the spatial
relationships.
2.1 Fuzzy Object Representation
In this section, we detail the estimation of the fuzzy
representation based on the feature points.
p
x
i
d
i
θ
i
Figure 1: Feature point distribution for a given object.
Feature Detection: For a given object, let x
k
(k = 1,2,...,n) be the detected feature points. For a
given pixel p of the object, let px
i
denote the line con-
necting the pixel p and x
i
(i ∈[1...n]), d
i
the distance
between p and x
i
, and θ
i
the angle between
−→
px
i
and
the horizontal line as shown in Fig. 1 (θ
i
∈ [0,2π]).
Distances d
i
and angles θ
i
are used to estimate
depth and density weights for each object based on
the x
i
. The depth weight is computed using the an-
gles θ
i
, and is denoted by dh. The second weight is
computed using the distances d
i
, and is denoted by dy.
Hereafter, their estimations are described, as well as
their fusion.
Depth Estimation: In the depth estimation (i.e.
centrality), all the feature points are taken into ac-
count. Several approaches have been proposed in the
literature for depth measures (Hugg et al., 2006), such
as simplicial estimation (Liu, 1990), half-space esti-
mation (Tukey, 1975), convex-hull peeling estimation
(Eddy, 1982), L1-depth (Vardi and Zhang, 2000), etc.
In this paper, we propose a new depth measure which
is based on the entropy. For each pixel p, the com-
puted angles θ
i
are sorted in ascending order as shown
in Fig 2. Let
˜
θ
i
(
˜
θ
j
≥
˜
θ
i
if j > i) be the sorted angles.
We define ∆
i
as follows:
∆
i
=
(2π+
˜
θ
1
) −
˜
θ
n
if i = 1
˜
θ
i
−
˜
θ
i−1
if i ∈ [2...n]
(1)
˜
θ
1
˜
θ
2
˜
θ
3
˜
θ
n
θ
∆
1
∆
2
∆
3
∆
n−1
0
2π
2π
Figure 2: Sorted angles.
Let p
i
=
∆
i
2π
, p
i
has two properties: 0 ≤ p
i
≤ 1
and
∑
n
i=1
p
i
= 1. Thus, p
i
can be seen as a discrete
probability distribution of the angles. Then, the depth
weight is defined as the entropy of this probability dis-
tribution:
dh(p) =
1
n
n
∑
i=1
−p
i
log
2
p
i
(2)
This depth measure can be explained as follows:
let us consider a point q inside the object with feature
points distributed equitably around it in terms of di-
rections. In this case, we obtain p
0
= p
1
= ... = p
n
,
and the depth weight of point q is equal to 1 (the high-
est weight). Otherwise, if the point q is outside the ob-
ject, the depth weight depends on the angle view (∆
1
can represent the angle view) and the distribution of
the feature points inside the object (p
2
, p
3
,..., p
n
). If
the angle view becomes smaller and smaller (e.g. the
point q is moving away from the object), the depth
weight of the point q becomes also smaller accord-
ingly.
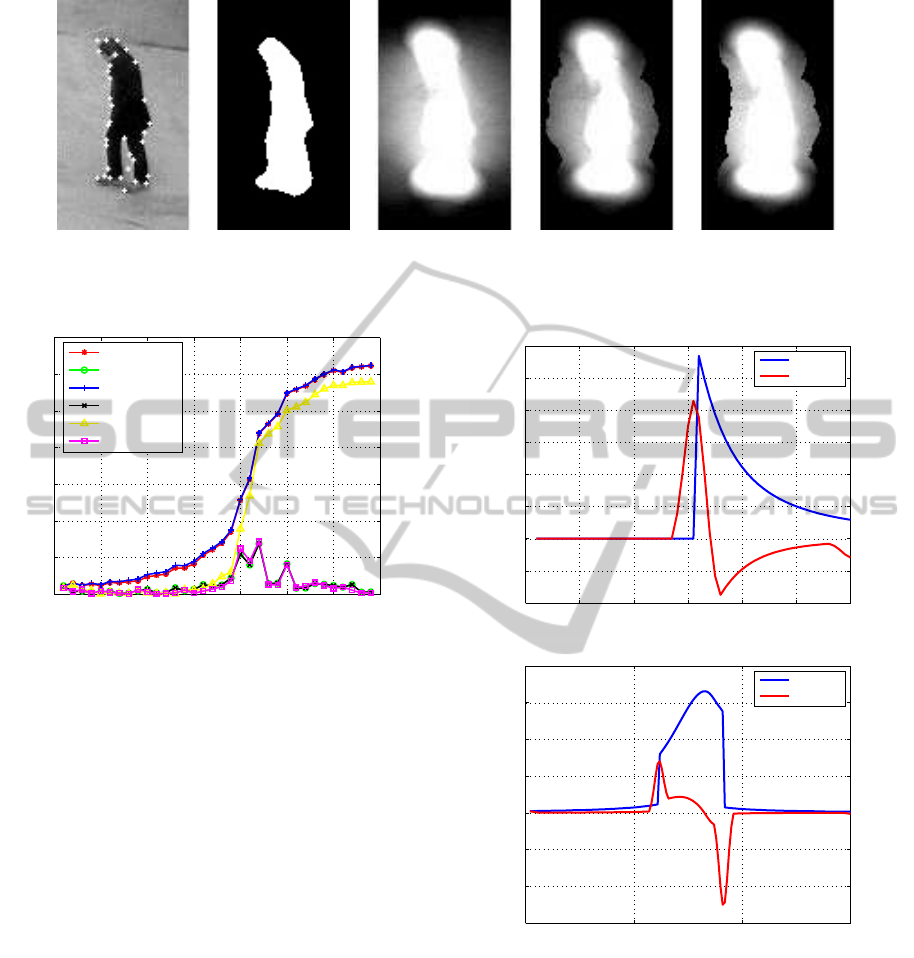
Fig. 3 shows the representation of several state of
the art depth estimations for an object, including our
proposal. As we can see, the entropy depth can bet-
ter represent the shape of the object than the existing
depth measures. In terms of computation time, the
L1-depth and the proposed depth are the most effi-
cient ones compared to other measures. Our exper-
imental tests showed that the choice of a particular
depth measure has a limited impact on the detection
of the rupture. However, the entropy depth measure
may present a significant enhancement compared to
other depth measures, in the applications that need
a precise shape estimation, to describe fine relation-
ships, for example when objects meet.
Density Estimation: For density estimation, for
a given pixel inside the object, only the neighbor fea-
ture points are taken into consideration (feature points
within a certain distance r, or k closest feature points).
Thus, the distances d
i
that are lower than a certain dis-
tance r are taken into account to compute the density
weight for the pixel p as follows:
dy(p) =
M
∑
i=1
(1−
d
i
r
), where d
i
≤ r (3)
where M is the number of points inside the circle of
radius r. This radius can be estimated automatically
and online, based on statistics on the distances be-
tween points, in order to be adapted to the scale of
the object. Fig. 4 (c) shows a representation of the
density estimation.
Fusion of Depth and Density Estimations: We
present a combination approach to fuse the two esti-
mations obtained from depth and density of the fea-
ture points. For the sake of optimization, the pixels
ICPRAM2015-InternationalConferenceonPatternRecognitionApplicationsandMethods
112
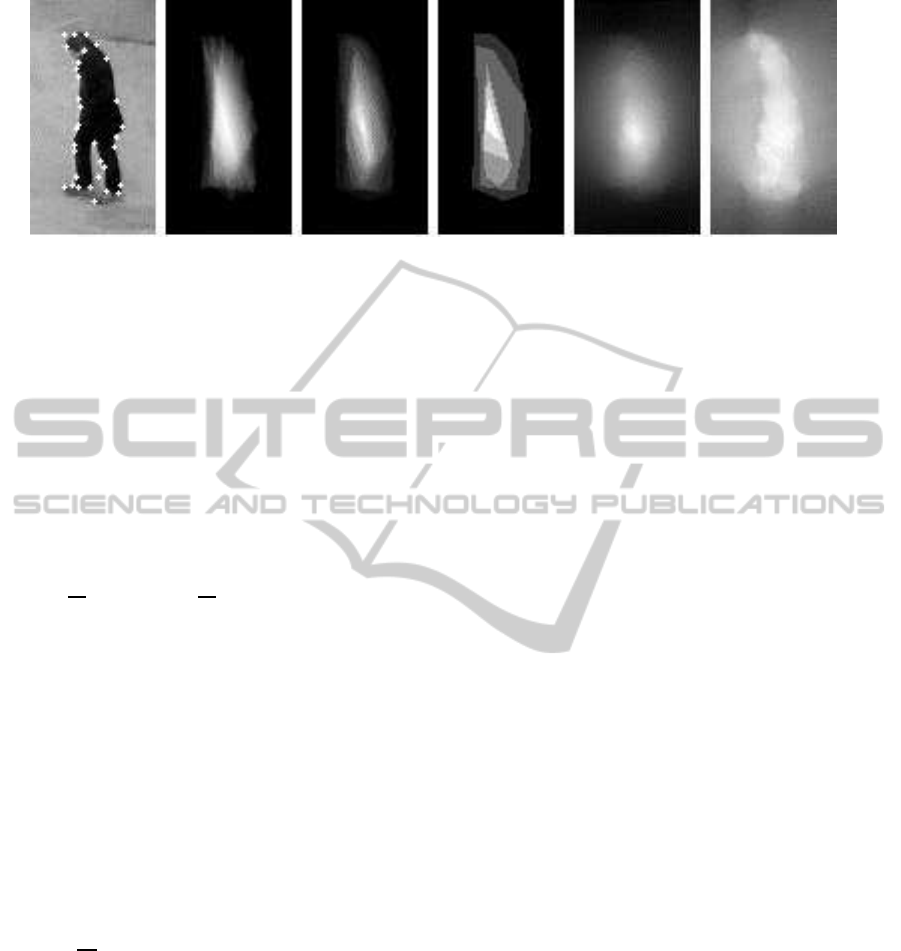
(a) (b) (c) (d) (e) (f)
Figure 3: Depth measures: original object with feature points (a), simplicial estimation (Liu, 1990) (b), half-space estimation
(Tukey, 1975) (c), convex-hull peeling estimation (Eddy, 1982) (d), L1-depth (Vardi and Zhang, 2000) (e), and the proposed
depth (f) (image from PETS 2009 database (PETS, 2009)).
q that are taken into consideration for the fusion are
defined as follows: dy(q) > 0 or dh(q) > th, where th
is a given threshold. The obtained estimation of the
object is referred to as “fuzzy representation”.
Here, the z-score (Carroll and Carroll, 2002) is ap-
plied on the two estimations, in order to make them
comparable. The z-score is the most commonly used
normalization process. It converts all estimations
to a common scale with an average of zero and a
standard deviation of one. It is defined as follows:
Z = (X −
M)/(σ), where M and σ represent the av-
erage and the standard deviation of the X estimation,
respectively. Let Z
dh
and Z
dy
be the depth and density
estimations respectively, after applying the z-score
normalization.
The obtained fuzzy representation, using different
fusion operators, are compared with a Ground Truth
(GT) where the objects are segmented precisely (see
Section 3 for details, and an example in Fig. 4 (g)).
The combination approach which gives the best per-
formance consists in using the two operators min and
max together as defined in the following expression:
F(p) = min
max
Z
dh
(p),Z
dy
(p)
,
ˆ
σ
(4)
where
ˆ
σ =
1
2th
. Then, F is normalized using Min-Max
scaling (Han et al., 2006) to obtain the membership
function µ
F
which varies in [0,1]. This fusion can be
explained as follows: when Z
dh
(or Z
dy
) is greater
than
ˆ
σ, the membership value µ
F
(p) is equal to 1.
Otherwise, µ
F
(p) is less than 1 according to the max-
imum between them. As an example, Fig. 4 shows
different fuzzy representations of the object using min
operator, max operator, and Eq. 4 for the fusion. As
we can see, the last fusion approach shows the best
fuzzy representation of the object according to the
ground truth. The obtained fuzzy representations are
used to compute the spatial relationships.
2.2 Spatial Relationships and Rupture
Detection
Here, the goal is to estimate the spatial relationships
between two objects based on their fuzzy represen-
tation. The angle (Miyajima and Ralescu, 1994) and
distance histograms are selected as examplesto model
the spatial relationships. It is important to note that
the proposed method also applies to other types of
spatial relationships.
Angle Histogram: Given two fuzzy regions A =
{(a
i
,µ
A
(a
i
)),i = 1,...,n} and B = {(b
j
,µ
B
(b
j
)), j =
1,...,m}, where a
i
and b
j
are the elements of A and
B, and µ
A
and µ
B
represent their membership func-
tions respectively, for all possible pairs {(a
i
,b
j
),a
i
∈
A and b
j
∈B}, the angle θ
ij
between a
i
and b
j
is com-
puted, and a coefficient µ
Θ
(θ
ij
) = µ
A
(a
i
) ×µ
B
(b
j
) is
derived. For a given direction α, all the coefficients
of the angles that are equal to α are accumulated as
follows:
h
α
=
∑
θ
ij
=α,i=1,..,n, j=1,..,m
µ
Θ
(θ
ij
) (5)
Finally, h = {(α,h
α
),α ∈ [0, 2π]} is the angle his-
togram. In our case, the histogram can be seen as an
estimate of the probability distribution of the angles.
Thus, the obtained histogram is normalized to display
frequencies of the existed angles with the total area
equaling 1. It is normalized by dividing each value
by the sum R
h
=
∑
α∈[0,2π]
h
α
, instead of normalizing
by the maximum value (which would correspond to a
possibilistic interpretation).
When the objects are represented sparsely by fea-
ture points, then µ
A
(a
i
) = 1 and µ
B
(b
j
) = 1 (where a
i
and b
j
represent the feature points on the objects A
and B respectively), and the same approach is used to
compute the angle histogram between the two sparse
objects A and B.
DetectionofRupturesinSpatialRelationshipsinVideoSequences
113
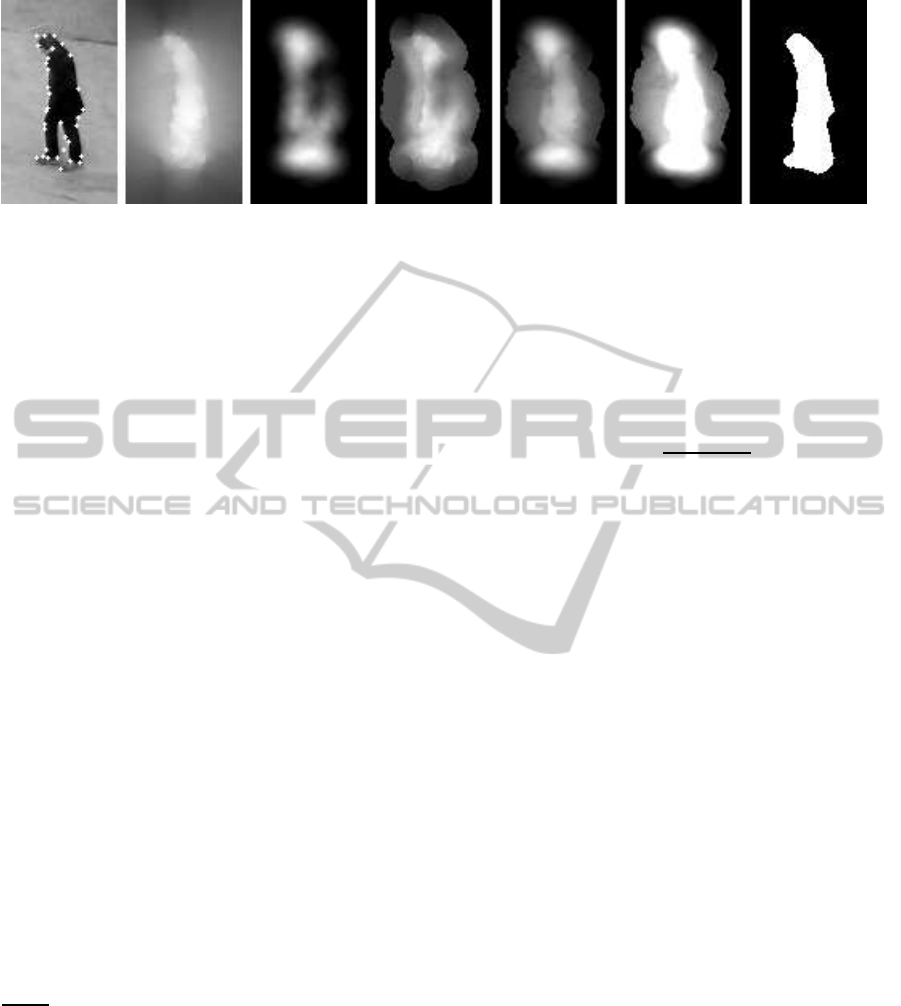
(a) (b) (c) (d) (e) (f) (g)
Figure 4: Original object with the feature points (a), depth estimation (b), density estimation (c), fusion using min operator
(d), fusion using max operator (e), fusion using Eq. 4 (f), and the object segmented precisely GT (g).
Distance Histogram: In this case, all the dis-
tances d
ij
between a
i
(i = 1,...,n) and b
j
(j = 1, ...,
m) are computed. Based on these distances, the dis-
tance histogram is formulated in the same way as the
angle histogram:
h
l
=
∑
d
ij
=l,i=1,..,n, j=1,..,m
µ
L
(d
ij
) (6)
where µ
L
(d
ij
) = µ
A
(a
i
) ×µ
B
(b
j
) and l represents a
given distance value. The obtained histogram is nor-
malized such that the sum of all bins is equal to 1.
Comparison of Spatial Relationships: There are
two main approaches to estimate distances between
histograms. The first approach is known as bin-to-
bin distances such as L
1
and L
2
norms. The sec-
ond one is called cross-bin distances; it is more ro-
bust and discriminative since it takes the distance on
the support of the distributions into account. Note
that the bin-to-bin distances may be seen as particu-
lar cases of the cross-bin distances. Several distances
based on cross-bin distances, such as Quadratic-Form
(QF) distance (Hafner et al., 1995), Earth Mover’s
Distance (EMD) (Rubner et al., 2000), Quadratic-Chi
(QC) histogram distance (Pele and Werman, 2010),
have been proposed in the literature. We have tested
these three distances on different examples, and ex-
periments showed that they were well adapted to an-
gle histograms. Finally, the QF distance was used in
our experiments to assess the distance between the
angle or distance histograms during time, because of
its simplicity. It is defined as follows: d(h
1
,h
2
) =
√
ZSZ
T
, where Z = h
1
−h
2
and S = {s
ij
} is the bin-
similarity matrix. This distance is commonly used for
normalized histograms (the distance histogram for ex-
ample). Here, we propose an approach to adapt it to
the case of angle histograms just by adjusting the el-
ements of the similarity matrix S. We consider that
the two histograms h
1
and h
2
defined on [0,2π] con-
sist of k bins B
i
. Usually, for a distribution on the
real line, the distance between B
i
and B
j
is defined
as follows: x
ij
= |B
i
−B
j
|, where 1 ≤ i ≤ k and 1 ≤
j ≤ k. However, in the case of angle histograms,
the distance between B
i
and B
j
is defined as follows:
x
c
ij
= min(x
ij
,2π −x
ij
) to account for the periodicity
on [0,2π]. Thus, the elements of the matrix S are sim-
ply defined, in the case of angle histograms, using x
c
ij
instead of x
ij
as follows:
s
ij
= 1 −
x
c
ij
max
i, j
(x
c
ij
)
(7)
Criterion for Rupture Detection: Based on the
fuzzy representation of the objects exploiting only
the feature points, the angle or distance histogram h
between two different objects is computed. Let f
i
(i = 0, 1,...,N −1) be the frames of the video se-
quences, and h
i
be the computed angle or distance
histogram between the objects A and B in frame f
i
.
In this paper, we define y(i) = d(h
i
,h
i+1
) for each
i = 0, 1,...,N −1. This function describes the evo-
lution of the angle or distance histograms over time.
If a strong change in the spatial relationships occurs at
instant R (R < N), where R denotes the instant of rup-
ture, this means that the angle or distance histogram
h
R
effectively changes compared to previous angle or
distance histograms (h
i
,i < R). A rupture is detected
according to the following criterion W: ∀i < R −1,
y(R−1) −y(i) > t, and t is a threshold value. Thus,
the instant of rupture R can be effectively detected
from the analysis the function y.
Here, in order to clearly show the instant of rup-
tures in the spatial relationships and removenoise, we
also show the evolution of the function y filtered by a
Gaussian derivative, denoted by g, instead of a simple
finite difference. This filter can remove noise and the
function g effectively exhibits the instant of the strong
changes in the spatial relationships using a threshold
approach. This approach is particularly well suited
for abrupt changes, leading to clear peaks in the func-
tion g, that are then easy to detect (a simple threshold
can be sufficient). For slower changes, a multiscale
approach can be useful to detect more spread peaks.
ICPRAM2015-InternationalConferenceonPatternRecognitionApplicationsandMethods
114
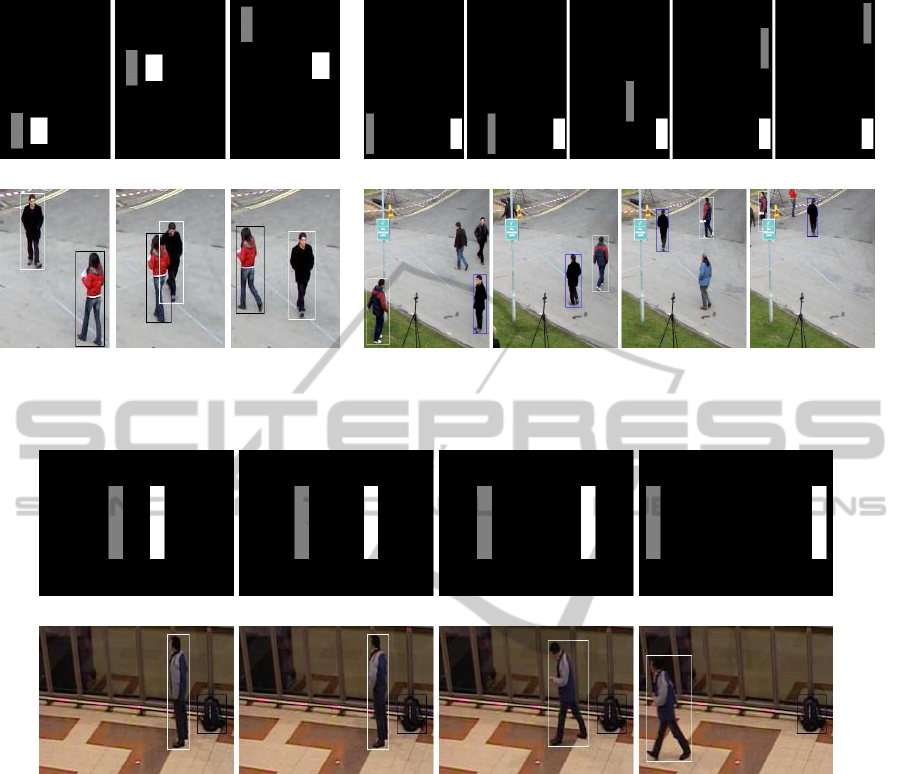
(a) Frames number 1, 30, and 50 of SE 1. (b) Frames number 45, 55, 74, 95, and 105 of SE 2.
(c) Frames number 450, 462, and 468 of
RE 1 selected from PETS 2009.
(d) Frames number 595, 630, 670, and 700 of RE 2 selected from
PETS 2009.
Figure 5: Events SE 1 (a), SE 2 (b), RE 1 (c) and RE 2 (d).
(a) Frames number 1, 5, 10, and 50 of SE 3.
(b) Frames number 1955, 2010, 2060, and 2100 of RE 3 selected from PETS 2006 (PETS, 2006).
Figure 6: Events SE 3 (a) and RE 3 (b).
3 EXPERIMENTS AND
EVALUATIONS
To evaluate the performance of the proposed ap-
proach, we created some synthetic events (illustrated
in Fig. 5, (a) and (b)), and also used a variety of
events selected from the PETS 2009 datasets (PETS,
2009) (illustrated in Fig. 5, (c) and (d)). Here, we
call “event”, some frames that contain a rupture in the
spatial behavior. The results of the proposed fuzzy
representation are also compared to classical segmen-
tation approaches: a binary segmentation approach
(Comanicu and Meer, 2002) and an approach using
differences between the background and the actual
frame. Then, morphological operations are carried
out to remove small objects and fill holes. The last
one is used as ground truth (GT) because it produces
very precise segmentations.
A synthetic event and an event selected from
PETS 2006 dataset (PETS, 2006), displayed in Fig. 6,
are used to illustrate the proposed approach using the
distance histogram.
To associate feature points to objects, here we
simply consider the points included in the bounding
boxes associated with objects available in the PETS
2009 dataset.
3.1 Parameters Tuning
In this section, some results are detailed concerning
the tuning of the parameters that are used in the pro-
posed approach. Specifically, we discuss the estima-
DetectionofRupturesinSpatialRelationshipsinVideoSequences
115
tion of the radius r, which is used in the computa-
tion of the density estimation. Then, some results are
shown for different values of the threshold th, which
is used in the combination of depth and density esti-
mations. Finally, we show the effect of the number of
bins on the computation of the distance between two
angle histograms.
r Parameter: Fig. 7 shows different estimations
of the radius r (normalized) during time. First, all
the possible distances d
ij
among the feature points are
computed. The mean, median, and maximum of these
distances are computed, as shown in the figure (three
first curves). Then, Delaunay triangulation is applied
on the feature points, and two other estimations of
the radius r are computed, as the mean and median
of the lengths of the triangle edges (fourth and fifth
curves). Finally, as in (Lom´enie and Stamon, 2008),
the median of all radius of the circumscribed circle
around the Delaunay triangles provides the last esti-
mation (last curve). As we can see, the maximum of
the distances (third curve) gives the most robust and
stable estimation during time. Other experiments on
different objects show the same result. Thus, the ex-
pression
r = max
i=1,..,n, j=i,..,m
d
ij
6
(8)
is adopted to estimate the radius r for the density es-
timation.
540 550 560 570 580 590 600 610
0.5
0.6
0.7
0.8
0.9
1
Frame number
Mean distances
Median distances
Max distances
Mean Delaunay
Median Delaunay
Median radius Delaunay
Figure 7: Different estimations of the radius r based on the
feature points.
th Parameter: In the fusion of depth and den-
sity estimations, a threshold th is used. Fig. 8 shows
the original object with the feature points, the ground
truth (GT) of the object, and the fuzzy representation
(FR) of the object for different values of th. As we
can see, the proposed fusion approach is quite robust
to the variation of the used threshold th. In the paper,
a value of th equal to 0.5 is used in the combination
of depth and density estimations.
Number of Bins: In this section, we study the
effect of the number of bins (quantification) on the
distance between two angle histograms. We defined
the function y as the distance between two successive
angle histograms in frames f
i
and f
i+1
. Here, we also
define z(i) = d(h
0
,h
i
) for i = 0, 1,...,N −1, i.e. the
distance to the histogram in the initial frame, to con-
sider strong changes in the angle histograms. Fig. 9
shows the evolution of the two functions y and z, for
numbers of bins of 360, 18, and 6. As we can see,
there is almost no difference between 360 and 18 bins,
for the two functions. For a number of bins equal to
6, there is a difference compared to 360 and 16 bins
for the function z. For the function y, the three curves
are almost the same. Thus, the used distance between
two angle histograms is robust to the variation of the
number of bins.
3.2 Ruptures in Spatial Relationships
We now illustrate how the analysis of the distances
between histograms allows us to detect ruptures in
spatial relations, both for orientation and distances.
3.2.1 Angle Histogram
Three snapshots of the first synthetic event (SE) are
shown in Fig. 5 (a) (two objects moving together and
then separately). In this case, there is a rupture in the
directional spatial relationships, when the two objects
diverge. Fig. 5 (b) shows five snapshots of the sec-
ond SE. In this event, the object B moves towards the
object A (fixed) from the left to the right. Then, the
object B changes of direction (frame 74), and when
the object B becomes above the object A, it goes to-
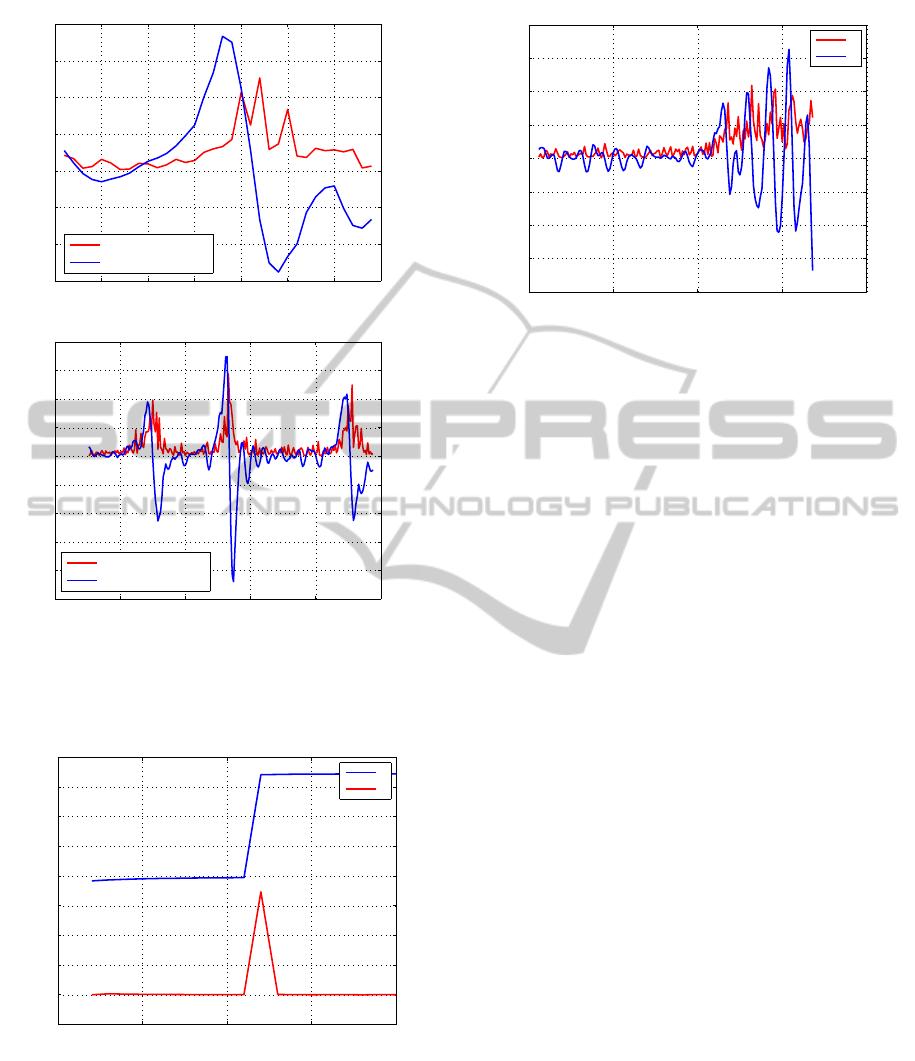
wards the top. Fig. 10 shows the functions y and g
during time for the two events SE 1 and 2. For the
event SE 1, the function y shows a strong variation
at frame number 31. At this instant, there is the rup-
ture in the spatial relationships (the two objects begin
to separate). Using the evolution of g over time, the
instant of the rupture can be detected by applying a
threshold (a threshold of 0.02 can be used to detect the
instants of rupture for the SE). For the second SE, we
can see two strong variations in the function y; the first
strong variation (frame 60) occurs when B changes of
direction with respect to A, the second strong varia-
tion (frame 90) occurs when B becomes above A and
changes its direction towards the top. The function
g clearly shows the two strong variations. Thus, the
proposed method can efficiently detect the instants of
ruptures in the spatial relationships. Other SE were
created and tested using the proposed approach, and
similar results were obtained.
ICPRAM2015-InternationalConferenceonPatternRecognitionApplicationsandMethods
116
Original object GT FR - th = 0.2 FR - th = 0.5 FR - th = 0.8
Figure 8: Original object with the feature points, GT of the object, and fuzzy representations of the object for th equal to 0.2,
0.5, and 0.8 respectively.
440 445 450 455 460 465 470 475
0
0.2
0.4
0.6
0.8
1
1.2
1.4
Frame number
Distance
y - 360 bins
y - 18 bins
y - 6 bins
z - 360 bins
z - 18 bins
z - 6 bins
Figure 9: The functions y and z over time using various
number of bins.
Let us now evaluate the proposed detection of rup-
tures in the spatial relationships in the presence of
noise (deformation of objects, etc.) in real events. For
the real event (RE) 1 (Fig. 5 (c)), the two persons con-
verge then diverge. Fig. 11 (top) shows the functions
y and g over time using the proposed fuzzy represen-
tation, for the event RE 1. Two ruptures in the di-
rectional spatial relationships exist in this event. The
first one is when the two persons meet, and the second
rupture when the two persons separate. It is clear that
the two instants of the ruptures can be efficiently de-
tected using the evolution of g (a threshold of 0.2 can
be used to detect the instants of ruptures for the RE).
In the event RE 2 (Fig. 5 (d)), the two persons (sur-
rounded by white and blue bounding boxes) converge
and diverge several times. In Fig. 11 (bottom), we
show the functions y and g over time, using the fuzzy
representation of the objects, for the event RE 2. All
the ruptures in the directional spatial relationships can
be efficiently detected using the function g.
3.2.2 Distance Histogram
Four snapshots of the third synthetic event are shown
in Fig. 6 (a). At the beginning of this event, the two
0 10 20 30 40 50 60
−0.02
−0.01
0
0.01
0.02
0.03
0.04
0.05
0.06
S. Event 1
y
g
Distance
Frame number
0 50 100 150
−0.06
−0.04
−0.02
0
0.02
0.04
0.06
0.08
S. Event 2
y
g
Distance
Frame number
Figure 10: Functions y and g for events SE 1 (top) and 2
(bottom), computed from angle histograms.
objects diverge at a speed of 5 pixels/frame, and at
a given instant (precisely at frame 10), the speed of
the two objects becomes 10 pixels/frame. Thus, the
velocity of the objects is suddenly increased. Fig. 6
(b) shows four snapshots of the third real event se-
lected from PETS 2006. In this event, the luggage is
attended to by the owner for a moment, and then the
person leaves the place and goes away.
In Fig. 12, the functions y and g during time for
DetectionofRupturesinSpatialRelationshipsinVideoSequences
117
440 445 450 455 460 465 470 475
−0.3
−0.2
−0.1
0
0.1
0.2
0.3
0.4
y
g
Real event 1
Distance
Frame number
550 600 650 700 750 800
−0.5
−0.4
−0.3
−0.2
−0.1
0
0.1
0.2
0.3
0.4
y
g
Real event 2
Distance
Frame number
Figure 11: Functions y and g over time, using the proposed
fuzzy representation, for the events RE 1 (top) and RE 2
(down), computed from angle histograms.
0 5 10 15 20
−0.02
0
0.02
0.04
0.06
0.08
0.1
0.12
0.14
0.16
y
g
Synthetic event 3
Distance
Frame number
Figure 12: Functions y and g over time, using the proposed
fuzzy representation, for the event SE 3, computed from
distance histograms.
the event SE 3 are shown. As we can see, the function
y shows a strong variation at frame number 10, when
the velocity of the objects changes. At this instant, a
rupture in the metric spatial relationships is detected,
1950 2000 2050 2100 2150
−0.08
−0.06
−0.04
−0.02
0
0.02
0.04
0.06
0.08
y
g
Real event 3
Distance
Frame number
Figure 13: Functions y and g over time, using the proposed
fuzzy representation, for the event RE 3, computed from
distance histograms.
using the evolution of g over time.
In the presence of noise, we show in Fig. 13 the
functions y and g during time for the third real event.
When the person leaves the place and goes away, we
can see a strong change in the function y. By nalyz-
ing the obtained results, the instant of rupture in the
metric spatial relationships can be detected. These re-
sults can be used to indicate events occurring in the
video sequences, such as escaping in Fig. 6 (a) and
Left-Luggage in Fig. 6 (b).
3.3 Impact of Object Representation
Here, we show the importance of the fuzzy represen-
tation based on a simple feature points representation.
Two feature detectors, Harris and SIFT, are tested.
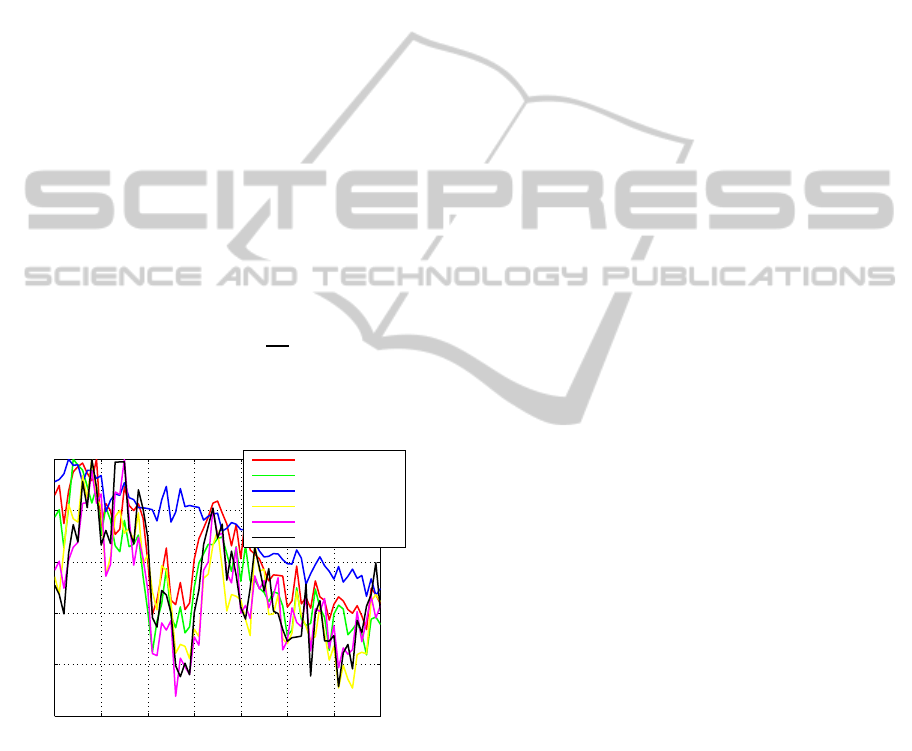
Fig. 14 illustrates the function y during time (com-
puted here from angle histograms) for different rep-
resentations of the objects, for RE 1. The Harris and
SIFT features are directly used to estimate the spatial
relationships between the two objects and to compute
the function y (red and green curves in the figure).
In addition, we show in the same figure the evolution
of the function y computed on the fuzzy representa-
tion of the objects using the Harris and SIFT features
(blue and black curves in the figure). As we can see,
the evolution of the function y obtained from the fuzzy
representation of the objects using the SIFT features
(black curve) can significantly reduce the variation of
the distance (i.e. less amplitude of the curve) on ar-
eas when there is no rupture in the spatial relation-
ships (see Fig. 14, frames 440 to 456) with respect to
the SIFT features without computing the fuzzy rep-
resentation. Thus, the proposed fuzzy representation
of the objects before computing the spatial relation-
ships can improve the robustness of the detection of
ICPRAM2015-InternationalConferenceonPatternRecognitionApplicationsandMethods
118
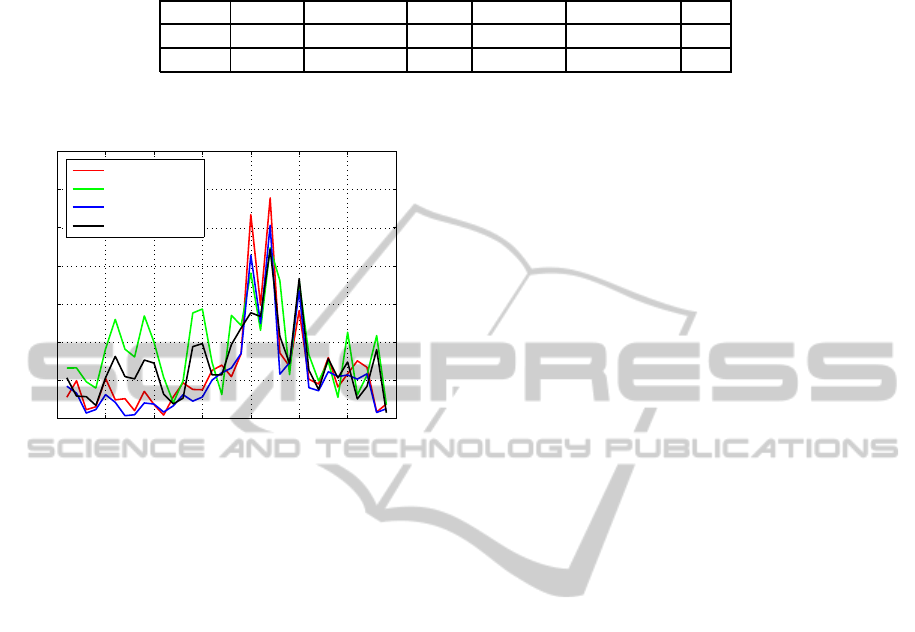
Table 1: Estimated variance of the noise (×10
−4
) (Garcia, 2010) in the function y, for different object representations, for RE
1 and 2.
Event Harris FR Harris SIFT FR SIFT Mean-Shift GT
RE 1 13 12 27 10 31 12
RE 2 7.7 5.48 8.9 7 31 5.4
440 445 450 455 460 465 470 475
0
0.05
0.1
0.15
0.2
0.25
0.3
0.35
SIFT points
FR SIFT
Real event 1
Distance
Frame number
Harris points
FR Harris
Figure 14: Function y over time, computed from angle his-
tograms, for different estimations of the objects: Harris fea-
tures, SIFT features, fuzzy representation (FR) of the ob-
jects using Harris features (FR Harris) and SIFT features
(FR SIFT), for RE 1.
ruptures, based on the observation that SIFT features
are more noisy across frames than Harris features in
this sequence. However, noise is present in the func-
tion y for all object representations. Assuming that
the function y has additive Gaussian noise, the algo-
rithm proposed by Garcia (Garcia, 2010) is used to es-
timate the variance of the noise of the function y, for
the different object representations: Harris features,
fuzzy representation of the objects using Harris fea-
tures (FR Harris), SIFT features, fuzzy representation
of the objects using SIFT features (FR SIFT), the bi-
nary segmentation using Mean-Shift algorithm (Co-
manicu and Meer, 2002) and GT.
Tab. 1 shows the variance of the noise in the func-
tion y, for the different object representations, for
the two events RE 1 and 2. It is clear that the pro-
posed fuzzy representation significantly reduces the
variance of the noise, which becomes close to the one
of the GT. Especially, for SIFT features, the variance
of the noise reduces from 27 to 10 for RE 1, and from
8.9 to 7 for RE 2. In addition, the variance of the
noise of the proposed object representation is signif-
icantly less than the one of the binary segmentation
using Mean-Shift algorithm.
4 CONCLUSION
In this paper, a new method was proposed to de-
tect strong changes in spatial relationships in video
sequences. Specifically, new approaches have been
proposed to compute depth and density estimations,
based on feature points, as well as fuzzy represen-
tations of the objects by combining depth and den-
sity estimations. Exploiting the fuzzy representations
of the objects, the angle and distance histograms are
computed. Then, the distance between the angle or
distance histograms is estimated during time. Based
on these distances, a criterion is defined in order
to detect the significant changes in the spatial rela-
tionships. The proposed method shows good perfor-
mances in detecting ruptures in the spatial relation-
ships for both synthetic and real video sequences.
Future work will focus on further improvement of
the proposed method in order to detect other kinds of
ruptures, and investigating the use of spatio-temporal
relationships. Besides, we will investigate multi-time
scale analysis, in order to better detect events that
take more time to happen. In addition, proposing a
complete event detection framework based on spatial
relationships as discriminative features seems to be
promising.
ACKNOWLEDGEMENTS
This research is part of French ANR project DE-
SCRIBE “Online event detection in video sequences
using structural and Bayesian approaches”.
REFERENCES
Advisor (2000). http://www-sop.inria.fr/orion/ADVISOR/.
Advisor Project.
Avitrackr (2004). http://www-sop.inria.fr/members/ Fran-
cois.Bremond/topics Text/avitrackProject.html. Avit-
rackr Project.
Beware (2007). http://www.eecs.qmul.ac.uk/∼sgg/BEWA
RE/ Beware Project.
Caretaker (2006). http://www-sop.inria.fr/members/
Francois. Bremond/topics Text/caretakerProject.htm.
Caretaker Project.
DetectionofRupturesinSpatialRelationshipsinVideoSequences
119

Carroll, S. and Carroll, D. (2002). Statistics made simple for
school leaders: data-driven decision making. R&L
Education.
Comanicu, D. and Meer, P. (2002). Mean shift: A robust
approach toward feature space analysis. IEEE Trans-
actions on Pattern Analysis and Machine Intelligence,
24(5):603–619.
Cong, Y., Yuan, J., and Liu, J. (2013a). Abnormal event de-
tection in crowded scenes using sparse representation.
Pattern Recognition, 46(7):1851 – 1864.
Cong, Y., Yuan, J., and Tang, Y. (2013b). Video anomaly
search in crowded scenes via spatio-temporal motion
context. IEEE Transactions on Information Forensics
and Security, 8(10):1590 – 1599.
Eddy, W. (1982). Convex hull peeling. In COMPSTAT,
pages 42–47.
Etiseo (2004). http://www-sop.inria.fr/orion/ETISEO/.
Garcia, D. (2010). Robust smoothing of gridded data in
one and higher dimensions with missing values. Com-
putational Statistics and Data Analysis, 54(4):1167 –
1178.
Hafner, J., Sawhney, H., Equitz, W., Flickner, M., and
Niblack, W. (1995). Efficient color histogram in-
dexing for quadratic form distance functions. IEEE
Transactions on Pattern Analysis and Machine Intel-
ligence, 17(7):729 – 736.
Han, J., Kamber, M., and Pei, J. (2006). Data mining: con-
cepts and techniques. Morgan Kaufmann.
Harris, C. and Stephens, M. (1988). A combined corner
and edge detector. In Fourth Alvey Vision Conference,
pages 147–151.
Hu, X., Hu, S., Zhang, X., Zhang, H., and Luo, L. (2014).
Anomaly detection based on local nearest neighbor
distance descriptor in crowded scenes. The Scientific
World Journal, 2014.
Hugg, J., Rafalin, E., Seyboth, K., and Souvaine, D. (2006).
An experimental study of old and new depth mea-
sures. In Workshop on Algorithm Engineering and
Experiments (ALENEX), pages 51–64.
Icons (2000). http://www.dcs.qmul.ac.uk/research/ vi-
sion/projects/ICONS/. Icons Project.
Jiang, F., Wu, Y., and K.Katsaggelos, A. (2009). Detecting
contextual anomalies of crowd motion in surveillance
video. In 16th IEEE International Conference on Im-
age Processing, pages 1117 – 1120.
Liu, R. (1990). On a notion of data depth based on random
simplices. The Annals of Statistics, 18(1):405–414.
Lom´enie, N. and Stamon, G. (2008). Morphological mesh
filtering and α-objects. Pattern Recognition Letters,
29(10):1571 – 1579.
Lowe, D. G. (2004). Distinctive image features from scale-
invariant keypoints. International Journal of Com-
puter Vision, 60(2):91 – 110.
Mehran, R., Oyama, A., and Shah, M. (2009). Abnormal
crowd behavior detection using social force model.
In IEEE Conference on Computer Vision and Pattern
Recognition, pages 935 – 942.
Miyajima, K. and Ralescu, A. (1994). Spatial organization
in 2D images. In Third IEEE Conference on Fuzzy
Systems, pages 100–105.
Pele, O. and Werman, M. (2010). The quadratic-chi his-
togram distance family. In European Conference on
Computer Vision (ECCV), pages 749 – 762.
PETS (2006). http://www.cvg.rdg.ac.uk/PETS2006/data.
html.
PETS (2009). http://www.cvg.rdg.ac.uk/PETS2009/a.html
Piciarelli, C., Micheloni, C., and Foresti, G. (2008).
Trajectory-based anomalous event detection. IEEE
Transactions on Circuits and Systems for Video Tech-
nology, 18(11):1544 – 1554.
Rubner, Y., Tomasi, C., and Guibas, L. (2000). The earth
mover’s distance as a metric for image retrieval. Inter-
national Journal of Computer Vision, 40(2):99–121.
Saleemi, I., Shafique, K., and Shah, M. (2009). Probabilistic
modeling of scene dynamics for applications in visual
surveillance. IEEE Transactions on Pattern Analysis
and Machine Intelligence, 31(8):1472 – 1485.
Tissainayagam, P. and Suter, D. (2005). Object tracking in
image sequences using point features. Pattern Recog-
nition, 38(1):105 – 113.
Tran, D., Yuan, J., and Forsyth, D. (2014). Video event
detection: From subvolume localization to spatio-
temporal path search. IEEE Transactions on Pattern
Analysis and Machine Intelligence, 36(2):404 – 416.
Tukey, J. W. (1975). Mathematics and the picturing of
data. In International Congress of Mathematicians,
volume 2, pages 523–531.
Vardi, Y. and Zhang, C.-H. (2000). The multivariate l1-
median and associated data depth. National Academy
of Sciences, 97(4):1423–1426.
Visam (1997). http://www.cs.cmu.edu/∼vsam/. Visam
Project.
Zhou, H., Yuan, Y., and Shi, C. (2009). Object tracking
using SIFT features and mean shift. Computer Vision
and Image Understanding, 113(3):345 – 352.
ICPRAM2015-InternationalConferenceonPatternRecognitionApplicationsandMethods
120
