
Activity Recognition for Dogs Using Off-the-Shelf Accelerometer
Tatsuya Kiyohara, Ryohei Orihara, Yuichi Sei, Yasuyuki Tahara and Akihiko Ohsuga
Graduate School of Information Systems, University of Electro-Communications, Chofu-city, Tokyo, Japan
Keywords:
Activity Recognition, Accelerometer, Time Series Data Mining, Sensor Data Mining, Acceleration Sensor,
Dynamic Time Warping(DTW), DTW-D.
Abstract:
Dogs are one of the most popular pets in the world, and more than 10 million dogs are bred annually in Japan
now (JPFA, 2013). Recently, primitive commercial services have been started that record dogs’ activities and
report them to their owners. Although it is expected that an owner would like to know the dog’s activity
in greater detail, a method proposed in a previous study has failed to recognize some of the key actions.
The demand for their identification is highlighted in responses to our questionnaire. In this paper, we show
a method to recognize the actions of the dog by attaching only one off-the-shelf acceleration sensor to the
neck of the dog. We apply DTW-D which is the state-of-the-art time series data search technique for activity
recognition. Application of DTW-D to activity recognition of an animal is unprecedented according to our
knowledge, and thus is the main contribution of this study. As a result, we were able to recognize ten different
activities with 65.8% classification F-measure.
1 INTRODUCTION
There are services for dog owners that record dog’s
activity in the form of life logs and report it to them.
Examples of the services include the one provided
by Whistle Lab’s “Whistle” (Whistle Labs, 2013)
and NTT docomo’s “pet fit” (NTT DOCOMO, 2014).
These commercial services recognize raw actions
such as “walking”, “running”, “resting” and “sleep-
ing”. These services themselves are evidences of the
demand to learn pets’ behavior when the owners are
away. However, the variety of actions recognizable
by the current commercial services is limited and far
from being satisfactory. In our analysis, which will
be verified in Section 2 by analyzing the results of a
questionnaire, there are three aspects of the demand
for pet activity monitoring. The first aspect arises
from the interest in short-term healthcare. The sec-
ond aspect originates from the interest in long-term
healthcare. The third and final aspect is related to
problematic behavior of pets.
For example, vomit reporting is desired for a pet
monitoring system because the action is directly re-
lated to internal health condition. The action should
be detected from the aspect of short-term healthcare.
Eye-scratching is an action that can lead to a seri-
ous disease if repeated multiple times. If a pet moni-
toring system reports the number of times the action is
occurred, early treatment by a veterinarian is possible
and a serious condition can be avoided. Therefore the
detection of the action is desirable from the aspects of
long-term healthcare.
In Japan, approximately 70% of the dogs share the
life space with human beings. In such circumstances,
the pet may exhibit problematic behavior such as bit-
ing the furniture and entering the places where it
should not, especially in the absence of owner. The
owners need to know the problematic actions in or-
der to take appropriate corrective measures, hence the
third aspect of the demand for pet monitoring. An ac-
tion related to this aspect is jumping. It is problematic
because it could reflect pets’ intention to touch things
at higher place, which are kept there by the owners
so that the pets could not play with them. Although
there is a study on monitoring the actions of a dog, the
accuracy of detection for those actions is not high.
In this article, we propose a method to monitor
dog’s behavior, which is especially effective in the
recognition of those actions whose demand of detec-
tion is high, according to our analysis of the demands
of the owners. The remainder of this paper is orga-
nized as follows. In Section 2, we will investigate
and analyze a questionnaire to see whether there is a
background to the kind of needs. In section 3, we will
write about the work related to the activity recogni-
tion of the dog and the search technique of time se-
ries data. In Section 4, we will present the algorithm
100
Kiyohara T., Orihara R., Sei Y., Tahara Y. and Ohsuga A..
Activity Recognition for Dogs Using Off-the-Shelf Accelerometer.
DOI: 10.5220/0005212001000110
In Proceedings of the International Conference on Agents and Artificial Intelligence (ICAART-2015), pages 100-110
ISBN: 978-989-758-074-1
Copyright
c
2015 SCITEPRESS (Science and Technology Publications, Lda.)
for the calculation of Euclid distance, DTW distance
and DTW-D distance. Section 5 is dedicated to the
description of the experiments. We will describe the
experimental environments, experimental procedures,
experimental results and discussion. In Section 6, we
will discuss the conclusions and recommendations for
future works.
2 QUESTIONNAIRE SURVEY
FOR NEEDS
2.1 Questionnaire Result
We performed a questionnaire survey with pet own-
ers in order to investigate which actions of the pets
should be recognized by a remote pet monitoring sys-
tem. The questionnaire listed 22 typical actions of the
pets and the owners were asked to tell if they were in-
terested in knowing their occurrence when they were
away. Furthermore, a free-format comment field was
provided to collect the reasons why the owners were
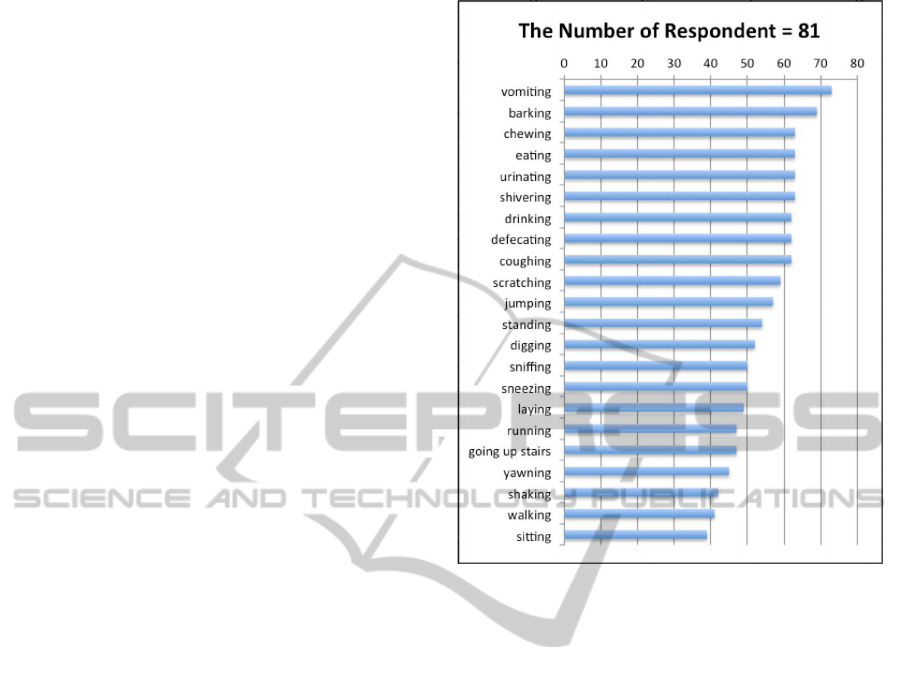
interested in knowing those actions. Figure 1 shows
the questionnaire results and Table 1 shows the com-
ments filled in the free-format field. The action that
gathered the most interest from the owners is vomit-
ing. In addition, the questionnaire result and the free-
format description suggest that many owners are con-
cerned with the health condition of their pets.
2.2 Questionnaire Analysis
Let us focus on behaviors in which more than 70%
of the owners are interested. “Vomiting” and “shiver-
ing” directly reflect the health conditions of dogs, thus
their monitoring is desirable from the aspect of short-
term healthcare. “Coughing” can suggest respiratory
diseases if its frequency is unusually high and so its
monitoring is desirable from the aspect of long-term
healthcare. “Scratching” can lead to a serious dis-
ease if done repeatedly and therefore its monitoring
is also desirable from the aspect of long-term health-
care. “Barking”, “chewing”, “drinking”, “eating”,
“urinating”, “defecating” and “jumping” are poten-
tially problematic actions. “Barking” could make the
neighbors complain. “Chewing” may indicate dam-
age to the furniture. The problem with “drinking” and
“eating” is that a pet might eat or drink something that
the owner does not want it to. “Urinating” and “defe-
cating” could mean a blunder. With “jumping”, a dog
may try to take things at high places. As a result, the
eleven behaviors in which more than 70% of owners
are interested are related to the three aspects intro-
duced in Section 1.
Figure 1: Results of Questionnaire.
3 RELATED WORK
3.1 Activity Recognition for Dogs
There is a study on activity recognition (Ladha et al.,
2013). They use PCA-based feature extraction and
empirical cumulative density function (ECDF) (Ham-
merla et al., 2013). They sample acceleration data
at 30Hz. The acceleration data are divided into one-
second frames and each frame is analyzed separately.
A frame has 50% overlap with its predecessor and
is created with sliding window procedure based on
(Pl¨otz et al., 2010). Each frame is labeled using the
movie which is recorded by one annotator. The fea-
ture vector of each frame is trained and tested using
10-fold cross validation and is classified in each of the
16 actions and one rejection class using k-NN (k=1).
They show the result as a confusion matrix. In their
study, jumping in which 70% of the owners are inter-
ested is not recognizable. Furthermore, seven actions
are with less than 50% recognition accuracies in their
study, and recognition accuracy is less than 80% for
12 actions. Therefore, we must say that there is room
for improvement in the recognition accuracy.
ActivityRecognitionforDogsUsingOff-the-ShelfAccelerometer
101

Table 1: Comments in Free-Format Field.
How much is my dog relaxed?
What kind of facial expression does the dog have?
When the owner is away, what kind of action does the dog often take?
I keep some cats. I am not worried about the state of my house when I am away, because the cats usually sleep. When
I had a dog before, I was worried how the dog was doing. I think it depends on animal species.
It would be nice to talk to a dog at home via a mobile device, when the owner is away.
(Dog)
Showing the stomach.
Going around.
Running around as energetically as possible.
Shaking the tail buzzingly.
Excited with the sound that promises food items even if they are invisible.
(Cat)
Making rumbling sound at the throat.
Putting the face into a paper or plastic bag.
Climbing the curtain when excited.
Waiting at the door for a family member to come home.
Grooming.
The reaction to the sound of phone calls and intercom during the absence of the owner.
I am concerned if the dog gets into trouble while I am away.
My dog silently vomits without having a cough. That makes it difficult for me to notice the vomiting instantly. I want
to notice abnormality as early as possible.
Because my dog is elderly, I am very interested in knowing the behavior of the dog during the absence of my family.
In addition, I am concerned if the dog does some action that leads to an illness.
I currently keep my cat in the room. When I go home, the room is so messy that I can imagine what the cat has been
doing.
Because the dog spends the daytime alone everyday, I leash the dog. So the range that the dog can move within
is narrow. Sometimes my dog can neither jump nor walk. But, I think if the dog spends time without doing any
mischievous act, there would be no need of the leash... [in order to realize the situation] it would be nice if the whole
of the dog’s behavior could be recognized.
I want to see how the dog behaved during the earthquake.
I want to know the action of the dog when it thunders during the absence of me and my family. Because the dog comes
to see me to the door when I go home, I want to know when the dog begins to move. Is it when I open the front door,
I stop the bicycle, or I open the gate?
3.2 Time Series Data Mining
3.2.1 Searching and Mining Trillions of Time
Series Subsequences under Dynamic Time
Warping
There is a problem of finding a subsequence that is
similar to a query sequence in a large scale time se-
ries data. The problem is solved by calculating the
distance between the sequences and the query using
Dynamic Time Warping (DTW). However, the com-
putational cost of DTW is high. As time series data,
that is to be searched, becomes longer, the number of
calculations of DTW increases linearly. As a result,
the computational time for the search becomes enor-
mous. The study proposed a method to solve the prob-
lem by eliminating unpromising candidates at early
stages.
3.2.2 DTW-D: Time Series Semi-Supervised
Learning from Single Example
Time series data with little up-and-downs tend to be-
come close to any data in DTW distance. Because
of this, a sequence with significant temporal change
could be classified as data without one. In order to
avoid a situation like this, Chen et al. proposed a dis-
tance measure called DTW-D.
4 ALGORITHMS FOR
SIMILARITY CALUCULATION
Suppose there are two sequences X = hx
i
|i =
1, ..., Ni, Y = hy
j
| j = 1, ..., Mi. We would like to mea-
sure the distance between X andY in order to measure
the similarity of the sequences of X and Y in wave-
forms. The smaller the distance, the more similar X
and Y. Some distances are commonly used.
ICAART2015-InternationalConferenceonAgentsandArtificialIntelligence
102
4.1 Euclidean Distance
Euclidean Distance (ED) is the classic scale for mea-
suring the similarity among the time series data. It is
measuring the distance between the time series data
of the same length. It is determined by summing up
the distances between the data at the same time index.
ED =
s
N
∑
i=1
(x
i
− y
i
)
2
, (N = M) (1)
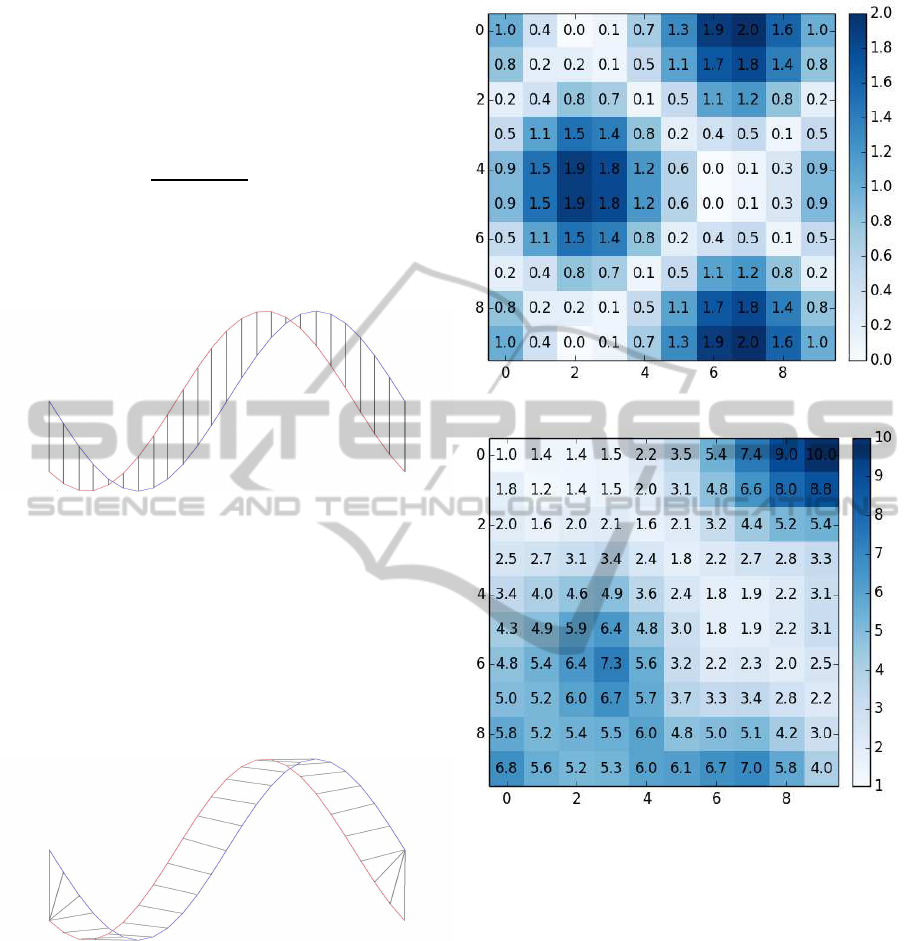
Figure 2 is a figure of alignment of the Euclid dis-
tance.
Figure 2: Alignment of the Euclid distance.
4.2 Classical DTW
A weak point of the ED is that it tends to be large
when the time series data are out of phase. Dynamic
Time Warping is a technique used to find distance
more flexibly between time series data than ED. Fig-
ure 3 shows alignment of the data points that is used
to calculate the DTW distance.
Figure 3: Alignment of the DTW distance.
At first, we calculate cost matrix C ∈ R
N×M
which is
defined by the distance between each element using
equation (2). An example of the cost matrix is shown
in Figure 4.
C(i, j) := c(x
i
, y
j
) = abs(x
i
− y
j
),
(i = 1, ..., N, j = 1, ..., M) (2)
Then, we calculate accumulated cost matrix AC us-
ing equation (3). An example of the accumulated cost
matrix is shown in Figure 5.
Figure 4: Cost Matrix.
Figure 5: Accumulated Cost Matrix.
AC(i, 1) =
i
∑
k=1
c(x
k
, y
1
)
AC(1, j) =
j
∑
l=1
c(x
1
, y
l
)
AC(i, j) = C(i, j) + min{AC(i− 1, j− 1),
AC(i− 1, j), AC(i, j − 1)}, (i, j ≥ 2) (3)
DTW distance is AC(N, M). We have shown the
above-mentioned algorithm in Algorithm.1.
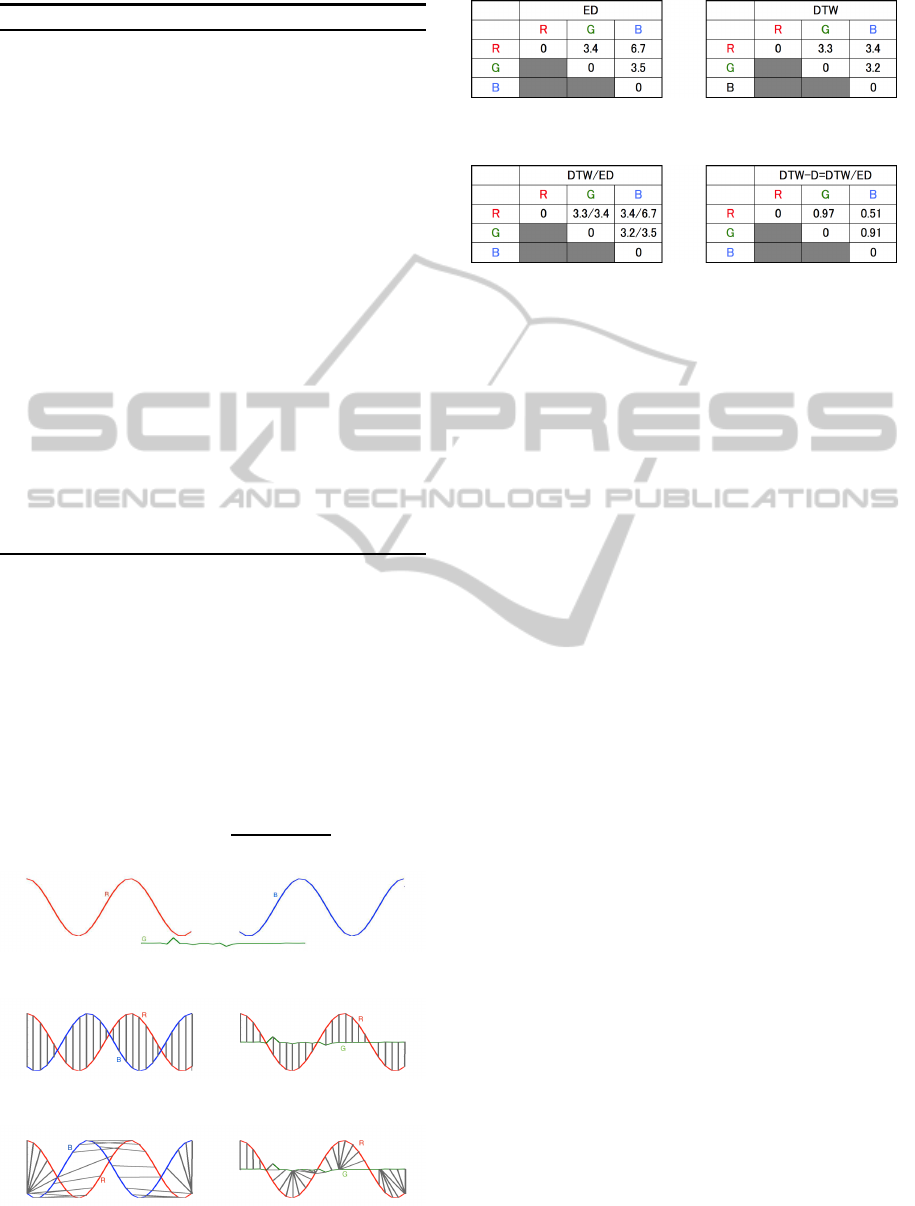
4.3 DTW-D
Let us consider to calculate the distance between each
sequence R, G, B in Figure 6. If we use ED measure,
the alignment of data points will be similar to that in
Figure 7. On the other hand, if we use DTW measure,
ActivityRecognitionforDogsUsingOff-the-ShelfAccelerometer
103
Algorithm 1: Calculate DTW Distance.
Input: sequence X = hx
i
|i = 1, ..., Ni,
Y = hy
j
| j = 1, ..., Mi
Output: DTW Distance AC(N, M)
1: /*Calculate Cost Matrix*/
2: for i = 1 to N do
3: for j = 1 to M do
4: C(i, j) ⇐ abs(x
i
− y
j
)
5: end for
6: end for
7: /*Calculate Accumulated Cost Matrix*/
8: AC(1, 1) ⇐ C(1, 1)
9: for i = 2 to N do
10: AC(i, 1) ⇐ AC(i− 1, 1) +C(i, 1)
11: end for
12: for j = 2 to M do
13: AC(1, j) ⇐ AC(1, j− 1) +C(1, j)
14: end for
15: for i = 2 to N do
16: for j = 2 to M do
17: AC(i, j) ⇐ C(i, j) + min{AC(i − 1, j −
1), AC(i− 1, j), AC(i, j −1)}
18: end for
19: end for
20: return AC(N, M)
the alignment will be like that in Figure 8. In both
cases, the counter-intuitive result that G is more simi-
lar to R than B is, will be derived, as shown in Figure
9.
In order to avoid a situation like this, Chen et
al. (Chen et al., 2013) proposed a distance measure
called DTW-D. DTW-D is calculated by equation (4)
where ε is a small positive constant placed in order to
avoid the division by zero. As shown in Figure 10,
based on DTW-D, B is more similar to R than G is.
DTW−D(x, y) =
DTW(x, y)
ED(x, y) + ε
(4)
Figure 6: Three sequences to calculate distance.
Figure 7: alignment of the ED between R and B, R and G.
Figure 8: alignment of the DTW distance between R and B,
R and G.
Figure 9: ED and DTW Distance in the three Sequence [R,
G, B].
Figure 10: DTW-D distance is the distance that DTW dis-
tance divided by ED.
5 EXPERIMENTAL PROTOCOLS
5.1 Experimental Environments
The experimental subjects and environmentsshown in
Table 2. The conditions of the experiment are as fol-
lows. The acceleration data was collected at sampling
frequency 25Hz. The video was recorded in order to
put the ground truth label. We prepared the accel-
eration sensor shown in Figure 11 on the left side.
The sensor was attached to the neck of the dog as
shown in the Figure 11 on the right side. The ac-
celeration sensor which we used for the experiment
is AX3 Watch of Axivity (Axivity Ltd., 2011). The
sensor is equipped with 3 axes MEMS which works
as an accelerometer. Sampling frequency can be se-
lected from several predetermined values provided by
the tool between 12.5Hz and 800Hz. It has a mounted
NAND flash memory of 512MB to store the data. The
maximum recording time is 14 days at 100Hz, and 30
days at 12.5Hz. Measurement range of the acceler-
ation is ±16g. This sensor has IP68-rated dust- and
water-proof capability that is standardized by Interna-
tional Electrotechnical Commission 60529. Acceler-
ation data is transferred to the PC from the sensor by
using USB. We have shown the definition of the activ-
ity of the dog in Table 3. Figure 12 shows appearance
and dimension of the subjects.
5.2 Experimental Procedures
5.2.1 Procedure of Our Approach
Using ELAN (MPI for Psycholinguistics, 2013),
which is a tool for video annotation, every sample of
the acceleration data is labeled. The label consists of
one of 10 activities shown in Table 3. “Unspecified”
ICAART2015-InternationalConferenceonAgentsandArtificialIntelligence
104
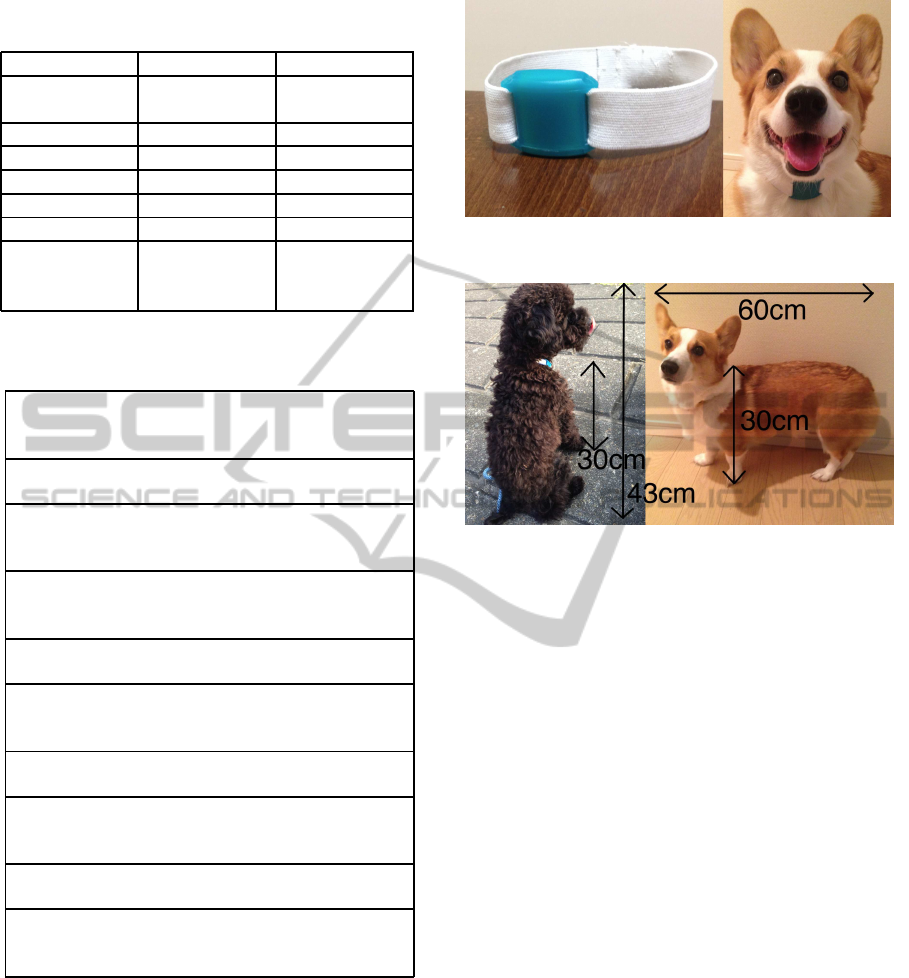
Table 2: Information of the experimental subjects and envi-
ronments.
Name Yuzu Oreo
Breed Pembroke
Welsh Corgi
Toy Poodle
Sexuality Female Male
Age 4-year 8-month
Weight 10.7kg 2.7kg
Body Length 60cm 43cm
Body Height 30cm 30cm
Room Outdoors
Environment (Wooden
Flooring)
(Paved Road
or Ground)
Table 3: Definition of Behavior (the number of DTW-D
frames & PCA-based frames shown in parentheses).
walking: (2781 & 216 frames)
Walking. Movement of the left and right limb is
alternating and not aligned.
eating: (5223 & 401 frames)
Put food in the mouth, and swallow.
sitting: (4140 & 319 frames)
Sitting quietly with buttocks on the floor or
ground.
laying: (5746 & 442 frames)
Lying down and put his head against a fixed object
such as a floor or ground.
sniffing: (370 & 29 frames)
Sniffing the smell of the floor or ground.
running: (961 & 74 frames)
Running. Movement of the left and right limb is
almost aligned.
jumping: (660 & 50 frames)
Foot of all is away from such as a floor or ground.
drinking: (1068 & 82 frames)
Drinking such as water from the dish on the floor
or ground.
shaking: (670 & 50 frames)
Shaking itself to shake off the water.
scratching: (47 & 5 frames)
Scratching eyes by foreleg. Scratching the front
side from the chest by hindleg.
label is given to the behavior that cannot be judged as
one of the 10 activities.
Let us call a subsequence of 25 samples a frame.
A new frame is created by sliding the 25-sample win-
dow forward by one sample. As a result, adjoin-
ing two adjoining frames shares 24 samples of each
other, that is 96% of the frames. When the same
ground truth label appears in more than 20 samples in
a frame, that is 80% of the frame, the whole frame is
given the ground truth label. This is because, average
F-measure became maximum at 80% in 52%∼100%.
Figure 11: The appearance of the sensor and how the dog
wears it.
Figure 12: Size of dogs. (left) Oreo, (right) Yuzu.
Otherwise, the frame is labeled “mixed” and used for
the test and training frames, but that frame is not listed
in a result. We choose one frame from all frames and
set it aside as a test frame. Remaining frames is as-
sumued to be training frames. The test and training
frames are chosen so that there are no shared samples.
The distance between the test and training frames is
calculated using each of the Euclidean, DTW, and
DTW-D methods. We infer a label of a test frame
from the label of the training frame nearest to the test
frame. In other words, we used the nearest neigh-
bor method. This is because, in a preliminary study
comparing performance of k-nearest neighbor meth-
ods for the data, average F-measure became maxi-
mum at k = 1 in k = 1, 3, 5. Recognition accuracy is
calculated through cross validation. Overview of the
experimental setting is shown in Figure 13.
5.2.2 Procedure of Existing Approach
The existing PCA-based approach was also applied
to our data set. Each parameters were chosen to be as
close as possible to the existing study. A new frame
is created by sliding the 25-sample window forward
by 13 samples. As a result, adjoining two adjoining
frames shares 12 samples of each other, that is 48% of
the frames. When the same ground truth label appears
in more than 19 samples in a frame, that is 76% of the
frame, the whole frame is given the ground truth la-
ActivityRecognitionforDogsUsingOff-the-ShelfAccelerometer
105
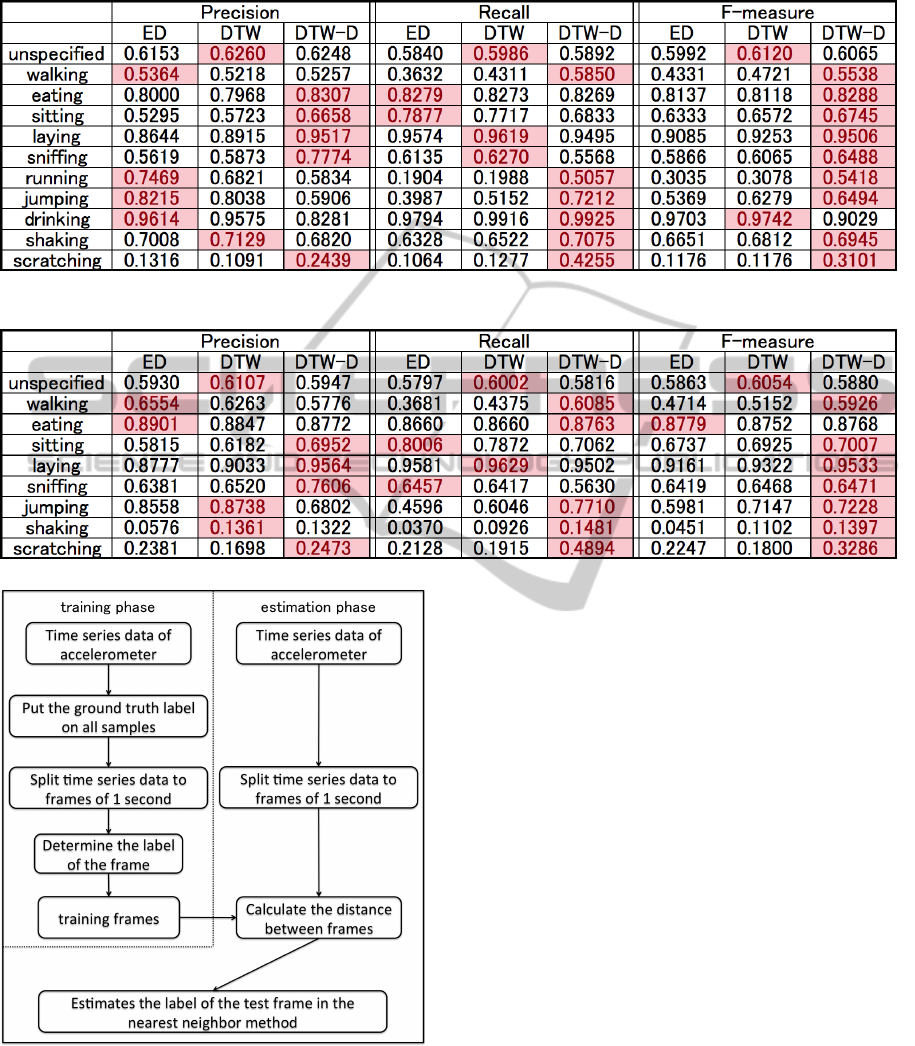
Table 4: Precision, Recall and F-measure at ED, DTW Distance and DTW-D Distance of 2 dogs.
Table 5: Precision, Recall and F-measure at ED, DTW Distance and DTW-D Distance of Yuzu.
Figure 13: Overview of the experimental setting.
bel. We choose one frame from all frames and set it
aside as a test frame. Remaining frames is assumued
to be training frames. In some cases part of the test
frame and training frames have 48% overlap. Each
frame is normalized by inverse ECDF. We projected
them into first 25 principal components in order to
reduce the dimension of the feature of the frames.
The distance between the feature vectors of the test
frame and training frames are calculated. The label
of the test frame is estimated using nearest neigbor
method. Recognition accuracy is calculated through
leave-one-out cross validation.
5.3 Experimental Results and
Discussion
5.3.1 Analyses of the Result of Our Approach
Table 4 and Figure 14 show accuracies and confusion
matrix of our approach obtained through the exper-
iments using data of the two dogs. Table 5 and Fig-
ure 15 show accuracies and confusion matrix obtained
through the experiments using data of Yuzu alone. Ta-
ble 6 and Figure 16 show accuracies and confusion
matrix obtained through the experiments using data
of Oreo alone. In Table 4, 5 and 6, a cell is marked
red if the corresponding distance measure gives the
best result among the three measures.
According to Figure 4, the DTW-D has yielded
high F-measures as compared to the DTW and ED.
Using DTW-D, subtle differences in the actions of
the dog are recognized more precisely than using the
ICAART2015-InternationalConferenceonAgentsandArtificialIntelligence
106
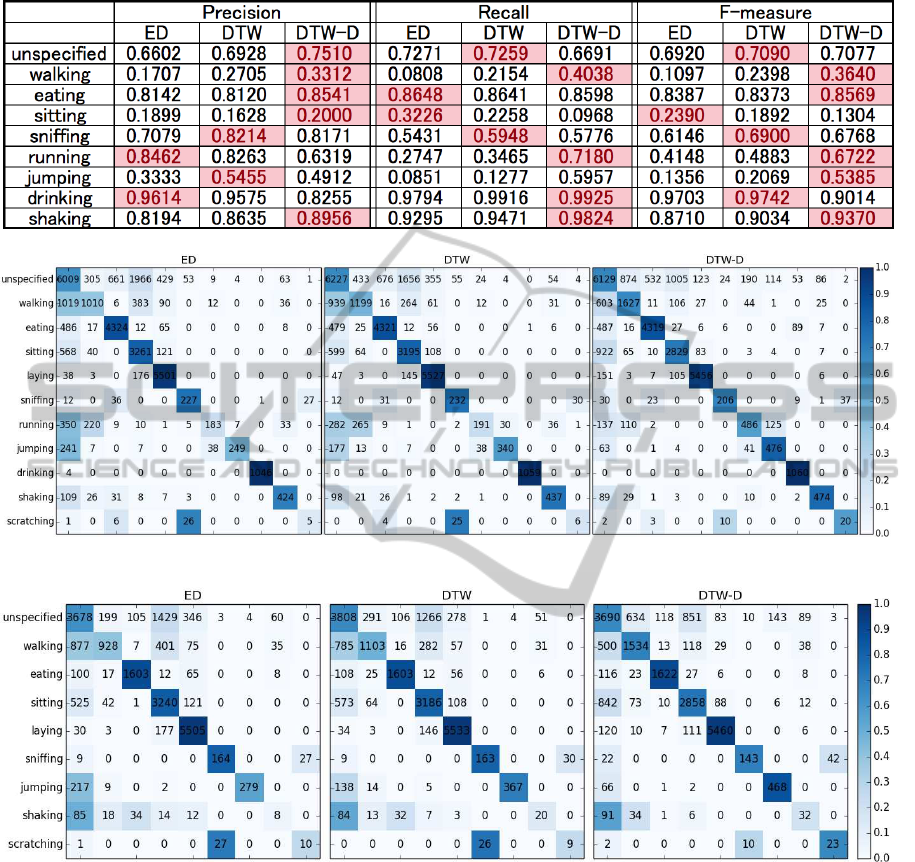
Table 6: Precision, Recall and F-measure at ED, DTW Distance and DTW-D Distance of Oreo.
Figure 14: Confusion Matrix of Euclidean Distance, DTW Distance and DTW-D Distance of 2 dogs.
Figure 15: Confusion Matrix of Euclidean Distance, DTW Distance and DTW-D Distance of Yuzu.
DTW and ED. With DTW-D, it is expected that the
accuracy of activity recognition will be stable even
when the number of actions to be recognized in-
creases. If an action appears only in a part of a frame,
such as jumping, it is difficult for a statistical method
to detect the difference in the feature value from other
actions.
It can be explained that a few samples with signif-
icant feature can be obscured by many ordinary sam-
ples in a statistical method. On the other hand, the
methods that calculate the similarity of waveforms,
such as DTW, are able to detect the difference result-
ing in superior accuracy.
In “drinking”, F-measure of DTW-D is lower than
F-measure of ED and DTW. The reason is because a
part of “eating” frames are estimated to be “drinking”
frames as shown in Figure 14. “Scratching” has re-
sulted an extremely low F-measure. There are only
47 frames of “scratching” in the data. The recall can-
not be good simply because of the shortage of the
data. The resulted few true positives are further over-
whelmed by vast amount of false positives, yielding
the poor precision. This can explain the remarkably
poor F-measure.
The F-measures from the data of the two dogs
roughly falls between those of Yuzu-alone and Oreo-
ActivityRecognitionforDogsUsingOff-the-ShelfAccelerometer
107
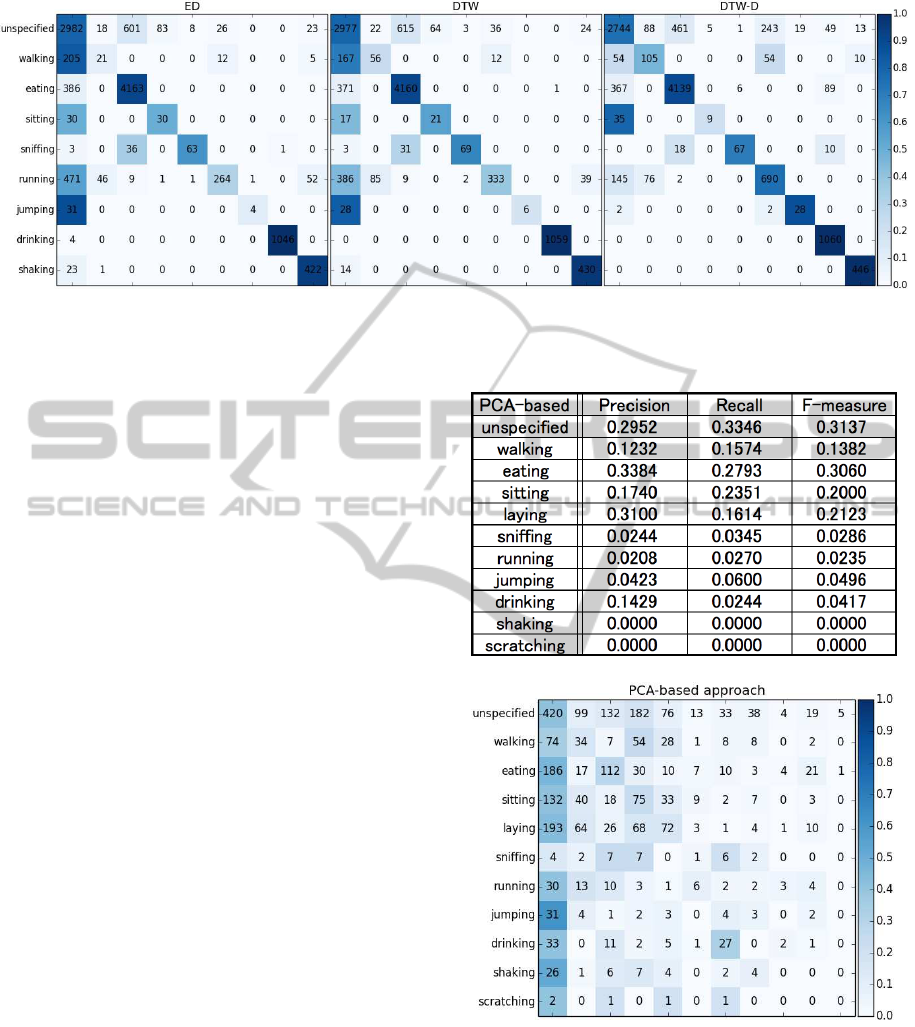
Figure 16: Confusion Matrix of Euclidean Distance, DTW Distance and DTW-D Distance of Oreo.
alone. However, there are some behaviors that has re-
sulted very poor F-measures in the one-dog data, such
as “shaking” for Yuzu and “sitting” for Oreo. Improv-
ing them is a challenge for the future.
5.3.2 Comparison with the Existing Approach
Table 7 and Figure 17 show accuracies and confusion
matrix of the existing approach obtained through the
experiments using data of the two dogs. Comparing
this with Table 4 and Figure 14, it can be said that our
approach has resulted higher F-measures than the ex-
isting approach. This could be explained by a theory
that the amount of data might be too small to perform
the statistical feature extraction. We also think that
valuable information of the data could have been lost
by the interpolation used in the existing approach.
6 CONCLUSIONS AND FUTURE
WORKS
6.1 Conclusions
As seen in the emergence of commercial services that
recognize simple behaviors of the dogs and to record
them as life log, the desire to record the behavior of
the dog has been increasing. However, the activity
recognition ability of the services is limited and the
need to record more detailed actions will arise in the
future. We have investigated the needs and analyzed
what kind of actions of the dog should be recognized
by a pet monitoring system. As a result, we have
found that there are three aspects of the demand for
pet activity monitoring, namely, short- and long-term
healthcare and problematic behavior. The action that
the owners wanted to know the most was “vomiting”.
Furthermore, we have found that there are approxi-
mately 70% of the owners who would like to moni-
Table 7: Precision, Recall and F-measure at the existing
study.
Figure 17: Confusion Matrix of the existing study.
tor “jumping”, whose recognition accuracy was low
in the existing study (Ladha et al., 2013). We ob-
served that the reason behind low recognition accu-
racy of “jumping” was that they used statistical tech-
nique in the study. In addition, in our data set, our
approach has higher F-measure than the existing ap-
proach. Therefore, we focused on the waveform of
time-series data. We applied DTW-D, which is a
ICAART2015-InternationalConferenceonAgentsandArtificialIntelligence
108

method to measure the similarity of the waveform, to
activity recognition in dogs for the first time. As a
result, recognition accuracy for “jumping” is particu-
larly improved as compared to the previous study.
It can be said that it is difficult for a statistical
method to differentiate an action which appears only
in a part of a frame, such as jumping. On the other
hand, methods that calculate the similarity of wave-
forms such as DTW perform well for the actions and
result better recognition accuracy. “Vomiting” which
is the most desired action to be monitored, is also a
brief action. We are optimistic to detect it better with
DTW-D.
6.2 Future Works
6.2.1 Measurement of Heart Rate and
Respiratory Rate at Rest
By measuring the respiratory rate and heart rate at
rest, it is possible to detect the heart or lungs diseases
at early stages. It also makes it possible for dogs to re-
ceive the appropriate treatment by a veterinarian. For
human beings, there is a study by Poh et al. (Poh
et al., 2011). However, because this study measures
the transition of the reflection of light in the skin, ap-
plication of this method to dogs with lots of hair is
difficult. Therefore, we think that the measurement of
heart rate by acceleration sensor is effective.
6.2.2 Pet Location Monitoring in a Room
Whether the behavior becomes problematic or not de-
pends on the place where the pet is kept. If the de-
tailed position of the dog in the room was available,
it would further enhance the usefulness of the activity
recognition. The research of Paasovaara et al. (Paaso-
vaara et al., 2011) could be a hint. Their study pro-
posed the concept of human-dog interaction with so-
cial media. They planned to use a RFID device for
indoor position detection as one of human-dog inter-
actions.
6.2.3 Improvement of Recognition Accuracy
There are actions whose accuracy is low in this re-
search and the existing research. We think that further
improvement in accuracy becomes an issue. Many
small sensors are available now. By the analysis of
the behavior with low recognition accuracy, it can be
decided what kind of sensor needs to be added. Cur-
rently, we are focusing on using sound. We want to
improve the accuracy by adding microphone as a sen-
sor in future.
6.2.4 Further Inspection of the Validity of Our
Approach
We cannot say that our approach has been sufficiently
validated by experiments shown in this paper, both in
terms of the number of individual dogs and the vari-
ety of breeds. Ultimately we would like to have higher
F-measures for any unknown dogs. However, as the
first step, we will carry out an experiment using many
dogs of the same breed and do cross validation be-
tween individuals to verify the robustness of the ap-
proach among the same breed.
ACKNOWLEDGEMENTS
This work was supported by JSPS KAKENHI Grant
Numbers 24300005, 26330081, 26870201.
In performing this study, We would like to thank
everyone that has helped us questionnaire survey.
REFERENCES
Axivity Ltd., (2011), Axivity Ltd., viewed August 28th
2014, http://www.axivity.com.
Chen, Y., Hu, B., Keogh, E. &Batista, GEAPA (2013),
‘DTW-D: Time Series Semi-Supervised Learning
from a Single Example’, in Proceedings of the 19th
ACM SIGKDD international conference on Knowl-
edge discovery and data mining , Chicago, IL, USA,
pp. 383-391.
Hammerla, N. Y., Kirkham, R., Andras, P. & Plo¨otz, T.
(2013). ‘On Preserving Statistical Characteristics of
Accelerometry Data using their Empirical Cumulative
Distribution’, in Proceedings of the 2013 International
Symposium on Wearable Computers, Zurich, Switzer-
land, pp. 65-68.
JPFA, (2013), Japan Pet Food Association, viewed August
28th http://www.petfood.or.jp, in Japanese.
Ladha, C., Hammerla, N., Hughs, E., Olivier, P. & Pl¨otz,
T. (2013), ‘Dog’s Life: Wearable Activity Recogni-
tion for Dogs’, in Proceedings of the 2013 ACM inter-
national joint conference on Pervasive and ubiquitous
computing, Zurich, Switzerland, pp. 415-418.
MPI for Psycholinguistics, (2013), ELAN, ver. 4.6.2, Max
Planck Institute for Psycholinguistics, Wundtlaan, Ni-
jmegen, Nederland.
NTT DOCOMO, (2014), NTT DOCOMO, INC., viewed
August 28th 2014, http://www.docomopet.com, in
Japanese.
Paasovaara, S., Paldanius, M., Saarinen, P., Hakkila, J.
& Vaananen-Vainio-Mattila, K. (2011), ‘The Secret
Life of My Dog Design and Evaluation of Paw
Tracker Concept’, in Proceedings of the 11th Inter-
national Conference on Human-Computer Interaction
ActivityRecognitionforDogsUsingOff-the-ShelfAccelerometer
109

with Mobile Devices and Services , Bonn, Germany,
pp. 231-240.
Pl¨otz, T., Moynihan, P., Pham, C. & Olivier, P. (2010), ‘Ac-
tivity Recognition and Healthier Food Preparation’. In
Activity Recognition in Pervasive Intelligent Environ-
ments, eds L CHEN, CD NUGENT, J BISWAS & J
HOEY, Atlantis Press, Paris, pp. 313-327.
Poh, M. Z., McDuff, D. & Picard, R. (2011), ‘A Medical for
Non-contact Health Monitoring’, in Special Interest
Group on Computer Graphics and Interactive Tech-
niques Conference, Vancouver, BC, Canada, Article
No. 2.
Rakthanmanon, T., Campana, B., Mueen, A., Batista, G.,
Westover, B., Zhu, Q., Zakaria, J. & Keogh, E. (2012),
‘Searching and Mining Trillions of Time Series Sub-
sequences under Dynamic Time Warping’, in Pro-
ceedings of the 18th ACM SIGKDD international
conference on Knowledge discovery and data mining,
Beijing, China, pp. 262-270.
Whistle Labs, (2013), Whistle Labs, Inc., viewed August
28th 2014, http://www.whistle.com
ICAART2015-InternationalConferenceonAgentsandArtificialIntelligence
110
