
Framing Self-quantification for Individual-level Preventive Health Care
Zilu Liang and Mario Alberto Chapa Martell
Department of Electrical Engineering and Information Science, The University of Tokyo
Yayoi 2-11-16, Bunkyo-ku, Tokyo, Japan
Keywords:
Self Health Care, Preventive Health Care, Personal Analytics, Quantified Self, Framework.
Abstract:
Preventive health care is considered a promising solution to the prevalence of chronic diseases. Nevertheless,
preventive health care at the population-level adopts an one-fit-all approach. We intend to solve the prob-
lem through promoting preventive health care at the individual level based on self-quantification. Nowadays
millions of people are tracking their health conditions and collecting huge quantity of data. We propose a Pre-
ventive Health care on Individual Level (PHIL) framework that guides people to leverage their self-tracking
data to improve personal health, which forms a data-driven but objective-oriented methodology. The PHIL
framework consists of five phases: Define, Track, Analyze, Improve and Control (DTAIC), covering the whole
process of a complete self health care project. While the proposed PHIL framework can be implemented to
achieve various health benefit, we selectivelypresent one case study where the subject designed and conducted
a self health care project for sleep quality improvement under the PHIL framework. We hope the proposed
framework can help change the passive role of health care receivers in traditional health care system, and
empower people to actively participate in the health care ecosystem and take the initiative in managing and
improving personal health.
1 INTRODUCTION
According to a study on the causes of death (WHO,
2011), non-communicable chronic diseases, includ-
ing diabetes, cardiovascular and respiratory diseases,
account for two thirds of the death in 2011. As the
population ages worldwide, complex chronic condi-
tions will impose an even larger burden in the fu-
ture (Mathers and Loncar, 2006). This represents
a big challenge to traditional resource-constrained
health care systems which are reactive in nature. In
this regard, preventive health care could be a solu-
tion to the problem. Some preventive health services
are already established or incorporated into primary
health care, which has produced promising and en-
couraging outcomes (Group, 2012; Stieber, 2005).
Nevertheless, existing preventive health care systems
generally adopt the one-fit-all methodology and apply
the same preventive measures to all people, ignoring
the fact that a person could be distinctly difference
from others (Mehl and Conner, 2012).
The self-quantification approach (Swan, 2013) of-
fers a promising solution to the above-mentioned
problem. Self-quantification has the potential to be-
come valuable individual-level compensation to cur-
rent preventive health care systems that are operated
on the population level. According to a survey con-
ducted by Princeton Survey Research Association In-
ternational (Fox and Duggan, 2013), seven in ten
US adults track at least one health metric and huge
quantity of personal data is collected by individuals.
Leveraging the self-tracking data, it would become
possible for individuals to tailor their personal health
management plans to their physiological conditions,
which could be more targeted and effective than the
one-fit-all measures in current population-level health
care systems.
However, regardless of the great potential of the
self-quantification approach, personalized self health
care has not yet been widely adopted. The current
scheme of self-quantification is centered on data col-
lection, ignoring the rationality of what metrics to
track in the first place and what to do with the col-
lected data. Some self-quantification practitioners
tend to test random ideas which are not medically
proven to be associated; or someone have no idea
what to do with the huge quantity of data they have
collected. One of the main obstacle for individuals to
conduct meaningful self-quantification projects is the
lack of a framework that provides guidance on how to
carry out the whole process.
In this paper we propose a general framework,
336
Liang Z. and Chapa Martell M..
Framing Self-quantification for Individual-level Preventive Health Care.
DOI: 10.5220/0005202503360343
In Proceedings of the International Conference on Health Informatics (HEALTHINF-2015), pages 336-343
ISBN: 978-989-758-068-0
Copyright
c
2015 SCITEPRESS (Science and Technology Publications, Lda.)

named Preventive Health care on Individual-Level
(PHIL), to facilitate individual-level preventive health
care using self-quantification approach. The pro-
posed framework intends to shift the methodology
of self-quantification from data-centered to objective-
oriented, and is centered on the idea that opti-
mal outcomes from self-quantification occur only
when the self-tracking data lead to concrete im-
provement actions, which represents a data-driven but
objective-oriented methodology. This framework is
inspired by a data-driven improvement tool called
DMAIC (Pyzdek and Keller, 2014). Since managing
personal health is an essential part of life-quality con-
trol, the DMAIC is a good reference for this research.
The proposed PHIL framework has a five-phase cy-
cle characterized as Define, Track, Analyze, Improve,
Control (DTAIC). Each phase builds on the previous
one, with the goal of sustaining long-term personal
health.
The main contribution of this paper is the pro-
posal of PHIL framework that serves as guideline
for individuals to effectively improve personal health
through meaningful self-tracking activities. The pro-
posed framework aims at not only improving personal
health but also saving cost for potential patients and
society in general. The details of PHIL framework in-
cluding the tasks need to be done and the tools that
one can utilize in each phase will be described in Sec-
tion 3. An example of the implementation of PHIL
framework is presented in Section 4. Conclusions and
future works are discussed in Section 5.
2 RELATED WORK
The self-quantification approach is originated from
the Quantified Self movement, in which individuals
self-track and collect data on various aspects in one’s
daily life, such as diet, physical activities, mood,
blood glucose level, blood pressure, weight, etc. Data
can either be logged manually or collected automati-
cally using wearable sensors (Clifton et al., 2013).
In recent years, the advent of commercial sens-
ing and mobile applications significantly automates
the process of self-tracking. Many people track what
they eat or how much physical activity they do ev-
ery day, and huge amount of data are collected at
the individual level on various aspects in personal
life. Juniper Research (Juniper, 2013) estimated that
users of mobile health devices may reach 100 mil-
lion by 2018 globally, which is 6 times more than
the number of current users. The sharp increase in
the volume and variety of self-quantification data col-
lected poses a big challenge to the management of
these data. Efforts have been made on multiple as-
pects ranging from data integration (e.g. BodyTrack,
Wikilife, Open mHealth), data classification (Almalki
et al., 2014), to data management architecture (Whit-
taker et al., 2012) and standard (HL7, 2014). Us-
ing the tracking tools and data management plat-
forms, some people have conducted their personal
self-quantification projects with the purpose of gain-
ing self-knowledge and improving personal health
and wellbeing (Lewis, 2014).
Whereas data is a most indispensable component
of a self-quantification project, data collection alone
does not necessarily leads to health improvement at
individual level. In reality, some self-trackers tend to
test random ideas which are not medically proven to
be associated; or someone have no idea what to do
with the huge quantity of data they have collected. In
this paper, we seek to address the above-mentioned
problem and propose Preventive Health care on Indi-
vidual Level (PHIL) to frame self-quantification for
personal health care. The details on the proposed
framework will be presented in the following section.
3 PROPOSED FRAMEWORK
The underline idea of the proposed PHIL framework
is to guide individuals to first track the target health
metric (e.g. sleep quality, blood pressure, blood glu-
cose) and potential affecting factors (e.g. life habits,
environmental factors, diet), then analyze the col-
lected data to identify positive and negative affecting
factors of the target health metric, make concrete im-
provement plan to strengthen the positive factors and
eliminating negative factors, and finally sustain long
term improvement. The five phases in PHIL frame-
work, namely Define, Track, Analyze, Improve, Con-
trol, are described in details in the following subsec-
tions.
3.1 Define
The first phase in PHIL is to define the specific health
metric that one seeks to improve, which lays the foun-
dation for a data-driven self health care project. Peo-
ple can start with a reflection on personal life style
with respect to diet, tobacco and alcohol consump-
tion, exercise habit, etc. Based on the retrospection
of one’s life style, people can narrow down to a spe-
cific goal that they intend to achieve through a self-
quantification project, such as losing weight, control-
ling blood sugar level, improving sleep quality, sta-
bilizing blood pressure, to name a few. A good can-
didate metric should has the potential to result in en-
FramingSelf-quantificationforIndividual-levelPreventiveHealthCare
337

Table 1: Tracking and monitoring tools.
Categories Devices & Mobile Applications
Sleep quality Fitbit Tracker, Pebble, WakeMate, Lark, SleepBot, Zeo, Browzee
Physical activity Fitbit Tracker, BodyMedia FIT, Jawbone UP, Nike+FuelBand
Diet & Weight Fitbit Aria Scale, MyFitnessPal
Blood pressure Actipressure
Blood glucose iBGStar
Mood Lume Personal Tracker, MoodPanda
hanced health conditions and has collectible data in
order to achieve quantifiable results. In practice, tar-
get metric could either be a physiological metric such
as weight, blood glucose, blood pressure, or a symp-
tom such as headache, poor sleep quality. The tar-
get metric and the potential affecting factors form the
set of variables that need to be tracked in the next
phase. The target health metric is the dependent vari-
able while the potential affecting factors are the inde-
pendent variables.
In addition to defining the target metric and po-
tential affecting factors, users also need to clarify the
resources or budget available for the self-healthcare
project, as this may limit the duration and the method
of tracking in the next phase.
3.2 Track
The purpose of this phase is to track the set of met-
rics decided in the previous phase to collect sufficient
data. These data will be used in the next phase to
investigate the critical affecting factors of the target
health metric. The data on the target metric also help
establish a baseline which will be compared to the
values of the metric at the end of the project to de-
termine objectively whether improvement has been
made. A data collection plan needs to be created to
decide on how to measure the set of metrics. There is
usually tradeoff between cost and convenience. One
can either use wearable devices or mobile apps to au-
tomatically collect data or use spreadsheet to man-
ually log the values. The former is convenient and
efficient but purchasing and maintaining the devices
could be expensive; the latter is an economic method
but requires will power to persist the repeated work
day after day. The currently available tracking and
monitoring tools are summarized in Table 1. It is nec-
essary to make sure the measurement tools can ensure
sufficient accuracy and precision, as good data is at
the heart of the proposed PHIL framework.
In addition to the tracking on the target metric and
affecting factors, people also need to decide where to
store the collected data. People can choose traditional
local data storage devices such as computer hard disk,
portable hard disk, flash memory (CNET, 2014). Stor-
ing data locally can ensure better privacy but requires
much local storage space. Alternatively, people may
also choose to store the data remotely using online
data storage services based on cloud technology (Just-
Cloud, 2014; MyPCBackup, 2014; Code42, 2014).
Comparisons among different online storage services
can be found in (HealthVault, 2014). Online storage
can help save local storage resources and makes it
easy to synchronize among multiple digital devices,
but the merits are achieved at the sacrifice of weaker
privacy and security. A combined approach using
both local and remote storage is described in (Kamp-
meier, 2014).
3.3 Analyze
The purpose of this phase is to identify the gap be-
tween current and desired status of the target health
metric, and extract insights from the data collected
in the previous phase. The former can be achieved
by plotting the histogram of the target health metric,
while the latter requires applying data analysis tech-
niques.
Since people may use different tools to track dif-
ferent factors, it is usually necessary to integrate
the data from different tracking tools into one data
sheet first. Missing values and wrong data should be
cleaned out as well. The data cannot be used for anal-
ysis until it is integrated and pre-processed. Then peo-
ple can apply analysis techniques to investigate the
relationship between potential affecting factors and
the target health metric, and seek out critical affect-
ing factors. A common approach is to firstly identify
a large number of potential affecting factors of the tar-
get metric and then select the top 3-4 correlated fac-
tors for further validation. Regression accompanied
by statistical tests using p-values (Casson, 2011), His-
tograms, scatter plot (Utts, 2005), and factor analysis
(Harman, 1976) are often applied to understand the
magnitude of contribution of each affecting factor to
the target metric. It is acceptable to use basic tools
if these are appropriate. However, it is preferrable to
use complex analysis tools are often used to gain deep
understanding of the data, such as advanced data ana-
lytics, data mining, and advanced modeling. Various
HEALTHINF2015-InternationalConferenceonHealthInformatics
338
statistics software tools are available to conduct data
analysis and visualization, such as Excel, Statistica,
Weka, R, to name a few. Note that it usually requires
sufficient background in statistics in order to use the
software.
3.4 Improve
The purpose of this phase is to identify, test and im-
plement an solution to the problem. An improvement
plan should be designed and improvement actions
should be conducted. Improvement plan on lifestyle
adjustment and behavior change should be based on
the insight obtained from the previous phase.
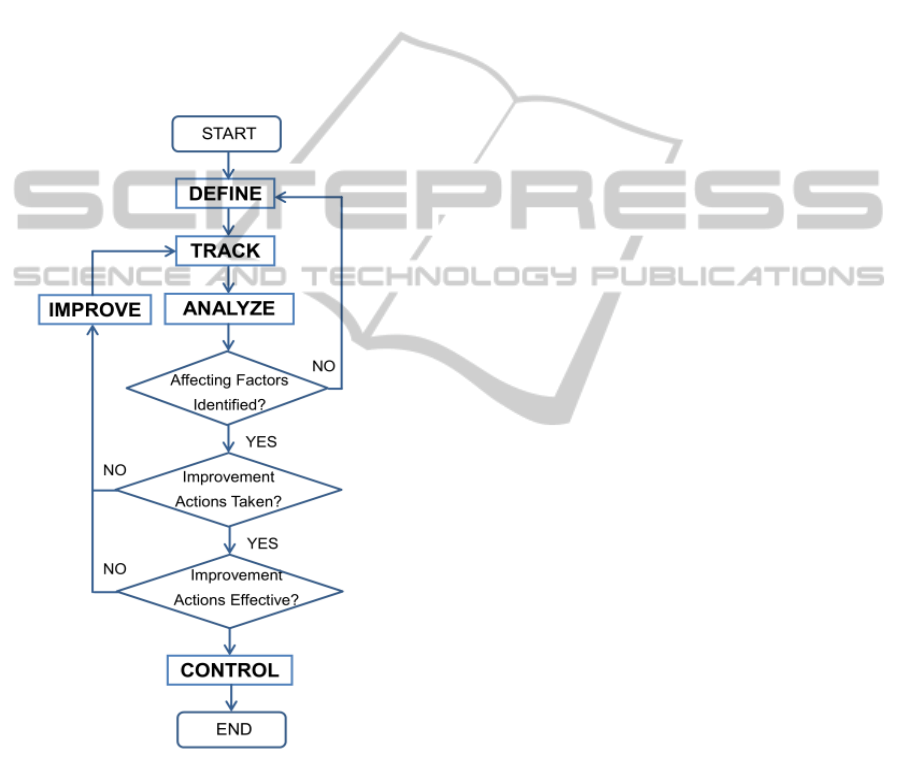
Figure 1: The workflow of PHIL framework.
It is possible to focus on obvious solutions if
these are apparent, or else complex tools like DOE
(Design of Experiments) (Shuttleworth, 2014) should
be applied. For example, an iterative four-step
management method PDCA (plan–do–check–act or
plan–do–check–adjust) (Berengueres, 2012) can be
applied to achieve continuous improvement.
3.5 Control
The purpose of this phase is to sustain the improve-
ment. One needs to keep tracking the target metric
to ensure continued and sustainable success. From
psychological point of view, people need to be mo-
tivated in order to persevere their efforts throughout
the potentially long ”Control” phase. Two methods
can be applied: incremental goal setting and regular
self-reward. Before starting the ”Control” phase, one
can define an initial set of ”motivations” before start-
ing a control plan, such as ”to be a best shape to at-
tend my daughter’s wedding”, ”run next year’s half
marathon”, ”maintain my weight at 60kg”, etc. A
control chart can be useful during this phase to as-
sess the stability of the improvements over time by
not only serving as a guide to continue monitoring
the target health metric but also providing a response
plan in case the process becomes unstable. Statisti-
cal process control (SPC) (ReVelle, 2004) can be ap-
plied in complex scenarios if needed. Every time a
small goal is achieved, one can have a celebration be-
fore setting the next new goals, e.g. go to the opera
with best friend, buy a new dress, etc. Celebrating
behavior change with rewards is the recognition of
the achievement that one has achieved, which helps
build self-esteem and boost morale to continue the ef-
forts. This is very important in sustaining long-term
improvement and maintenance of our health.
The workflow of PHIL framework is illustrated in
Figure 1. Each of the five phases builds on the pre-
vious ones but the whole workflow is not necessar-
ily sequential. Depending on the project, two types
of sub-process cycle may be necessary in order to
achieve meaningful outcomes. The cycle of DEFINE-
TRACK-ANALYZE happens when the ANALYZE
phase shows that none of the potential affecting fac-
tors is correlated to the target metric. In this case,
one has to return to the DEFINE phase to rede-
fine the potential affecting factors until critical af-
fecting factors can be identified in the ANALYZE
phase. This cycle lays the foundation for the fol-
lowing IMPROVE and CONTROL phases. The cycle
of IMPROVE-TRACK-ANALYZE serves to validate
the improvement plan; long-term improvement on the
target health metric is impossible to achieve if the im-
provement plan is not effective in the first place. Peo-
ple may seek professional suggestions or advice from
doctors and physicians throughout the whole process
of a self health care project if they are not certain
about the safety of the decisions they make.
FramingSelf-quantificationforIndividual-levelPreventiveHealthCare
339

Table 2: Summary of Five Phases in PHIL Framework.
Phase Tasks Tools
DEFINE - Identify the target health metric. Brainstorming, literature
- Identify the potential affecting factors. review, Shewhart Chart,
- Clarify the resources of the project. Check Sheets, Pareto Chart
TRACK - Identify the tracking and monitoring tools. Diaries,
- Decide on data storage form and place. excel files,
- Establish and validate data collection system. digital devices,
- Collect sufficient data. mobile applications.
ANALYZE - Integrate data from different sources if necesary. Dashboard,
- Pre-process data to clean out missing value and wrong data. Excel, Statistica,
- Establish a baseline of the target health metric. SPSS, R, Weka, etc.
- Identify the gap between current and desired status.
- Apply data analytics techniques to identify critical
affecting factors.
- Prioritize critical affecting factors to pursue in the
Improve phase.
IMPROVE - Create and test the improvement plan. Brainstorming, literature review,
- Refine the improvement plan. decision matrix,
- Create a detailed implementation plan. DOE, PDCA, etc.
- Take improvement actions.
CONTROL - Create a control plan. Brainstorming, literature review,
- Sustain the improvement on target metric. dashboard, etc.
4 AN EXAMPLE OF PHIL
FRAMEWORK
IMPLEMENTATION
The proposed PHIL framework is a general frame-
work that can be implemented to achieve various
health benefit for sickness prevention, such as weight
reduction, blood pressure control, blood glucose con-
trol, to name a few. Due to the page limitation, we se-
lectively present one case study in this section where
the subject designed and conducted a self health care
project for sleep quality improvement under the PHIL
framework. The subject of this case study is a 25-
year-old healthy Asian female with no medical his-
tory of any significant sickness or chronic diseases.
4.1 Define
The objective of this project is to improve sleep
quality, which is characterized by two target metrics
Wake-Up Freshness (WUF) and Subjective Sleep Ef-
ficiency (SSE). The score of WUF ranges between 0-
5 with 5 representing perfectly alert, while the score
of SSE ranges between 0-5 with 5 representing deep
sleep with no dream. Whereas there are various
approaches to quantify sleep quality (Buysse et al.,
1989; Thomas, 2012), we decide to avoid unneces-
sary complexity in this preliminary case study and de-
signed a simpler scoring system which is summarized
in Table 3.
We conducted a literature review to decide the po-
tential affecting factors for investigation. The demo-
graphic variables, such as age (Doi et al., 2003), eth-
nicity (Stepnowsky et al., 2003), and gender (Vitiello
et al., 2004), are not suitable for individual-level study
because these factors cannot be changed in a person.
In addition, there is no need to consider physical ill-
ness factors (Poelstra, 1984), as the subject does not
have medical history of any significant sickness or
chronic diseases. Furthermore, smoking and alcohol
consumption (Philip and Danner, 1995) are also irrel-
evant factors because the subject does not have these
habits. Based on the above consideration as well as
retrospect of her lifestyle, the following variables are
selected as the potential affecting factors for inves-
tigation in the Track phase. Note that for different
people the potential affecting factors could be signifi-
cantly different.
• Psychological status: stress and mood.
• Environmental conditions: noise and light.
• Lifestyle behaviors: caffeine consumption, elec-
tronic device usage before going to bed, physical
activity level during the day, nap duration, dinner
time, go-to-bed time, sleep duration of previous
day, get-up time, level of tiredness.
HEALTHINF2015-InternationalConferenceonHealthInformatics
340
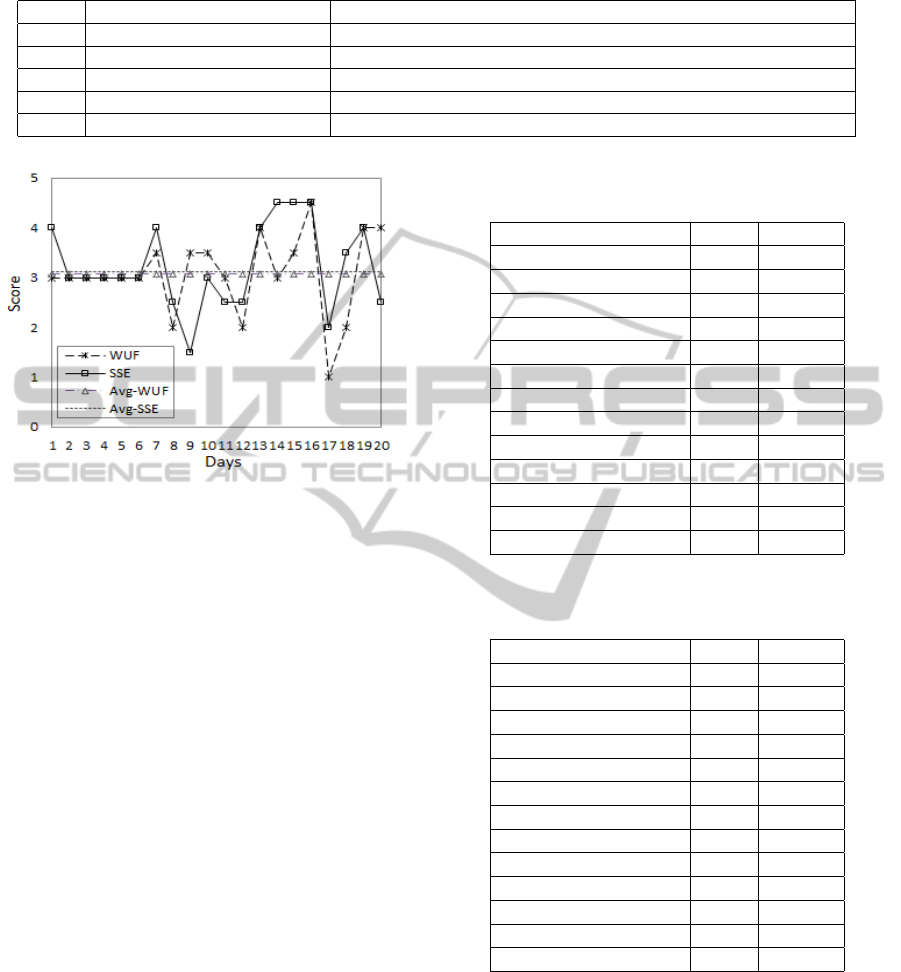
Table 3: Defining target health metrics.
Score Wake-Up Freshness (WUF) Subjective Sleep Efficiency (SSE)
5 Very alert No dream.
4 Alert Being aware of dreaming but no memory of the content.
3 Fairly clear-headed Being aware of dreaming and with blurred memory of the content.
2 Drowsy Being aware of dreaming and clear memory of the content.
1 Very Drowsy Nightmare.
Figure 2: Time series of WUF and SSE over 20 days.
4.2 Track
The tracking of the variables were done in the form
of a diary. The subject kept logging all the potential
affecting factors and the target metrics on a daily ba-
sis and all the data were stored in an Excel file. The
tracking last 20 days.
4.3 Analyze
In order to establish the baseline for comparison, we
first plot the time series of both target metrics in Fig-
ure 2. The average values of WUF and SSE are ap-
proximately 3, which means the subject usually feel
fairly clear-headed when she wakes up in the morn-
ing, being aware of dreaming and with blurred mem-
ory of the content. This indicates that there is much
room for improvement.
We then investigated the correlation between each
potential affecting factor and the target metrics. The
results are presented in Table 4 and 5. We use the
Pearson correlation coefficient (Pearson, 1895), de-
noted as r, to quantify the degree of correlation be-
tween each individual affecting factor and the target
metric. Higher value of r represents stronger cor-
relation. The p value indicates statistic significance,
where p < 0.05 is considered statistically significant
and p < 0.01 is considered very significant (Nuzzo,
2014). The top four correlated factors of WUF are
the activity level during the day, the degree of expo-
Table 4: Correlation between critical individual potential
affecting factor and Wake-Up Freshness (WUF).
Factors r p value
Activity level 0.384 0.094
Light 0.310 0.184
Get-up time 0.230 0.328
Caffeine consumption 0.218 0.357
Nap 0.196 0.406
Tiredness 0.196 0.407
Noise 0.151 0.526
Body temperature 0.143 0.546
E-devices 0.131 0.581
Dinner time 0.129 0.586
Go-bed time 0.069 0.772
Mood 0.058 0.807
Stress 0.025 0.916
Table 5: Correlation between individual potential affecting
factor and Subjective Sleep Efficiency (SSE).
Factors r p value
Nap 0.574 0.008
Get-up time 0.503 0.023
Body temperature 0.441 0.051
E-devices 0.378 0.099
Stress 0.274 0.241
Activity level 0.274 0.241
Mood 0.256 0.275
Dinner time 0.220 0.351
Noise 0.158 0.504
Go-bed time 0.098 0.682
Caffeine consumption 0.069 0.773
Tiredness 0.022 0.925
Light 0.013 0.957
sure to light before going to bed, the get-up time and
the caffeine consumption. The top four correlated fac-
tors of SSE are the nap duration, the get-up time, the
body temperature before going to bed, and the usage
of electronic devices before going to bed.
4.4 Improve
In the previous phase, the analysis of the tracking data
indicates that the nap duration has positive correlation
FramingSelf-quantificationforIndividual-levelPreventiveHealthCare
341
Figure 3: Results of SSE and WUF after taking improvement actions.
to SSE with strong statistical significance, while the
get-up time is negatively correlated to both SSE and
WUF with statistical significance. This finding sug-
gests that taking a nap after lunch may help improve
SSE, while getting up early in the morning may help
improve both SSE and WUF. The subject did some-
times take a nap in the afternoon, but not on a daily
basis. Besides, she reported that her get-up time was
not regular, ranging from 6:00 to 9:00 a.m. without
a particular pattern. Since the solution is very obvi-
ous in this case, it is not necessary to apply DOE and
PDCA. By considering her daily schedule, the im-
provement plan included (1) taking a nap after lunch
and (2) getting up before 7:30 a.m. The subject took
improvement actions from the 21st day on until the
30th day.
4.5 Control
The results of SSE and WUF after taking improve-
ment actions is illustrated in Figure 3. It shows that
the SSE has been substantially improved with the av-
erage score increasing from 3 to 4 after the subject
took improvement actions. The deviation of SSD is
also reduced, which infers that the SSD is under good
control. As to the WUF, the average score is increased
from 3 to 3.5, though the daily score is not as stable
as that of SSE. Since the results are encouraging, the
subject has the confidence to secure the improvement
by maintaining the improvement actions of taking a
nap after lunch and getting up before 7:30 a.m. in the
morning.
5 CONCLUSION AND FUTURE
WORK
In this paper, we have proposed a framework
named PHIL for individual-level preventive health
care in the context of self-quantification. The pro-
posed framework intends to shift the approach of
self-quantification from data-oriented to objective-
oriented, aiming at not only improving personal
health but also saving cost for potential patient and
society in general. The PHIL framework consists of
five phases: Define, Track, Analyze, Improve and
Control (DTAIC). Each phase builds on the previous
one, with the goal of sustaining long-term personal
health. A example was provided on implementing the
PHIL framework to improve personal sleep quality of
a healthy Asian female. Although this case study is
preliminary in nature, it is sufficient to illustrate the
implementation of the PHIL framework.
The PHIL framework is a general framework that
can be implemented to achieve various health bene-
fit, such as weight reduction, blood pressure control,
blood glucose control, to name a few. Providing that
many individuals actively implement the PHIL frame-
work to improve various aspects of their health condi-
tions, not only people’s health can be improved at the
individual level, but also the aggregated health of the
whole population can be substantially improved and
thus public health cost can be reduced. In this regards,
the PHIL framework can benefit both individuals and
the government.
In the next step, we intend to develop an online
self health care system that people can use to imple-
ment the PHIL framework, which can be accessed
by all Internet users regardless of their physical loca-
HEALTHINF2015-InternationalConferenceonHealthInformatics
342

tions. This system will cover various critical aspects
of personal health, including sleep quality, weight,
blood pressure, blood glucose, mood, etc. We will
collect feedback from the users based on which exten-
sive evidence-based study will be conducted to verify
the effectiveness of this framework.
REFERENCES
Almalki, M., Lopez-Gampos, G., Martin-Sanchez, F., and
Gray, K. (2014). Classification of data and activities
in self-quantification systems. Proceedings of HISA
BIG DATA 2014 conference, pages 18–19.
Berengueres, J. (2012). The Toyota production system re-
contextualized. lulu.com.
Buysse, D., Reynolds, C., Monk, T., Berman, S., and
Kupfer, D. (1989). The pittsburge sleep quality index:
a new instrument for psychiatric practice and research.
Psychiatry Res, 28:193–213.
Casson, R. J. (2011). The pesty p value. Clinical & Exper-
imental Ophthalmology, 39(9):849–850.
Clifton, L., Clifton, D. A., Pimentel, M. A. F., Watkin-
son, P. J., and Tarassenko, L. (2013). Gaussian pro-
cesses for personalized ehealth monitoring with wear-
able sensors. Biomedical Engineering, IEEE Transac-
tions on, 60(1):193–197.
CNET (2014). Best storage devices of 2014. Available on-
line at http://www.cnet.com/topics/storage/best-hard-
drives-and-storage/ (Last accessed on July 28, 2014).
Code42 (2014). Crashplan. http://www.code42.com/
crashplan/features/compare/ (Last accessed on July
28, 2014).
Doi, Y., Minowa, M., and Tango, T. (2003). Impact and cor-
relates of poor sleep quality in japanese white-collar
employees. Sleep, 26(4):467–471.
Fox, S. and Duggan, M. (2013). Tracking for health. In Pew
Research Center’s Internet and American Life Project.
Group, D. P. P. R. (2012). The 10-year cost-effectiveness of
lifestyle intervention or metformin for diabetes pre-
vention: an intent-to-treat analysis of the dpp/dppos.
Diabetes Care, 35(4):723–730.
Harman, H. H. (1976). Modern Factor Analysis. University
of Chicago Press.
HealthVault (2014). https://www.healthvault.com/ (Last ac-
cessed on July 28, 2014).
HL7 (viewed on July 28, 2014). Introduction to hl7 stan-
dard. http://www.hl7.org/implement/standards/.
Juniper (2013). Mobile health & fitness: monitoring, app-
enabled devices & cost savings 2013-2018.
JustCloud (2014). http://www.justcloud.com/ (Last ac-
cessed on July 28, 2014).
Kampmeier, C. (viewed on July 31, 2014). Home net-
work data storage and backup. Available online at
http://kampmeier.com/chris/blog/?p=8.
Lewis, D. (2014). Letting go of things we cant control:
remembering that sleep matters. https://scottleibrand.
wordpress.com/2014/07/25/letting-go-of-things-
we-cant-control-remembering-that-sleep-matters-
diyps/.
Mathers, C. D. and Loncar, D. (2006). Projections of global
mortality and burden of disease from 2002 to 2030.
PLoS Med, 3(11):e442.
Mehl, M. R. and Conner, T. S. (2012). Handbook of Re-
search Methods for Studying Daily Life. The Guilford
Press.
MyPCBackup (2014). http://www.mypcbackup.com/ (Last
accessed on July 28, 2014).
Nuzzo, R. (2014). Scientific method: Statistical errors. Na-
ture, 506:150–152.
Pearson, K. (1895). Notes on regression and inheritance
in the case of two parents. Proceedings of the Royal
Society of London, 58:240–242.
Philip, B. A. and Danner, F. J. (1995). Cigarette smoling and
sleep disturbance. Arch Intern Med, 155:734–737.
Poelstra, P. A. M. (1984). Relationship between phys-
ical, psychological, social, and environmental vari-
ables and subjective sleep quality. Sleep, 7(3):255–
260.
Pyzdek, T. and Keller, P. (2014). The Six Sigma Handbook.
McGraw-Hill Education, 4 edition.
ReVelle, J. B. (2004). Quality Essentials: A Reference
Guide from A to Z. ASQ Quality Press.
Shuttleworth, M. (viewed on 31 July, 2014). De-
sign of experiment. Available online at
https://explorable.com/design-of-experiment.
Stepnowsky, C. J., J., M. P., and Dimsdale, J. E. (2003). Ef-
fect of ethnicity on sleep: complexities for epidemio-
logic research. Sleep, 26(3):329–332.
Stieber, J. (2005). preventive health care in australia: The
shape of the elephant, reliance on evidence, and com-
parisons to u.s. medicare.
Swan, M. (2013). The quantified self: fundamental disrup-
tion in big data science and biological discovery. Big
Data, 1(2):85–99.
Thomas, R. J. (2012). Seeking useful biomarkers for the
quality and effectiveness of sleep. Sleep, 35(2):173–
174.
Utts, J. M. (2005). Seeing Through Statistics. Thomson
Brooks, 3 edition.
Vitiello, M. V., Larsen, L. H., and Moe, K. E. (2004). Age-
related sleep change: Gender and estrogen effects on
the subjectiveobjective sleep quality relationships of
healthy, noncomplaining older men and women. Jour-
nal of Psychosomatic Research, 56(5):503–510.
Whittaker, R., Merry, S., Dorey, E., and Maddison, R.
(2012). A development and evaluation process for
mhealth interventions: examples from new zealand.
J Health Commun, 17(Suppl 1):11–21.
WHO (2011). The top 10 causes of death.
FramingSelf-quantificationforIndividual-levelPreventiveHealthCare
343
