
A Fully Automatic Tool for Counting Virchow-Robin Spaces in Magnetic
Resonance Imaging for Lacunar Stroke Study
S
´
ergio Pereira
1
, Jos
´
e A. Mariz
2
, Nuno Sousa
2
, Jos
´
e H. Correia
1
and Carlos A. Silva
1
1
Electronics Department, University of Minho, Campus Azur
´
em, Guimar
˜
aes, Portugal
2
Life and Health Science Research Institute (ICVS), School of Health Sciences, University of Minho, Portugal
and ICVS/3B’s - PT Government Associate Laboratory, Braga/Guimar
˜
aes, Portugal
Keywords:
Virchow-Robin Spaces, Lacunar Stroke, MRI, Medical Image Analysis, Automatic Tool.
Abstract:
Virchow-Robin Spaces surround the perforating arteries of the brain and sometimes they become dilated.
Studies suggest that those structures are correlated with some conditions such as lacunar strokes, small vessel
diseases, multiple sclerosis or even normal aging. However, the majority of those studies are based on the
detection of those structures by a human expert, in some regions of interest, which is prone to the subjectivity
of the person doing the task. Moreover, dilated Virchow-Robin Spaces may look similar to lacunar strokes,
making them difficult to identify. Few works have been proposed on the computational detection of dilated
Virchow-Robin Spaces. In this paper, we propose a fully automatic tool, capable of preprocessing the magnetic
resonance images, extract the most relevant regions of interest and detect dilated Virchow-Robin Spaces. Such
a tool may be useful to eliminate human subjectivity, but also to improve the reproducibility of the studies,
leading to more reliable correlations. An application to visualize and count the detected structures was also
built, with the aim of helping in a study of the correlation of lacunar strokes, Virchow-Robin Spaces and
vascular dementia.
1 INTRODUCTION
Virchow-Robin Spaces (VRS) are the spaces, filled
with cerebrospinal fluid (CSF) and intersticial fluid,
between the perforating arteries of the brain and an
extention of the pia mater that surrounds the blood
vessel (Rouhl et al., 2008). Typically, VRS are micro-
scopic structures, but they can become dilated, which
makes them visible in magnetic resonance imaging
(MRI), with intensity near the CSF. However, the di-
mensions of dilated VRS are, usually, between 3 mm
and 15 mm for its length and up to 3 mm in diameter
(Descombes et al., 2004), which is near the resolu-
tion of the MRI scanners. So, the identification of
these structures is difficult not only for computational
methods, but also for physicians. In fact, they may be
mistakenly identified as lacunar strokes (Hern
´
andez
et al., 2013).
The importance of detecting dilated VRS is re-
lated with studies that suggest that there is a cor-
relation between the number of these structures and
some diseases or conditions, such as lacunar strokes
and other small vessel diseases (Doubal et al., 2010;
Rouhl et al., 2008); it can, also, be useful to distin-
guish vascular dementia from Alzheimer’s Disease
(Patankar et al., 2005). Additionally, it was found
a correlation between multiple sclerosis and the vol-
ume of dilated VRS, but not with its number (Wuerfel
et al., 2008). Those studies divided dilated VRS into
the regions where they were observed, being the most
common, and most relevant for the studies, the basal
ganglia and cerebral white matter (WM) (Patankar
et al., 2005; Doubal et al., 2010; Rouhl et al., 2008).
However, dilated VRS are also observed in healthy el-
derly people and, although less frequently, in younger
people, which makes some authors to argue that it is
just a feature of normal aging (Groeschel et al., 2006).
There are few works dedicated to computational
methods for the detection of dilated VRS. In (De-
scombes et al., 2004), the authors proposed an au-
tomatic method by modeling the geometry and spa-
tial distribution of dilated VRS with a Marked Point
Process, that was, then, optimized with a Reversible
Jump Markov Chain Monte Carlo (RJMCMC) algo-
rithm and simulated annealing, using the T1-weighted
MPRAGE sequence. Other authors applied a multi-
sequence approach with thresholds and connected re-
gions, but it had the disadvantage of being semiauto-
matic (Wuerfel et al., 2008). It is difficult to differen-
tiate lacunar infarcts from VRS, even for specialists,
69
Pereira S., Mariz J., Sousa N., Correia J. and Silva C..
A Fully Automatic Tool for Counting Virchow-Robin Spaces in Magnetic Resonance Imaging for Lacunar Stroke Study.
DOI: 10.5220/0005199700690075
In Proceedings of the International Conference on Bioimaging (BIOIMAGING-2015), pages 69-75
ISBN: 978-989-758-072-7
Copyright
c
2015 SCITEPRESS (Science and Technology Publications, Lda.)

Figure 1: Proposed pipeline.
so in (Uchiyama et al., 2008) it was proposed an auto-
matic method that extracted both, and then identified
VRS with a neural network classifier. Other times
dilated VRS were treated as false positives, such as
in (Ramirez et al., 2011), where the objective was to
segment subcortical hyperintensities with an adaptive
threshold, and after that VRS were removed by delet-
ing small connected components.
A recent review on automatic assessment of di-
lated VRS (Hern
´
andez et al., 2013) concluded that
there are too few methods. It is pointed out that a
successful method would be multi-sequence, and it
should detect dilated VRS for different brain regions,
taking into account the intensity, shape, size, loca-
tion and spatial distribution. We believe that given
the clinical attention those structures are receiving, a
method for the automatic detection of dilated VRS
would be important, since it would lead to more re-
producible evaluation and more meaningful results.
In this paper, we propose a complete and fully au-
tomatic tool for the detection of dilated VRS, using
MRI, in two specific brain regions, the basal ganglia
and cerebral WM. The aim of the proposed tool is for
supporting a study on lacunar strokes and its corre-
lation with dementia. The pipeline comprises several
procedures, namely the correction of the bias field,
skull stripping, extraction of regions of interest and
detection of dilated VRS. Finally, it was, also, devel-
oped an application to display the counting and to fa-
cilitate the analysis of the detected dilated VRS.
The remainder of this paper is organized as fol-
lows. In Section 2, we present the stages of the
pipeline and the main features of the graphical appli-
cation. We discuss results and show some images of
detected VRS and the graphical application in Section
3. Finally, we summarize the main contributions and
identify future developments in Section 4.
2 METHODS
The proposed tool has three main stages: preprocess-
ing, extraction of the region of interest (ROI) of the
brain, and detection and counting of dilated VRS.
Also, a graphical user interface was developed to per-
mit the visualization and inspection of the detected
structures (Figure 4). Figure 1 depicts the proposed
pipeline. Each stage comprises the execution of sev-
eral algorithms, whose implementation is found in
public neuroimaging packages or in-house solutions.
These commands are integrated in the pipeline us-
ing the software package Nipype (Gorgolewski et al.,
2011), allowing their automatic execution.
2.1 Preprocessing
Since our goal was to obtain an automatic tool that
could be applied right after the acquisition of the im-
ages, the first stage aims to prepare the acquired im-
ages for segmentation.
We start by correcting the bias field with the
N4ITK method (Tustison et al., 2010), which ensures
that the intensity of the same type of tissues stays uni-
form along the brain. This is important because we
use the intensities of the tissues to build filters, ana-
lyze VRS candidates and segment WM and gray mat-
ter (GM), in a further stage. After evaluating other al-
ternatives, we opted for the skull stripping procedure
distributed with Freesurfer (S
´
egonne et al., 2004); this
step is important for our tissue segmentation method.
As the last step in the preprocessing stage, we denoise
the image, since noise increases the false detection
of dilated VRS. We selected the rotationally invariant
(a) (b)
Figure 2: Effect of denoising. In a) can be observed the
original image, before denoising; the resulting image, with-
out noise is in b).
BIOIMAGING2015-InternationalConferenceonBioimaging
70

nonlocal means filter (Manj
´
on et al., 2012), which in
our tests preserved better the fine details and had less
smoothing, which could compromise the detection of
dilated VRS, as can be observed in Figure 2.
2.2 Extraction of the Regions of Interest
In this stage, the basal ganglia and cerebral WM are
extracted.
2.2.1 Basal Ganglia
Basal ganglia comprises the caudate nucleus, puta-
men and globus pallidus. This region together with
the brainstem was segmented with the subcortical
segmentation method included in Freesurfer (Fischl
et al., 2002). The reason for the inclusion of the brain-
stem is that it contains substantia nigra, which is an
important region with penetrating arteries. However,
this ROI is commonly affected by strokes and microb-
leeds that sometimes result in holes in the segmenta-
tion. To cope with the incorrect segmentation, we ap-
ply the dilation morphological operator to close the
holes. This dilation permits, also, to extend the seg-
mentation to include the subinsular region, which is
an important region for dilated VRS. The basal gan-
glia of one subject in the axial plane, before and after
correction, can be observed in Figure 3.
(a) (b)
Figure 3: Basal ganglia segmented by freesurfer (a) and af-
ter correction (b).
2.2.2 Cerebral White Matter
To extract the cerebral WM, it was applied a method
developed in-house (Pereira et al., 2013) to segment
the brain into CSF, GM and WM. This segmentation
is performed by classifying each voxel according to
the tissue type. The classifier is a Random Forest,
which exhibits important properties as being a multi-
class classifier and having good generalization capa-
bilities for unseen data. Also, it is capable to handle
large feature vectors without overfitting, which per-
mits good characterization of the problem. As fea-
tures, we used the intensity of the voxel, measures
(mean, sum and median) in the axial plane centered
in the voxel under analysis with areas of 3, 9, 15 and
19 mm
2
, tissues posterior probabilities, tissues prob-
ability maps and the magnitude of the gradient.
As the segmentation is performed by classifying
each voxel individually, we may obtain isolated mis-
classified voxels. These are found and replaced by
the mode of the neighborhood. Finally, the subcorti-
cal segmentation obtained using Freesurfer is used to
remove the cerebellum and brainstem.
2.3 Detection of Dilated Virchow-Robin
Spaces
For detecting VRS, we propose an extension of the
method proposed by Descombes et al.(Descombes
et al., 2004), which we briefly describe bellow, in-
dicating steps where we have diverged from, in our
implementation.
Given the geometry of dilated VRS, Descombes
modeled them as cylindrical structures with length be-
tween 3 and 15 mm and diameter between 1 and 3
mm. Since their intensity is similar to the CSF and
they are surrounded by normal tissue, whose inten-
sity is higher and contrasts with the VRS, the image
is filtered in each plane with three filters. This fil-
tering aims to enhance the voxels whose properties
are similar to a VRS. The formulation of these fil-
ters are based on the mean and standard deviation of
the CSF, GM and WM, which requires the segmen-
tation of the brain in those regions. Departing from
the original proposal (Descombes et al., 2004), we
have used the segmentation method proposed in the
previous section. The original proposal was based on
a region growing method; the segmentation provided
by this method has potential to be impaired by a class
leaking into another region, which may require inter-
vention from the user, while the segmentation method
proposed in the pipeline is completely automatic.
The candidates obtained as output of the com-
bined response of the filters have to be aggregated
as a possible VRS. Departing from the authors, for
each positive value, we have found the direction for
which that response happened, and we followed it by
advancing one slice in each iteration until there isn’t
more positive values in the 9 voxels right in front of
the last that have been included; doing so, it was pos-
sible to find a starting point and the length of each
candidate.
Having the candidates to dilated VRS, their geom-
etry, interaction among them and their intensity were
modeled with a Marked Point Process (Descombes
et al., 2004). Each candidate, s, has a point, corre-
sponding to the point where it starts, x, and a mark, l,
AFullyAutomaticToolforCountingVirchow-RobinSpacesinMagneticResonanceImagingforLacunarStrokeStudy
71

that is a 3D vector representing the length and orien-
tation of the candidate in each axis; so, s = (x, l).
Given a configuration of marked points (c), the
model, h, is composed by a prior term, f , and a data
term g (Descombes et al., 2004),
h(c) = f (c)g(c) (1)
The prior term models the length of the candidates
and relations between them, while the data term takes
into account the intensity along the candidate, as well
as the intensity after each of its ending voxels.
In order to select the configuration of candidates
corresponding to real dilated VRS, Descombes em-
ployed a Reversible Jump Markov Chain Monte Carlo
algorithm with simulation annealing to globally op-
timize the model. Diverging from Descombes, who
have used a geometrical cooling schedule, we have
chosen to follow an exponential cooling schedule
(equation (2)), as described in (Murphy, 2012), be-
cause we have found that it provided better conver-
gence.
T
t
= T
0
C
t
, (2)
where T
t
is the temperature at iteration t, T
0
is the ini-
tial temperature, defined as T
0
= 1, and C is the cool-
ing rate, defined as C = 0.8.
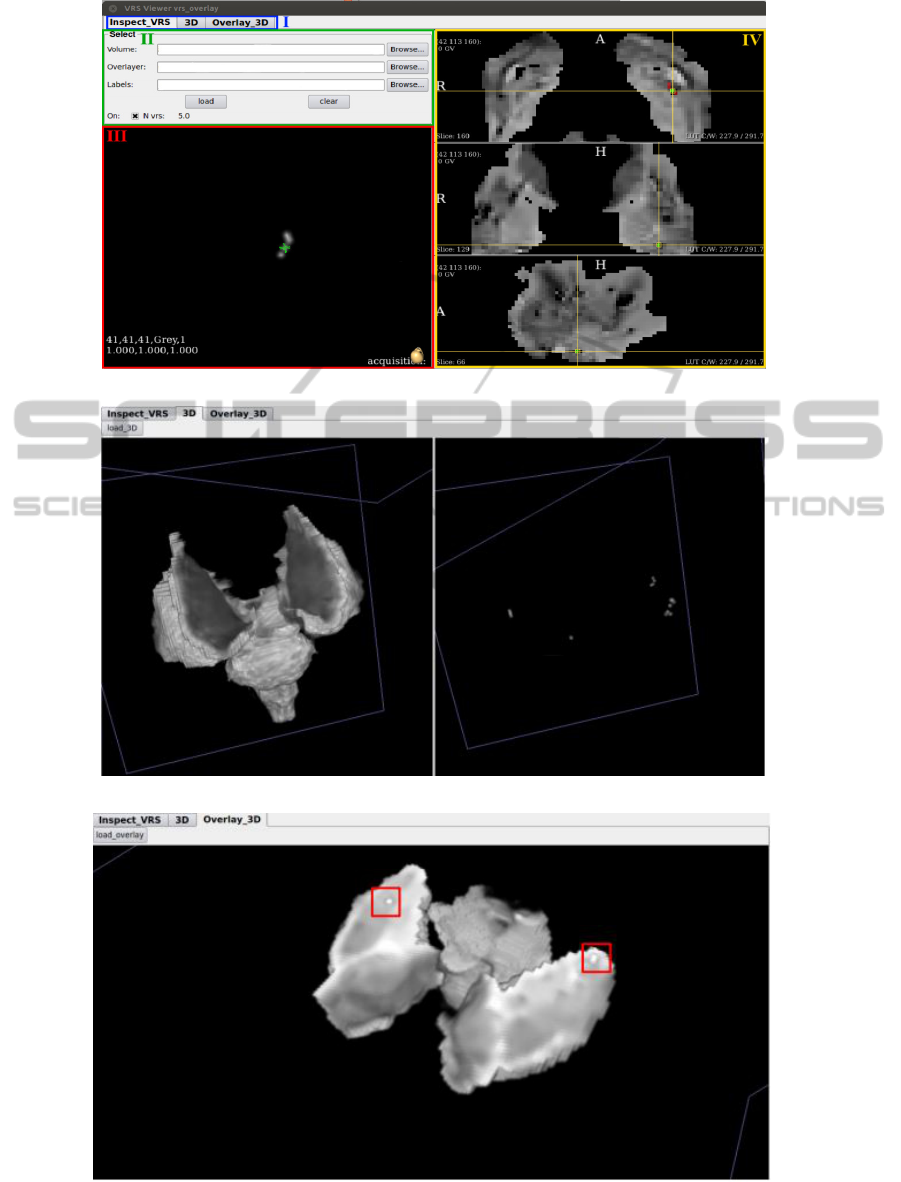
2.4 Visualization Application
In order to facilitate the observation and analysis of
the detected dilated VRS, we developed a graphical
application as presented in Figure 4. Common to all
three panels is a section that allows the user to select
the desired panel (Figure 4(a)-I). The main panel (Fig-
ure 4(a)) has a section to select the image to be loaded
and the image with detected VRS. There, it is, also,
possible to turn on or off the layer with the detected
dilated VRS and to check the counting of the detected
structures (II). In III, we present the 3D reconstruc-
tion of the selected dilated VRS in the viewers (IV)
with the image of the ROI that has the detected VRS
overlaid.
The application permits to visualize the 3D recon-
struction of the ROI, as well as the detected VRS, as
depicted in Figure 4(b) for the basal ganglia. Finally,
the ROI with the detected VRS overlaid is, also, re-
constructed (Figure 4(c)).
3 RESULTS AND DISCUSSION
The database used for the detection of dilated VRS
was acquired at the Hospital of Braga, Portugal, from
9 elderly patients, whose mean age was 69.4, that had
a clinical minor stroke within 6 months of the cere-
bral MRI acquisition and had at least one vascular
risk factor as hypertension, diabetes or high choles-
terol levels. For each of them there was available
a 3D T1-weighted MPRAGE sequence (176 sagit-
tal slices, matrix 256 X 256, 1 mm isotropic reso-
lution, TR 2730 ms, TE 3.48 ms), acquired with a
Siemens Avanto 1.5 T scanner. To segment the tissues
of our MPRAGE sequence images, we used the Ran-
dom Forest that was trained to participate in Grand
Challenge on MR Brain Image Segmentation (MR-
BrainS
1
). Although the intensity range is different,
the normalization procedure permitted to normalize
the intensities between both databases.
3.1 Tool
Figure 4 depicts the potential of the proposed tool.
With it, physicians can easily retrieve the number
of dilated VRS for each ROI, as well as inspect the
scan of the subject to confirm if it presents abnormal-
ities related to small vessel diseases, or others, which
would allow a better understanding of the correlation
between dilated VRS and those abnormalities. 3D re-
construction of the detected dilated VRS may be use-
ful to provide insight into the spatial distribution of
those structures, as well as if there exists any correla-
tion between the distribution and the diseases, while
3D reconstruction of the ROI permits to confirm if
it was well extracted. The 3D reconstruction of the
ROI, or brain, with VRS overlaid is useful to under-
stand if its propagation through the brain parenchyma
coincide with the perforating arteries.
When the FLAIR sequence is available, the
method to segment tissues is able to segment WM
lesions. This potentiality makes the tool capable to
measure its number and volume, which may be use-
ful for studies that hypothesize a correlation between
dilated VRS and WM lesions.
3.2 Detection of Dilated VRS
The first row of Figure 5(a) and Figure 5(b) show
some examples of dilated VRS detected by the al-
gorithm in the basal ganglia and cerebral WM, re-
spectively. In both cases, the examples seem to have
properties of dilated VRS, such as the low intensity,
surrounded by normal tissue, and small size. In the
second row of Figure 5(a) and Figure 5(b) is shown
the 3D reconstruction of each detected VRS, which
allows the physicians to observe the tortuosity; the
green mark is located in the voxel that was selected
1
http://mrbrains13.isi.uu.n
BIOIMAGING2015-InternationalConferenceonBioimaging
72
(a)
(b)
(c)
Figure 4: Application for the visualization of the detected VRS. In a) the image of the ROI is depicted with the detected dilated
VRS and its counting, b) shows the 3D reconstruction of the ROI and the detected VRS; while in c) the 3D reconstruction of
the VRS overlaid over the ROI is shown.
AFullyAutomaticToolforCountingVirchow-RobinSpacesinMagneticResonanceImagingforLacunarStrokeStudy
73
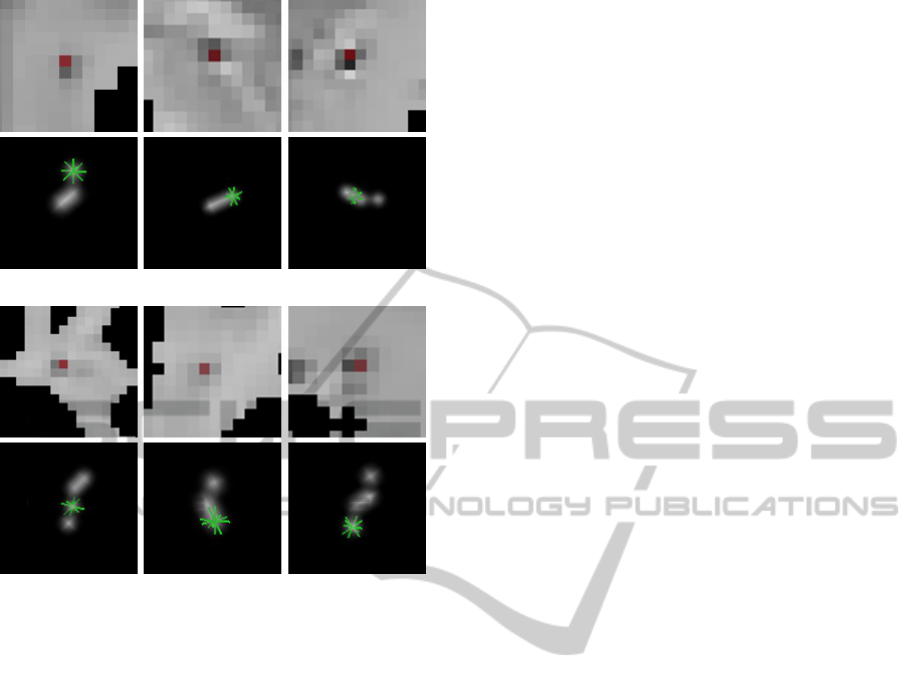
(a)
(b)
Figure 5: Examples of detected dilated VRS and their 3D
reconstruction, in a) basal ganglia and b) white matter.
in the viewer, facilitating the correspondence between
the reconstruction and the image by the user. In the
first example of Figure 5(a) the green mark is over the
first voxel of the VRS, while in the last of Figure 5(b)
is over the last voxel, but in both cases it is possible
to observe that the dilated VRS changes its direction.
4 CONCLUSIONS
In this paper, we have proposed a fully automatic tool
to facilitate the analysis and studies on the relevance
of dilated VRS as a biomarker for lacunar strokes and
its association with dementia. It comprises a set of
preprocessing procedures that improves the quality of
the image for the problem we tackled. We have pro-
posed alternative steps in an existing algorithm to de-
tect the VRS as well as an in-house tissue segmenta-
tion algorithm. These modifications improve robust-
ness of the detection of VRS in the presence of le-
sions and tissues atrophy. We believe this improve-
ment in the robustness is required for a fully auto-
matic pipeline.
A relevant feature of our tool is the possibility to
extract a ROI, and to count dilated VRS only there,
which is impractical in a large scale study using hu-
man experts, as is our goal. The visualization of the
detected VRS facilitates its analysis, being useful to
help the physician decide if a lesion is a lacunar stroke
or a VRS, when there are doubts. A tool with this fea-
tures may facilitate the standardization among studies
on dilated VRS as a global marker of cerebral vascu-
lopathy and WM lesions.
ACKNOWLEDGEMENTS
We thank Joana Festa for her collaboration in the de-
velopment of the visualization application.
REFERENCES
Descombes, X., Kruggel, F., Wollny, G., and Gertz, H. J.
(Feb. 2004). An object-based approach for detect-
ing small brain lesions: application to virchow-robin
spaces. IEEE Trans. Med. Imag., 23(2):246–255.
Doubal, F. N., MacLullich, A. M., Ferguson, K. J., Dennis,
M. S., and Wardlaw, J. M. (2010). Enlarged perivascu-
lar spaces on mri are a feature of cerebral small vessel
disease. Stroke, 41(3):450–454.
Fischl, B., Salat, D. H., Busa, E., Albert, M., Dieterich,
M., Haselgrove, C., van der Kouwe, A., Killiany, R.,
Kennedy, D., Klaveness, S., et al. (2002). Whole brain
segmentation: automated labeling of neuroanatomical
structures in the human brain. Neuron, 33(3):341–
355.
Gorgolewski, K., Burns, C. D., Madison, C., Clark, D.,
Halchenko, Y. O., Waskom, M. L., and Ghosh, S. S.
(2011). Nipype: a flexible, lightweight and extensible
neuroimaging data processing framework in python.
Front Neuroinform, 5.
Groeschel, S., Chong, W. K., Surtees, R., and Hanefeld, F.
(2006). Virchow-robin spaces on magnetic resonance
images: normative data, their dilatation, and a review
of the literature. Neuroradiology, 48(10):745–754.
Hern
´
andez, M., Piper, R. J., Wang, X., Deary, I. J., and
Wardlaw, J. M. (2013). Towards the automatic com-
putational assessment of enlarged perivascular spaces
on brain magnetic resonance images: A systematic re-
view. JMRI - J Magn Reson Im, 38(4):774–785.
Manj
´
on, J. V., Coup
´
e, P., Buades, A., Louis Collins, D., and
Robles, M. (2012). New methods for mri denoising
based on sparseness and self-similarity. Med. Image
Anal., 16(1):18–27.
Murphy, K. P. (2012). Machine learning: a probabilistic
perspective. MIT Press.
Patankar, T. F., Mitra, D., Varma, A., Snowden, J., Neary,
D., and Jackson, A. (2005). Dilatation of the virchow-
robin space is a sensitive indicator of cerebral mi-
crovascular disease: study in elderly patients with de-
mentia. AJNR Am J Neuroradiol, 26(6):1512–1520.
BIOIMAGING2015-InternationalConferenceonBioimaging
74

Pereira, S., Festa, J., Mariz, J. A., Sousa, N., and Silva,
C. A. (2013). Automatic brain tissue segmentation
of multi-sequence mr images using random decision
forests. The MIDAS Journal. In: MICCAI 2013 Work-
shops - The MICCAI Grand Challenge on MR Brain
Image Segmentation (MRBrainS13).
Ramirez, J., Gibson, E., Quddus, A., Lobaugh, N. J., Fe-
instein, A., Levine, B., Scott, C., Levy-Cooperman,
N., Gao, F., and Black, S. E. (2011). Lesion ex-
plorer: a comprehensive segmentation and parcella-
tion package to obtain regional volumetrics for sub-
cortical hyperintensities and intracranial tissue. Neu-
roimage, 54(2):963–973.
Rouhl, R., Van Oostenbrugge, R., Knottnerus, I., Staals, J.,
and Lodder, J. (2008). Virchow-robin spaces relate
to cerebral small vessel disease severity. J Neurol,
255(5):692–696.
S
´
egonne, F., Dale, A., Busa, E., Glessner, M., Salat, D.,
Hahn, H., and Fischl, B. (2004). A hybrid approach
to the skull stripping problem in mri. Neuroimage,
22(3):1060–1075.
Tustison, N. J., Avants, B. B., Cook, P. A., Zheng, Y., Egan,
A., Yushkevich, P. A., and Gee, J. C. (April 2010).
N4itk: improved n3 bias correction. IEEE Trans. Med.
Imag., 29(6):1310–1320.
Uchiyama, Y., Kunieda, T., Asano, T., Kato, H., Hara,
T., Kanematsu, M., Iwama, T., Hoshi, H., Kinosada,
Y., and Fujita, H. (2008). Computer-aided diagnosis
scheme for classification of lacunar infarcts and en-
larged virchow-robin spaces in brain mr images. In
Engineering in Medicine and Biology Society, EMBC,
2008 Annual International Conference of the IEEE,
pages 3908–3911. IEEE.
Wuerfel, J., Haertle, M., Waiczies, H., Tysiak, E., Bech-
mann, I., Wernecke, K. D., Zipp, F., and Paul, F.
(2008). Perivascular spaces - mri marker of inflamma-
tory activity in the brain? Brain, 131(9):2332–2340.
AFullyAutomaticToolforCountingVirchow-RobinSpacesinMagneticResonanceImagingforLacunarStrokeStudy
75
