
Deterministic Method for Automatic Visual Grading of Seed Food
Products
Pierre Dubosclard
1,2
, Stanislas Larnier
1,2
, Hubert Konik
3
, Ariane Herbulot
1,2
and Michel Devy
1,2
1
CNRS, LAAS, 7 Avenue du Colonel Roche, F-31400 Toulouse, France
2
Univ. de Toulouse, UPS, LAAS, F-31400 Toulouse, France
3
Laboratoire Hubert Curien, Saint-Etienne, France
Keywords:
Image processing, Image Segmentation, Shape Learning, Active Contours, Visual Grading.
Abstract:
This paper presents a deterministic method for automatic visual grading, designed to solve the industrial
problem of evaluation of seed lots. The sample is thrown in bulk onto a tray placed in a chamber for acquiring
color image. An image processing method had been developed to separate and characterize each seed. Shape
learning is performed on isolated seeds. The collected information is used for the segmentation. A first step
is made based on simple criteria such as regions, edges and normals to the boundary. Then, an active contour
with shape prior is performed to improve the results.
1 INTRODUCTION
In agriculture, the global grain harvest reached sev-
eral billion tons each year. Seed producers exchange
their crops at a price determined by the quality of their
production. This assessment, called grading, is per-
formed for each set on a representative sample. The
difficulty of this assessment is to fully characterize
the sample. To do so, it is necessary to qualify each
of its elements. Historically, this has been performed
manually by an operator. This method is exposed to
various problems and the results can vary from one
operator to another.
Alpha MOS company develops systems for quali-
ty control of food products. It proposes a visual sen-
sory system to provide an alternative to human eva-
luation. The assessment should be simple to imple-
ment and at least as fast as the human evaluation.
The seed samples are presented in bulk, without
any arrangement, but they are spread over a tray in
such way that there is no overlapping between the ob-
jects to avoid occlusion (Figure 1). The evaluation by
the instrument is composed of three steps. The first
step is the acquisition: the operator places the sam-
ples on the tray in the instrument and takes an image.
Then the detection step consists in finding each ob-
ject in the image, to finally classify them in different
quality classes regarding several criteria (shape, color,
spot) during the classification step.
The quality of the sample can then be deduced
Figure 1: Wheat seeds in bulk and acquisition system.
from the result of the classification. The detection
step is the main difficulty. It is necessary to develop
a segmentation method to isolate each object under
the following constraints: the number of seeds is un-
known (an approximate estimation can be done); the
objects have quite generical geometric and chromatic
features; they are randomly placed, without arrange-
ment and with no overlapping.
In Section 2, a state of the art around the visual
grading problem is presented. Section 3 describes the
data acquisition system. Our approach needs prior
shape information. The shape learning on binarized
images is explain in Section 4. The segmentation ap-
proach to detect the seeds is provided in Section 5.
Numerical results are presented in Section 6.
212
Dubosclard P., Larnier S., Konik H., Herbulot A. and Devy M..
Deterministic Method for Automatic Visual Grading of Seed Food Products.
DOI: 10.5220/0005188102120217
In Proceedings of the International Conference on Pattern Recognition Applications and Methods (ICPRAM-2015), pages 212-217
ISBN: 978-989-758-076-5
Copyright
c
2015 SCITEPRESS (Science and Technology Publications, Lda.)

2 STATE OF THE ART
Several studies have been conducted on the cereal
seeds grading. In (Agustin and Oh, 2008), the au-
thors focused on the quality control of grain of rice,
regarding different criteria of shape and color. From
these criteria, a classification method based on neural
network is used to qualify each grain. This approach
gives good results for the classification of complete,
broken and colors defect rice grain. However this
method is applied on images with separated grain.
The segmentation issue is then simplified by an op-
erator or a mechanical system (vibrating bowl or slot)
to separate the grain in front of the camera.
Other studies have been conducted on the cereal
segmentation topic, mainly on wheat and rice. The
researches in (Yao et al., 2010) and (Faessel and Cour-
tois, 2011) focused on detection and separation of rice
grain. They both address the problem by working on
a binary image obtained by a threshold to separate the
objects from the background. In (Yao et al., 2010), the
authors then work on the contours and search the con-
caves angles to connect them two at a time in order to
detect objects boundaries. In (Faessel and Courtois,
2011), the authors used a mathematical morphology
method on the binary image: a skeleton operation on
the background. The open lines of the skeleton, with-
out ending, are then combined under some constraints
to obtain the objects boundaries. These two meth-
ods give good results on image of touching grain with
low density of objects. The computation times are
short, but these methods are not adapted for images
with heaps and high density of seeds.
3 ACQUISITION SYSTEM
The acquisitions are made in a cabin (Figure 1) which
integrates a camera and a lighting system. This cabin
offers stable and reproducible acquisition condition,
independently from the external lighting.
Some improvements have been made on the ex-
isting system available at the industrial partner Alpha
MOS. The lighting system and the camera have been
replaced by new material. The aim was to improve
the quality and the stability of the color image acqui-
sition. The lighting source retained is composed of
white LEDs. These LEDs have a continuous spectrum
in the visible range and were chosen for their stabil-
ity over time in term of luminous intensity. As LEDs
are punctual sources, a diffuser is placed downstream
to ensure the lighting homogeneity in the acquisition
area. The image acquisition is performed at a distance
of 400 mm from the object plan by a CMOS mono
(a) Original image. (b) Binarized image.
Figure 2: Binarization with Otsu’s method.
sensor color camera of 5 megapixel with a 5 mm lens.
The chosen camera was a Basler acA2500-14gc. It
offers a resolution on the object plan around 6 pixels
per millimeter, which is important for our application
as the objects have a size of only few millimeters.
The image acquisitions presented in this paper
were obtained with this system.
4 SHAPE LEARNING
A binary image can be obtained in many classical
different ways. For example, with rice seeds which
are well contrasted with a black background, Otsu’s
method (Otsu, 1979) can be applied, see Figure 2.
A background learning without any seed then sub-
traction could also be considered. In difficult cases, it
is possible for an human operator to choose manu-
ally correct thresholds for gray level images or color
images. He could also separate some pixels in two
classes and let a k-means clustering algorithm do the
rest (MacQueen, 1967). The binarization could also
be made using the image gradient.
From a binarized image of isolated seeds, the fol-
lowing features of each seed are extracted:
Area. It is the number of pixels inside the seed.
Eccentricity. It is a scalar, between 0 and 1, which
specifies the eccentricity of the ellipse that has the
same second-moments as the region. The eccentric-
ity is the ratio of the distance between the foci of the
ellipse and its major axis length. An ellipse whose
eccentricity is 0 is actually a circle, while an ellipse
whose eccentricity is 1 is a line segment.
Major axis length. It is the distance between the end
points of the longest line that could be drawn through
the seed. The major axis endpoints are found by com-
puting the pixel distance between every combination
of border pixels in the seed boundary and finding the
pair with the maximum length.
Minor axis length. It is the distance between the end
points of the longest line that could be drawn through
the seed while maintaining perpendicularity with the
major axis.
Perimeter. It is the number of pixels of the boundary.
DeterministicMethodforAutomaticVisualGradingofSeedFoodProducts
213

θ = 0 θ = π/5 θ = 2π/5 θ = 3π/5 θ = 4π/5
Figure 3: From top to bottom, examples of E
1
, E
2
and E
3
computed with the same ellipse and five different orientations.
Roundness. It is a measure of how closely the shape
of an object approaches that of a circle. It is equalled
to 4π times the area divided by the square of the
perimeter.
In the learning process, a k-means clustering algo-
rithm on the statistics allows to separate the seeds in
three categories: broken, isolated and adjacent. The
broken or adjacent grain kernels can be present or ab-
sent. The category with the adjacent ones is not taken
into account during the learning process.
5 SEGMENTATION
5.1 Energy Maps
From the image, three kind of energy maps can be
extracted based on the matter E
1
, the gradient gap on
the boundary E
2
and the normal to the boundary E
3
.
They take their values between [0,1]. Let Ω be the
image domain, ω be the shape to test and x ∈ Ω a
location. They are defined as follows:
E
1
(ω) =
1
area(ω)
Z
ω
u
b
(x) dx
where area is a function which gives the area of the
shape, u
b
denotes the binarized image with 1 if a pixel
is belong to a seed and 0 otherwise,
E
2
(ω) =
1
max
y∈Ω
(
k
∇u(y)
k
)
1
|∂ω|
Z
∂ω
k∇u(x)k dx
where ∇u(x) denotes the image gradient, |∂ω| denotes
the length of the object boundary and
k
.
k
is the Eu-
clidean norm,
E
3
(ω) =
1
2|∂ω|
Z
∂ω
*
∇u(x)
p
|∇u(x)|
2
+ ε
2
,n(x)
+
dx +
1
2
where
h
.,.
i
denotes the Euclidean scalar product, n(x)
denotes the outward normal to ω at location x ∈ ∂ω
and ε is a regularization parameter that discard faint
transitions.
The function E
1
checks the matter quantity inside
the considered shape, but it baldly reacts inside adja-
cent seeds or bigger seed. The function E
2
reacts well
for the boundaries between the background and the
seeds, but not between two seeds. The function E
3
is
working with high and low contrasts, but it could suf-
fered from shading issues. Therefore the three ener-
gies are used together in order to avoid the disadvan-
tages and combine the advantages (see Section 5.3)
The behaviour of the three energy maps are illus-
trated in Figure 3. The ellipse had been chosen in
the case of rice seeds. Each figures present five ori-
entation maps obtained from a zoom of the input im-
age in Figure 2. These energy maps are more effi-
cient with isolated seeds and on the boundary of seed
heaps. For this reason the segmentation algorithm at-
tacks the heaps progressively from their boundaries to
their cores.
The computation of the energy maps is quite sim-
ple and fast. Firstly a filter corresponding to the oper-
ation is built. Secondly a simple convolution with the
image is performed. The speed comes from the fact
that Fourier transform of a convolution is the point-
wise product of Fourier transforms.
ICPRAM2015-InternationalConferenceonPatternRecognitionApplicationsandMethods
214
5.2 Active Contour
The used objects to create the energy maps have only
simple shapes like ellipses with a limited range of
axes sizes. The computational time is the main rea-
son. But to accurately detect every object in the im-
age, we need to obtain the most precise boundaries.
As the objects to detect have a generical shape, we
decided to use the method based on an active contour
with a geometric shape prior proposed in (Bresson
et al., 2006). This method follows the well-known en-
ergy functional model presented in (Chen et al., 2002)
where the shape prior given in (Leventon et al., 2000)
is integrated. Finally, to improve the robustness of
the method, Bresson et al. add a region-based energy
term based on the Mumford-Shah functional (Chan
and Vese, 2001). This method is then based on three
complementary terms dedicated to shape, boundary
and region inside the contour.
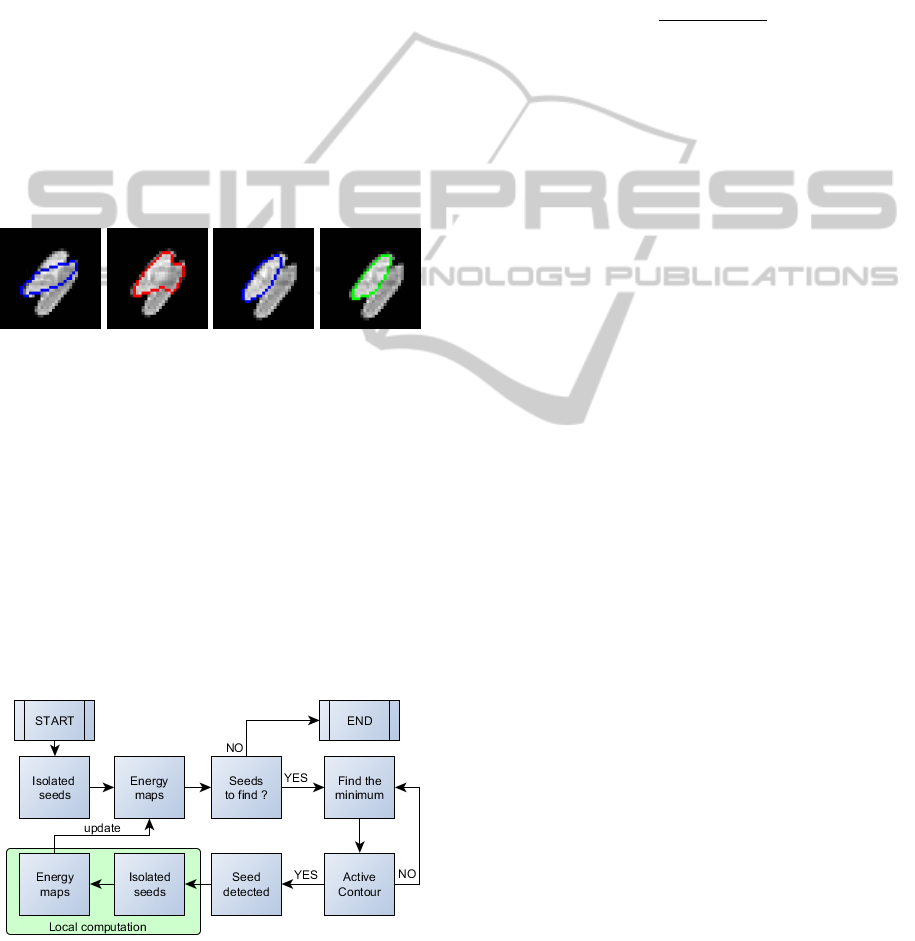
(a) Bad start. (b) Rejection. (c) Good start. (d) Acceptance.
Figure 4: Behaviour of active contour.
The starting contour is the ellipse that minimizes
the previous energy maps, see the next section for
more details. Figure 4 illustrates the behavior of the
active contour in the cases of bad starting contour (a)
and a good one (c). The starting contours are repre-
sented in blue. The first leads to a final contour in red
with a shape distant from an ellipse and is rejected.
The second leads to a final contour in green with a
shape similar to an ellipse and is accepted.
5.3 Algorithm
Figure 5: Scheme of the algorithm.
From a binary image, the proposed deterministic
algorithm detects the isolated seed, by comparing the
shape of each connex set to known criteria. For ex-
ample on rice seeds, the area, the perimeter and the
roundness are compared to the results of shape learn-
ing. If they match, the connex set is considered as a
seed and is not anymore used in the process.
In this paper, the studied seeds are well approx-
imated with ellipses. The algorithm compute three
energy maps with a range of parameters: θ the orien-
tation, a the major axis length and b the minor length
axis. It sorts the values of the following function:
E =
q
E
2
1
+ E
2
2
+ E
2
3
into a vector φ. At the minimum, the active contour
step is launched. If its result is rejected, the algorithm
looks for the next value in φ until it accepts the de-
tection and considers that it detects a seed. When a
seed is detected, a black shape replaced it in the im-
age. The algorithm checks the connex sets in the local
zone. If there are considered as a seed and there are
not anymore used in the process. Then local energy
maps are computed in the neighborhood in order to
update the energy maps and update φ. The process is
iterated until there are no more pixels considered as
belonging to a seed or if the algorithm is unable to
explain the final connex sets with seeds.
6 NUMERICAL RESULTS
6.1 Numerical Results on Shape
Learning
Figure 6 presents some seeds. From left to right, there
are rice, pea, barley and wheat. The images are seg-
mented and statistics on the features of isolated seeds
are computed. Table 1 presents these statistics which
will be helpful for the parameter selection in the pro-
posed segmentation algorithm.
6.2 Numerical Results on Segmentation
Figures 7, 8, 9 and 10 present the segmentation re-
sults of the proposed algorithm with different kinds
of seeds. Figures 7 and 8 are both on rice seeds but
the second one has a higher density. Results on pea
and barley seeds are presented in respectively Figures
9 and 10. Thanks to the results from Table 1, the cho-
sen shape parameters generate circular to elongated
ellipses. For example, pea seeds are approximated by
ellipses, more circular than the two others.
Most of the seeds are well segmented. The best
result is obtained with the pea seeds because there is
DeterministicMethodforAutomaticVisualGradingofSeedFoodProducts
215
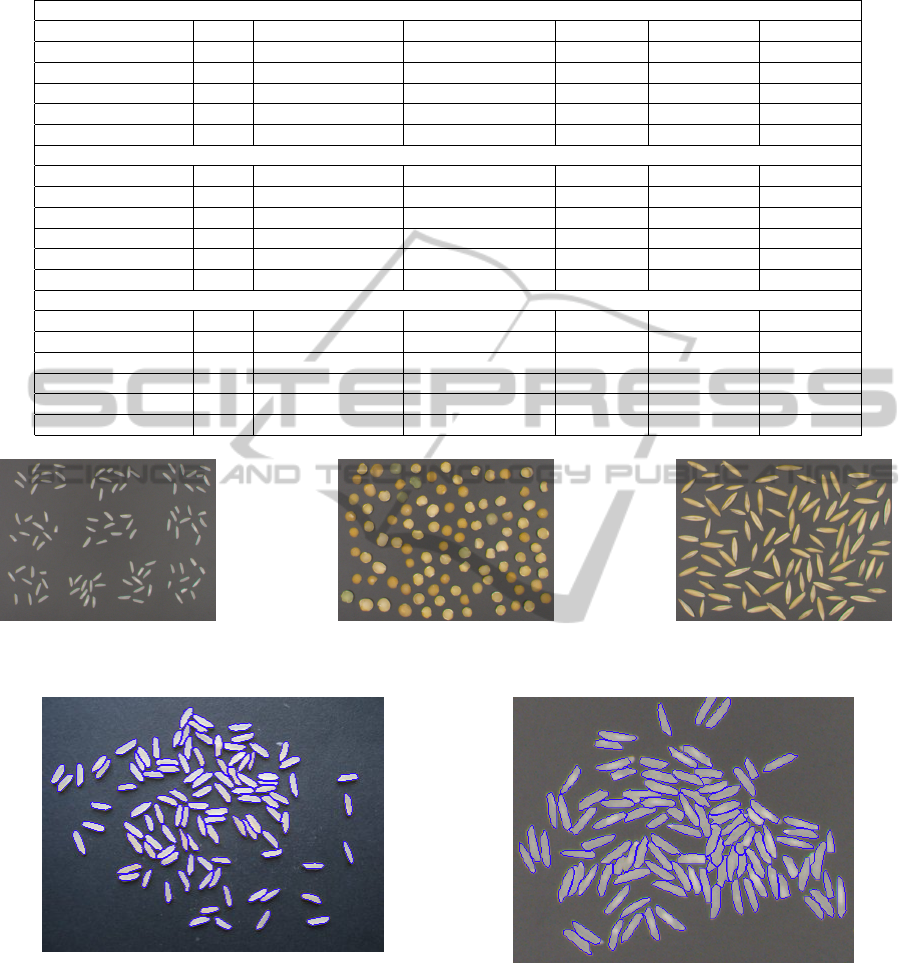
Table 1: Results from shape learning with isolated seeds based on the images presented in Figure 6.
Rice seeds, Figure 6 (a)
Features Area Major axis length Minor axis length Perimeter Eccentricity Roundness
Minimum 218 23 10 61 0.804 0.470
Maximum 559 51 15 114 0.972 0.840
Mean 422 43 13 96 0.950 0.576
Median 430 44 13 98 0.957 0.560
Standard deviation 64 6 1 10 0.026 0.067
Pea seeds, Figure 6 (b)
Features Area Major axis length Minor axis length Perimeter Eccentricity Roundness
Minimum 894 35 29 115 0.208 0.601
Maximum 2061 55 48 176 0.738 0.927
Mean 1322 43 39 140 0.427 0.845
Median 1283 43 39 138 0.434 0.850
Standard deviation 233 4 3 12 0.108 0.045
Barley seeds, Figure 6 (c)
Features Area Major axis length Minor axis length Perimeter Eccentricity Roundness
Minimum 842 61 16 149 0.952 0.309
Maximum 1812 101 24 253 0.979 0.528
Mean 1312 82 20 192 0.968 0.442
Median 1377 82 21 191 0.968 0.448
Standard deviation 266 11 2 25 0.006 0.045
(a) Rice seeds (b) Pea seeds (c) Barley seeds
Figure 6: Isolated seeds used for shape learning.
Figure 7: First segmentation result with rice seeds.
less contact between the seeds. The use of superel-
lipses, also known as Lam
´
e curves, could improve the
barley seeds which are more pointed.
7 CONCLUSION
This paper proposes a deterministic approach to per-
form the visual quality control of cereal seeds sam-
Figure 8: Second segmentation result with rice seeds.
ples. This operation called visual grading can be
treated in three steps: acquisition, segmentation and
classification. An acquisition system of color images
has been created to collect the data. A new segmen-
tation approach has been developed. The proposed
method has two steps. The first one uses the region,
the edges and the normals to the boundary. In order
to be accurate and avoid human parameter configura-
tion, it is necessary to learn shape information on iso-
ICPRAM2015-InternationalConferenceonPatternRecognitionApplicationsandMethods
216
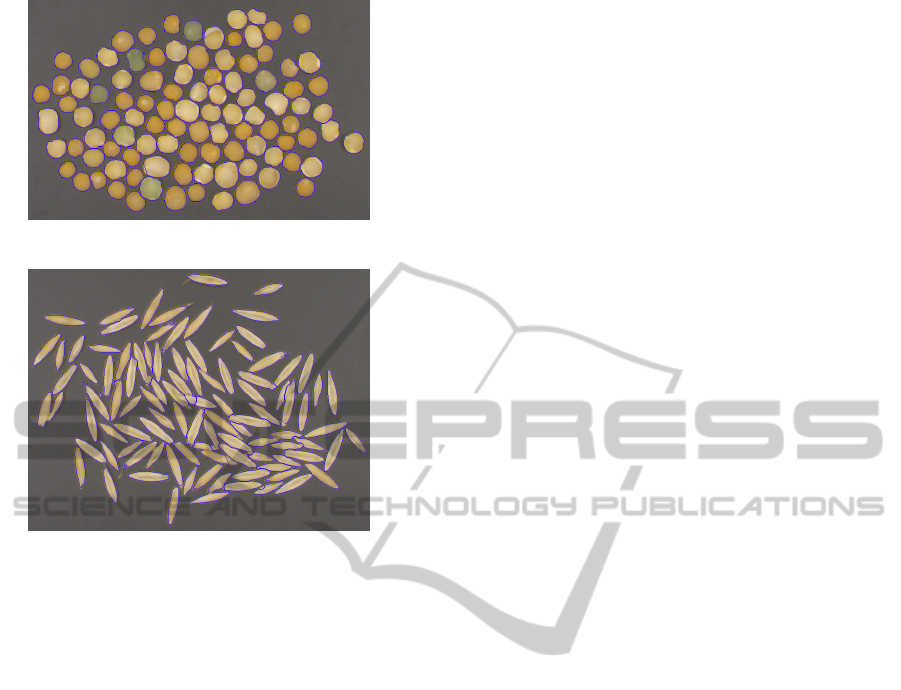
Figure 9: Segmentation result with pea seeds.
Figure 10: Segmentation result with barley seeds.
lated seeds. The second step is based on active con-
tours. The preliminary results on rice, pea and barley
seeds are promising.
Experiments with higher density and with other
type of seeds or objects are in progress. So far, only
ellipses have been used for the shape, in order to be
more accurate, superellipses and ovals will also be
considered. Other tests like comparison with human
operator and reproducibility on the same sample in
different configurations are also underway. Our ap-
proach is deterministic, in parallel, we are building a
probabilistic one (Dubosclard et al., 2014) based on
marked point processes (Descombes et al., 2009) and
the same step of active contour with shape prior. A
comparative study between the two approaches is in
progress. The integration of a 3D data acquisition sys-
tem like stereovision with two cameras is under inves-
tigation. Despite the hardware cost, such data might
be useful in particular to enrich the birth map but also
to provide criteria for the classification stage.
ACKNOWLEDGEMENT
This CIFRE thesis work was made possible thanks to
the involment of Alpha MOS company.
REFERENCES
Agustin, O. and Oh, B.-J. (2008). Automatic milled rice
quality analysis. In Second International Conference
on Future Generation Communication and Network-
ing, 2008. FGCN ’08, volume 2, pages 112–115.
Bresson, X., Vandergheynst, P., and Thiran, J.-P. (2006).
A variational model for object segmentation using
boundary information and shape prior driven by the
mumford-shah functional. International Journal of
Computer Vision, 68(2):145–162.
Chan, T. and Vese, L. (2001). Active contours with-
out edges. IEEE Transactions on Image Processing,
10(2):266–277.
Chen, Y., Tagare, H., Thiruvenkadam, S., Huang, F., Wil-
son, D., Gopinath, K., Briggs, R., and Geiser, E.
(2002). Using prior shapes in geometric active con-
tours in a variational framework. International Jour-
nal of Computer Vision, 50(3):315–328.
Descombes, X., Minlos, R., and Zhizhina, E. (2009). Object
extraction using a stochastic birth-and-death dynamics
in continuum. Journal of Mathematical Imaging and
Vision, 33:136–139.
Dubosclard, P., Larnier, S., Konik, H., Herbulot, A., and
Devy, M. (2014). Automatic method for visual grad-
ing of seed food products. In International Confer-
ence on Image Analysis and Recognition (ICIAR), vol-
ume 1 of Lecture Notes in Computer Science, pages
485–495.
Faessel, M. and Courtois, F. (2011). Touching grain kernels
separation by gap-filling. Image Analysis and Stereol-
ogy, 28(3):195–203.
Leventon, M., Grimson, W. E. L., and Faugeras, O. (2000).
Statistical shape influence in geodesic active contours.
In IEEE Conference on Computer Vision and Pattern
Recognition, 2000, volume 1, pages 316–323.
MacQueen, J. B. (1967). Some methods for classification
and analysis of multivariate observations. In Cam, L.
M. L. and Neyman, J., editors, Proc. of the fifth Berke-
ley Symposium on Mathematical Statistics and Prob-
ability, volume 1, pages 281–297. University of Cali-
fornia Press.
Otsu, N. (1979). A threshold selection method from gray-
level histograms. IEEE Transactions on Systems, Man
and Cybernetics, 9(1):62–66.
Yao, Q., Zhou, Y., and Wang, J. (2010). An automatic seg-
mentation algorithm for touching rice grains images.
In International Conference on Audio Language and
Image Processing (ICALIP), pages 802–805.
DeterministicMethodforAutomaticVisualGradingofSeedFoodProducts
217
