
Automated Respiration Detection from Neonatal Video Data
Ninah Koolen
1,2
, Olivier Decroupet
1
, Anneleen Dereymaeker
3
, Katrien Jansen
3
, Jan Vervisch
3
,
Vladimir Matic
1,2
, Bart Vanrumste
1,2,4
, Gunnar Naulaers
3
, Sabine Van Huffel
1,2
and Maarten De Vos
5,6
1
Department of Electrical Engineering (ESAT), division STADIUS, University of Leuven, Leuven, Belgium
2
iMinds-KU Leuven Medical IT Department, Leuven, Belgium
3
Department of Development and Regeneration, University of Leuven, Leuven, Belgium
4
Faculty of Engineering Technology, AdvISe Technology Lab, University of Leuven campus Geel, Geel, Belgium
5
Department of Psychology, University of Oldenburg, Oldenburg, Germany
6
Institute of Biomedical Engineering, Department of Engineering Science, University of Oxford, Oxford, U.K.
Keywords: Automated Respiration Detection, Neonatal Care, Polysomnography, Video, Optical Flow Algorithm,
Eulerian Video Magnification.
Abstract: In the interest of the neonatal comfort, the need for noncontact respiration monitoring increases. Moreover,
home respiration monitoring would be beneficial. Therefore, the goal is to extract the respiration rate from
video data included in a polysomnography. The presented method first uses Eulerian video magnification to
amplify the respiration movements. A respiration signal is obtained through the optical flow algorithm.
Independent component analysis and principal component analysis are applied to improve the signal quality,
with minor enhancement of the signal quality. The respiratory rate is extracted as the dominant frequency in
the spectrograms obtained using the short-time Fourier transform. Respiratory rate detection is successful
(94.12%) for most patients during quiet sleep stages. Real-time monitoring could possibly be achieved by
lowering the spatial and temporal resolutions of the input video data. The outline for successful video-aided
detection of the respiration pattern is shown, thereby paving the way for improvement of the overall
assessment in the NICU and application in a home-friendly environment.
1 INTRODUCTION
In neonatal care, respiration monitoring is of viable
importance. Monitoring the respiration rate
facilitates the diagnosis of a number of disorders,
like apnea. Neonates normally show respiratory rates
around 50-60 breaths per minute. The respiration
pattern of the infant changes based on the
development of the respiratory system and possible
disorders. Three general respiration patterns are
observed in neonates: synchronous, simple retraction
and see-saw (Miller and Behrle, 1953). They define
the phase difference between the chest and the
abdomen expansion during breathing. The incidence
of these respiratory patterns varies with the age of
the neonate. The respiratory system of preterm
infants is not fully developed yet; they are therefore
more susceptible to show apnea or periodic
respiration. Apnea is defined by the cessation of the
respiratory airflow, whereas periodic breathing is
characterized by groups of respiratory movements
interrupted by small intervals of apnea.
Nowadays, most techniques used to monitor the
respiration are complex and obtrusive, like
polysomnography. Multiple methods to monitor the
respiration rate without using a polysomnography
have been developed (Al-Khalidi et al., 2011). Most
recently, numerous techniques aiming for a
contactless respiration monitoring have been
investigated. A lot of these attempts involve sensors
integrated under or into the mattress (Folke et al.,
2003). Methods based on acoustic and radar
detection exist as well, using the Doppler principle
to estimate motions induced by the respiration (Li et
al., 2013). Similar techniques use time-of-flight
cameras to estimate the frequency of the chest
movements during respiration (Penne et al., 2008).
Some attempts at visual detection make use of
infrared camera to detect motions in the scene
(Abbas and Heiman, 2009). The infrared cameras
164
Koolen N., Decroupet O., Dereymaeker A., Jansen K., Vervisch J., Matic V., Vanrumste B., Naulaers G., Van Huffel S. and De Vos M..
Automated Respiration Detection from Neonatal Video Data.
DOI: 10.5220/0005187901640169
In Proceedings of the International Conference on Pattern Recognition Applications and Methods (ICPRAM-2015), pages 164-169
ISBN: 978-989-758-077-2
Copyright
c
2015 SCITEPRESS (Science and Technology Publications, Lda.)

estimate the skin temperature of the patient which
can be related to inspiration and expiration of air
during breathing.
Other methods focus on processing images
obtained from regular cameras. Differences between
frames are used to estimate movements in the video
data (Tan et al., 2010). Based on the same principle,
the optical flow algorithm can be applied to an
image sequence (Nakjima, 2001). These techniques
are however developed for older subjects and do not
mention successful respiration detection during sleep
in a dark setting. The same problem is present with
techniques based on the detection of colour changes
(Kwon et al., 2012; Aarts et al., 2013). These can
provide a very accurate detection of the respiration
and the heart rate but they rely on a good
illumination of the face of the patient which is
unrealistic for sleep monitoring.
Most of these techniques require the use of
sophisticated devices, which can be expensive and
difficult to set up in a home environment. This paper
presents an algorithm to automatically extract the
neonatal respiratory rate from video data during
deep sleep stages. The required equipment consists
of a simple camera and a computer. Breathing
movements are magnified in the specific frequency
band using Eulerian video magnification, and further
processed with the optical flow algorithm to extract
a respiration signal. In addition, with ICA and PCA
we have aimed to optimize the respiration detection.
Using Short-Time Fourier Transformation, a
respiration rate is extracted and compared to the
control signal by means of cross-correlation.
2 METHODS
2.1 Data Acquisition
Two types of data are acquired for this study. Both
video and the respiration signals are obtained during
a polysomnography. The dataset included long-term
video-EEG recordings of 7 preterm infants with a
postmenstrual age of 33-40 weeks. Two patients
were labelled with periodic breathing based on
visually detection of at most 10 seconds non-
breathing intervals. The protocol was approved by
the ethics committee of the University Hospitals of
Leuven, Belgium. The respiratory effort is measured
using two bands, one placed around the thorax of the
patient, the other around the abdomen. Each band
contains a piezoelectric transducer measuring its
extension as the patient breathes in and out. The
video data is acquired with a simple camera placed
above or near the bed of the baby in different set-
ups. All videos are recorded in .wmv format and
have the same size: 720x576 pixels. The video
images are converted to the .avi format, which
works with a constant frame rate. RGB values are
changed into gray values. As the objective is to
detect respiration from these videos, the region of
interest is limited to the body of the baby. All video
images are manually cropped to contain only the
chest and abdomen region as indicated in Figure 1.
This operation has two advantages: a lowering of the
noise levels and a reduction of the computation time.
Figure 1: Screenshot of the video image in a dark setting.
Region of interest (ROI) is manually selected.
2.2 Data Processing
The recorded video data is processed in multiple
steps. First, specific motions in the video are
amplified using Eulerian video magnification. The
movements are then extracted from the video data
with an optical flow algorithm. The output from the
optical flow is subsequently adapted in order to
obtain a signal of which the quality can be assessed
in comparison with the control signals.
2.2.1 Eulerian Video Magnification
Small, sometimes even imperceptible, variations in
video images can be amplified to make them visible
to the human eye (Wu et al., 2012). Eulerian video
magnification amplifies colour changes and small
motions in a specified frequency band. The
magnification is performed in an Eulerian way.
Namely, the algorithm tracks and amplifies changes
in pixel intensity values over time. A constant
illumination of the scene is therefore necessary.
The framework of video magnification contains
both spatial and temporal processing steps. The first
one is the spatial decomposition of the video. This
creates an image pyramid for each frame, each level
of this so-called pyramid contains a specific band of
spatial frequencies (Choi et al., 2008). Temporal
processing is applied on each spatial band. A
bandpass filter is used to extract the temporal
ROI
Automated Respiration Detection from Neonatal Video Data
165

frequency band of interest [0.5-2 Hz], which is
multiplied by the magnification factor α[=15] and
added back to the original signal. The value of α
cannot be taken too high, since the noise level will
be significantly increased in this way. We describe
the principles of motion magnification using a one-
dimensional signal. The intensity variation is defined
at a certain position x over time as I(x,t). A direct
generalization to two dimensions is possible. Under
condition of translational motion, a displacement
function d(t) can be used to represent the change in
intensity values (formula 1). Magnification to
enlarge the respiration is represented in formula 2.
Finally, the spatial pyramid is collapsed to create the
output video data.
with
(1)
(2)
2.2.2 Optical Flow
Optical flow is the distribution of apparent velocities
of movement patterns in the image, arising from the
relative motion between the viewer and the objects
(Horn and Schunck, 1981). Multiple approaches
exist to relate motion in the images by calculating
the optical flow (Fleet and Weiss, 2006; O’Donovan,
2005). The optical flow is estimated using the partial
derivatives I
x
, I
y
and I
t
which represent the difference
in brightness between two images. For this purpose,
the sum of the Laplacians of the flow velocities
and, respectively in horizontal and vertical
direction, are approximated. These estimates are
used to set up the total error function due to
assumptions of smoothness and constant brightness.
This total error has to be minimized in order to find
suitable values for the optical flow velocity .
The optimization gives two equations in u and v
from which the flow velocity can be computed using
the local average velocities and (formula 3 and
4).
is the weighing factor between the two
assumption errors. This optimization is often
computed iteratively (Horn and Schunck, 1981).
(3)
(4)
A one dimensional respiration signal is retrieved by
summing all flow values frame by frame. Each
sample represents the total amount of horizontal or
vertical flow in the corresponding frame (Sun et al.,
2008). In addition, we have compared the obtained
signal with the signal obtained by taking only a
percentage of the horizontal and vertical optical flow
values, e.g. summing only the smallest 50% of the
absolute flow values. In case the thorax and the
abdomen do not expand simultaneously, a selection
of the smallest flow values removes the largest
expansion and the largest noise components. Figure
2 shows this signal and its control signal (abdomen
strain) for patient 7.
Figure 2: Sum of the 50% smallest vertical optical flow
values and abdomen control signal for patient 7.
2.3 Signal Analysis
The frequency content of the signals, obtained by
summing the optical flow values of each frame, is
analysed with the short-time Fourier transform
(STFT). These signals can have a low signal-to-
noise ratio, making respiration detection difficult.
Independent component analysis (ICA) and principal
component analysis (PCA) are performed to
improve the signal quality.
2.3.1 Short-Time Fourier Transform
The STFT results in a two-dimensional array
representing the frequency components in function
of time. The respiratory rate can be extracted from
the spectrogram taking the mean of the dominant
frequencies in a sliding window of 5, 10 or 20
seconds. A shorter window allows following the
variations of the respiration rate more precisely.
However, a longer window is preferable when
dealing with a signal of lower quality where the
respiration rate is not continuously dominant in the
frequency spectrum. Furthermore, longer windows
are less sensitive to artefacts. Figure 3 shows a
spectrogram obtained by the STFT of a four minutes
segment for patient 7.
Figure 3: STFT of the sum of the 50% smallest vertical
optical flow values for patient 7.
2.3.2 Independent Component Analysis
ICA is a widely used method to perform blind
source separation. ICA can be used to separate the
56 57 58 59 60 61 62 63 64 65
Time (s)
Comparison of the control signal with the extracted signal
Abdomen strain (control signal)
Extracted signal
Time (s)
Freq (Hz)
STFT spectrum of the extracted signal
20 40 60 80 100 120 140 160 180 200
0
2
4
6
ICPRAM 2015 - International Conference on Pattern Recognition Applications and Methods
166
respiration pattern from other movement sources or
noise in the video images by searching for a set of
statistically independent signals among the signal
mixtures. The video images are separated into four
equal parts and on each part the respiration
extraction methods are applied. In this way, we
obtain four signal mixtures which will serve as input
for ICA.
2.3.3 Principal Component Analysis
PCA is used to extract the most important modes of
variation from complex datasets. A signal with a
higher signal-to-noise ratio should be reconstructed
using only the most important modes of variation of
the signal, leaving out the less significant ones. The
components with the largest eigenvalues accounting
for 98% of the variance are used to reconstruct the
signal.
2.3.4 Cross-correlation
The cross-correlation computes the correlation for
every time-lag between the extracted respiration
signal and the control signal, sliding one signal
along the other. The correlation value retained here
is the maximal correlation in an interval of 1 second
around the zero time-lag. This allows to compensate
for a possibly small time-lag between the two
signals, e.g. between the thorax control signal and
the abdomen expansion picked up in the video
image. The correlation value computed in this way is
an indicator of the similarity between the control
respiration signals and the extracted signal of the
video image. The respiration estimate is however
sensitive to noise and artefacts, leading to low
correlation values given motion artefacts are present.
3 RESULTS AND DISCUSSION
Table 1 shows the correlation between each signal
obtained from the optical flow algorithm, ICA or
PCA and the corresponding control signal. For each
patient, the vertical or horizontal optical flow values
are used based on the position of the camera. A
percentage of optical flow values is taken as well in
the comparison. The effect of this selection is rather
small, but generally leads to better results in spite of
simultaneous expansions of thorax and abdomen.
The 50% flow values in smallest absolute value are
selected to serve as an input for both ICA and PCA.
Only the ICA and PCA signals for patient 7 give
really high correlation values for patients without
periodic respiration. This can be explained by the
very regular respiration rate and the lack of
movement artefacts for this patient. Both patients
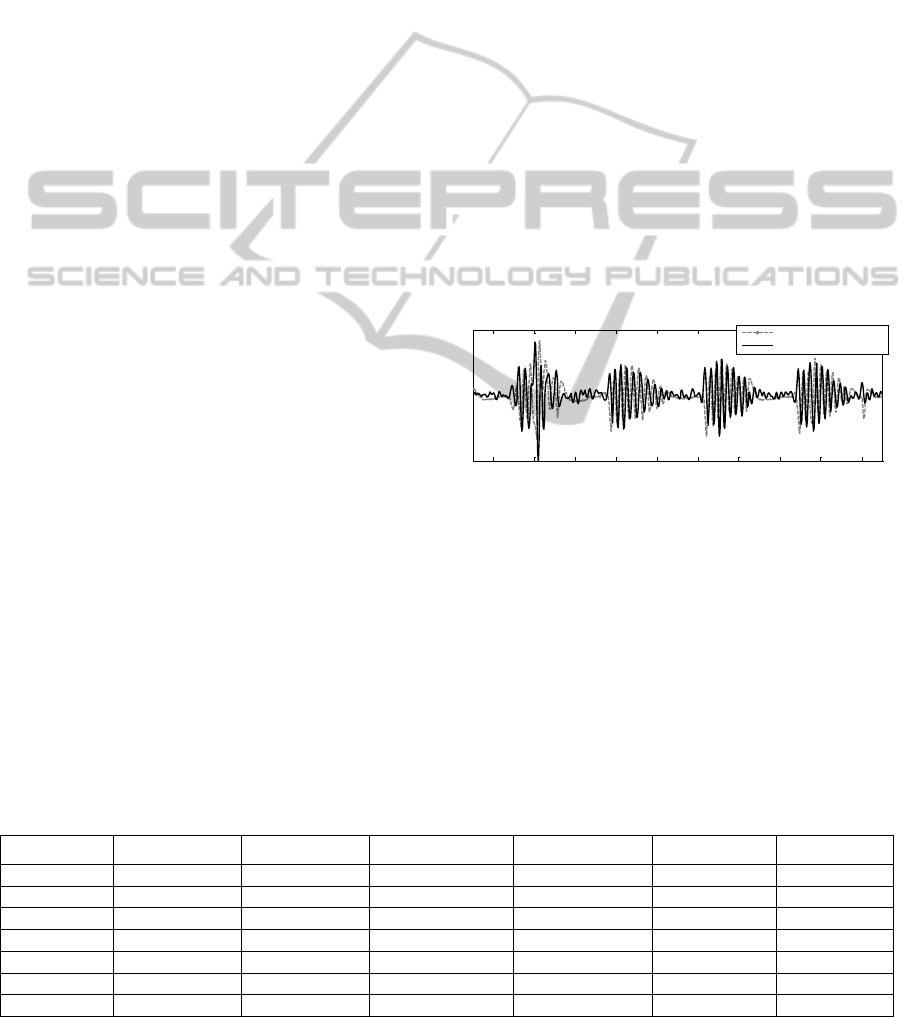
with periodic respiration (patients 3 and 4) show
larger correlation values than the other patients. This
is due to the numerous periods of apnea where no
motion is detected. As the extracted and control
signal have very small values during the apnea
periods, the correlation is high (figure 4). On the
contrary, the correlation between bursting
respiration periods is of a smaller order and
comparable to other patients.
Figure 4: Periodic breathing: comparison between the
abdomen control signal and the sum of 50% smallest
optical flow values.
Reconstruction of the signal with principal
component analysis provides the best result in five
out of seven cases. For the two other patients, the
best signal is obtained through independent
component analysis. However, the difference in
correlation between the ICA and PCA signals are
Table 1: Correlation between the control signal and the signals obtained from the optical flow, independent component
analysis and principal component analysis. Best results in bold.
100% vertical
50% vertical
100% horizontal
50% horizontal
ICA
PCA
Patient 1
0.031
0.035
0.081
0.076
0.065
0.061
Patient 2
0.069
0.074
0.119
0.129
0.144
0.167
Patient 3
0.408
0.419
0.516
0.535
0.155
0.532
Patient 4
0.502
0.493
0.114
0.122
0.463
0.495
Patient 5
0.042
0.047
0.042
0.035
0.051
0.059
Patient 6
0.152
0.143
0.087
0.072
0.122
0.161
Patient 7
0.128
0.142
0.058
0.066
0.705
0.645
50 55 60 65 70 75 80 85 90 95
Time (s)
Periodic breathing
Abdomen control signal
Extracted signal
Automated Respiration Detection from Neonatal Video Data
167

Table 2: Correlation between respiratory rate extracted from the control signal and the signal obtained by the optical flow
algorithm and after applying ICA and PCA. PR indicates periodic respiration.
Respiration rate from sum
of optical flow values
Respiration rate from ICA
estimate
Respiration rate from PCA
reconstruction
Patient 1
0.909
0.893
0.907
Patient 2
0.949
0.929
0.955
Patient 3
PR
PR
PR
Patient 4
PR
PR
PR
Patient 5
0.913
0.875
0.903
Patient 6
0.942
0.943
0.933
Patient 7
0.993
0.999
0.998
small for both patients, assuming a preference to use
PCA.
Table 2 shows the correlation between the
respiratory rates extracted by STFT from the control
signal and the signals used for table 1. For each
patient, the signal with the highest correlation to the
control signal is used, as well as the best estimates
obtained using ICA and PCA. The extracted
respiration rate is quantized in intervals of 0.1 Hz,
since an exact value of the respiratory rate is not
needed. Conversely, abrupt changes in the
respiration rate are more important to detect. The
maximal error introduced by this step is 0.05 Hz,
which is insignificant. Physical respiration changes
will still be apparent in the quantized respiratory
rate. The upside of the quantization is an easier
comparison between the rate extracted from both
signals and a higher similarity value assuming a
small difference between the rates. Both patient 3
and patient 4 have a periodic respiration pattern
(PR). This makes an estimation of the breathing rate
impossible because of the apnea periods interrupting
the respiration.
Correlation values for the respiration rate are in a
higher order than for the mutual comparison of the
signals themselves due to the selected frequency
band in the STFT and the quantization of the
respiratory rate.
4 CONCLUSIONS
Using Eulerian video magnification and an optical
flow algorithm, we are capable to detect the
respiratory rate of newborn infants from video data.
Moreover, the breathing frequency can be found by
computing the STFT on the extracted signal. The
developed method is a first step to detect apnea
intervals and periodic breathing during sleep, only
based on a simple video registration. Provided the
video is not suffering from too many non-respiration
related movements, apnea can be detected by the
absence of any movement with simple thresholding.
The same principle can be used to identify periodic
respiration.
However, the computation time to extract a
respiration signal is rather high, due to the optical
flow algorithm. The computation time can already
be significantly reduced by lowering the resolution
of the image. The results of the respiration detection
are not significantly affected by half the resolution.
A reduction of the number of frames per seconds of
the input video is another way to decrease the
computation time. The respiration rate of newborns
is almost never above 1 Hz. Therefore, it should be
possible to extract the respiration from the video
recordings while lowering the number of frames per
second under the 12.5 used here. Combining these
two modifications could lead to a significant
reduction of the computation time.
The position of the camera relative close to the
infant and its bed has to be standardized. For
example, a good suggestion would be to place it near
the feet on the bed while looking down on the infant
at an angle of approximately 45 degrees. In that way,
only vertical optical flow values should be taken into
account. There would be no or only a small
projection on the horizontal axis. Consequently,
optimization of the other steps would be possible
taking the camera position into account. In addition,
the chest and abdomen region of the infant should be
visible for the camera. Respiration detection is
possible when a thin blanket covers the baby, but not
when its body is made completely invisible by a
thick blanket.
Nevertheless, the method for respiration
detection introduced in this text has a number of
advantages on the other techniques used for
respiration monitoring of neonates. First, it does not
require any piece of equipment to be in contact with
the infant. This increases the comfort level of the
baby in addition to avoidance of skin irritation and
other reactions to the equipment in contact with the
patient. The other advantage is the simplicity of the
ICPRAM 2015 - International Conference on Pattern Recognition Applications and Methods
168

required equipment. The video images used here are
standard resolution images captured by a normal
camera. The processing only requires a computer.
This combination is less expensive than some of the
other devices used to monitor the respiration rate
from a distance. This simple equipment is also easy
to use and could be used in a home environment as
well. Home monitoring is more comfortable for the
patient and its parents, but it is also less expensive
and allows the hospital to take care of another
patient instead of the one being monitored at home.
In conclusion, this setup is a first step improving the
neonatal assessment regarding the vital sign of
respiration.
ACKNOWLEDGEMENTS
Research supported by:
Research Council KUL: GOA/10/09 MaNet, CoE
PFV/10/002 (OPTEC); PhD/Postdoc grants;
Flemish Government: IWT: projects: TBM 110697-
NeoGuard; PhD/Postdoc grants;
Belgian Federal Science Policy Office: IUAP P7/19/
(DYSCO)
EU: ERC Advanced Grant: BIOTENSORS (n°
339804).
REFERENCES
Aarts, L. A., Jeanne, V., Cleary, J. P., Lieber, C., Nelson,
J.S., Bambang Oetomo, S., Verkruysse, W., 2013.
Non-contact heart rate monitoring utilizing camera
photoplethysmography in the neonatal intensive care
unit - a pilot study. In Early Human Development,
89(12): p. 943-948.
Abbas, A. and Heiman, K., 2009. Non-contact respiratory.
monitoring based on real-time IR-thermography. In
IFMBE Proceedings, 25(4): p. 1306–1309.
Al-Khalidi, F.Q., Saatchi, R., Burke, D., Elphick, H., and.
Tan, S., 2011. Respiration rate monitoring methods: a
review. In Pediatric pulmonology, 46(6): p. 523–529.
Choi, J., Jeon,W. J., and Lee, S-C., 2008. Spatio-temporal
pyramid matching for sports videos. In Proceeding of
the first ACM international conference on Multimedia
information retrieval. New York, USA: p. 291–297.
Fleet, D. and Weiss, Y., 2006. Optical flow estimation. In
Handbook of Mathematical Models in Computer
Vision: p. 239–258.
Folke, M., Cernerud, L., Ekström, M., and Hök, B., 2003.
Critical review of non-invasive respiratory monitoring
in medical care. In Medical & biological engineering
& computing, 41(4): p. 377–383.
Horn, B. K. and Schunck, B. G., 1981. Determining
optical flow. In Artificial Intelligence, 17(1-3): p. 185–
203.
Kwon, S., Kim, H., and Park, K. S., 2012. Validation of
heart rate extraction using video imaging on a builtin
camera system of a smartphone. In Proceedings of the
Annual International Conference of the IEEE
Engineering in Medicine and Biology Society, EMBS.
San Diego, USA: p. 2174–2177.
Li, C., Lubecke, V., Boric-Lubecke, O., and Lin, J., 2013.
A review on recent advances in Doppler radar sensors
for noncontact healthcare monitoring. In IEEE
Transactions on microwave theory and techniques,
61(5): p. 2046–2060.
Miller, H. and Behrle, F., 1953. Changing patterns of
respiration in newborn infants. In Pediatrics, 12(2): p.
141–150.
Nakjima, K., 2001. Development of real-time image
sequence analysis for evaluating posture change and
respiratory rate of a subject in bed. In Physiological
Measurement, 22(3): p. 21–28.
O’Donovan, P., 2005. Optical Flow: Techniques and
Applications. In International Journal of Computer
Vision, p. 1–26.
Penne, J., Schaller, C., Hornegger, J., and Kuwert, T.,
2008. Robust real-time 3D respiratory motion
detection using time-of-flight cameras. In
International Journal of Computer Assisted Radiology
and Surgery, 3(5): p. 427–431.
Sun, D., Roth, S., Lewis, J., and Black, M., 2008.
Learning optical flow. In Computer Vision ECCV,
Lecture Notes in Computer Science, 5304: p. 83-97.
Tan, K., Saatchi, R., Elphick, H., and Burke, D., 2010.
Real-time vision based respiration monitoring system.
In Proceeding of the seventh IEEE IET International
Symposium on Communication Systems, Networks and
Digital Signal Processing. Newcastle, UK: p. 770–
774.
Wu, H.-y., Rubinstein, M., Shih, E., and Freeman, W.,
2012. Eulerian Video Magnification for Revealing
Subtle Changes in theWorld. In Proceedings of ACM
Transactions on Graphics, 31: p. 1–8.
Automated Respiration Detection from Neonatal Video Data
169
