
Choroid Characterization in EDI OCT Retinal
Images Based on Texture Analysis
A. Gonz
´
alez-L
´
opez, B. Remeseiro, M. Ortega and M. G. Penedo
Departmento de Computaci
´
on, Universidade da Coru
˜
na, A Coru
˜
na 15071, Spain
Keywords:
OCT, Retinal Images, Choroid, Texture Analysis, Pattern Recognition, Machine Learning.
Abstract:
Optical Coherence Tomography (OCT) is a widely extended imaging technique in the opthalmic field for diag-
nostic purposes. Since layers composing retina can be identified in these images, several image processing-
based methods have been presented to segment them automatically in these images, with the aim of developing
medical-support applications. Recently, appearance of Enhanced Depth Imaging (EDI) OCT allows to tackle
exploration of the choroid which provides high information of eye processes. Therefore, segmentation of
choroid layer has become one of the more relevant problems tackled in this field, but it presents different fea-
tures that rest of the layers. In this work, a novel texture-based study is proposed in order to show that textural
information can be used to characterize this layer. A pattern recognition process is carried out by using diffe-
rent descriptors and a process of classification, considering marks performed by two experts for validation.
Results show that characterization using texture features is effective with rates over 90% of success.
1 INTRODUCTION
Optical Coherence Tomography (OCT) is a standard
imaging technique in the ophthalmologic field, which
provides a cross sectional image of the retina in a
non-invasive, real time fashion (Puzyeyeva et al.,
2011). Experts use OCT retinal images to diagnose
diseases, because retinal morphology can be identi-
fied effectively on them, explaining disease pathoge-
nesis and progression. Nowadays, Enhanced Depth
Imaging (EDI) OCT allows to better visualize the
choroid, which is the vascular tissue located at the
posterior part of the eye, between the retina and the
sclera. Choroid provides oxygen and nourishment to
the outer layers of the retina (Bill et al., 1983) and
its changes have been hypothesized to be of critical
importance in the pathophysiology of several retinal
diseases, such as glaucoma (Yin et al., 1997), cen-
tral serous chorioretinopathy (Imamura et al., 2009)
or retinitis pigmentosa (Dhoot et al., 2013). There-
fore, characterization and delimitation of this layer in
the OCT retinal images is important to understand the
natural processes of the eye, besides detecting poten-
tial eye diseases.
Although retinal segmentation is a widely studied
problem, automatical choroidal layer detection has
not been investigated in as much depth. A few me-
thods for this task have been recently reported. In
(Kaji
´
c et al., 2013), a two stage elaborated statis-
tical model is presented to automatically detect the
choroidal boundaries in EDI OCT images. A two-
stage active contour-based technique is used in (Lu
et al., 2013) to segment the outer boundary of the
choroid, but it requires the manual initialization of
the contour, while another semiautomatic approach is
also studied in (Hu et al., 2013). In (Alonso-Caneiro
et al., 2013), a graph-based method obtains promis-
ing results, but a process of enhancement is conside-
red, dependant of the instrument used for the image
capture. Choroidal vessels were analyzed through
a choroidal segmentation method in (Zhang et al.,
2012), but the focus of this work was to quantify the
vasculature rather than the choroidal thickness.
Since choroidal surface presents different visual
properties than the rest of retinal layers, a texture-
based characterization is interesting to be tackled, as
a previous step for a future segmentation method for
choroidal boundaries. Although texture information
is included in previous work (Danesh et al., 2014),
where a Gaussian Mixture Model of the image is built
based on features extracted with the Discrete Wavelet
Transform, and then used in the segmentation task, it
has not been studied deeply which features are those
that best describes this layer for a future and robust
process of segmentation. With that purpose, this work
presents a study of texture features that can be consi-
269
Gonzalez-Lopez A., Remeseiro B., Ortega M. and Penedo M..
Choroid Characterization in EDI OCT Retinal Images Based on Texture Analysis.
DOI: 10.5220/0005177602690276
In Proceedings of the International Conference on Agents and Artificial Intelligence (ICAART-2015), pages 269-276
ISBN: 978-989-758-074-1
Copyright
c
2015 SCITEPRESS (Science and Technology Publications, Lda.)
dered to characterize this layer, in order to determine
those that must be used to represent information in
this layer and design future process of segmentation
and information extraction. As results show, choroid
can be characterized effectively using textural infor-
mation.
This paper is organized as follows: Section 2 ex-
plains the method designed for the characterization of
the choroid. Section 3 describes materials and me-
thods, while in Section 4 obtained results are presen-
ted. Finally, conclusions and future lines are presen-
ted in Section 5.
2 METHODOLOGY
As it was introduced in Section 1, this work aims to
characterize choroidal layer using texture features, in
order to allow a future segmentation process of this
layer.
The process is described as follows: firstly,
the image provided by the OCT scanner is prepro-
cessed, in order to make it suitable for the method.
Since choroid is located between the Retinal Pig-
ment Epithelium-Bruch’s Membrane complex (RPE-
BM) and the sclera (see Figure 1), the region of in-
terest (ROI) must be bounded. Thus, choroidal up-
per boundary is detected and only the area covering
choroid and sclera is studied. After that, several win-
dows are extracted from the image to build diffe-
rent texture descriptors. Since ophthalmologic ex-
perts have marked manually the boundary between
the choroid and the sclera (marked in Figure 1 as
Outer Choroid Boundary (OCB) ) over the images,
extracted features can be used to perform a classifi-
cation process, in order to characterize the choroidal
layer. Thus, it is possible to perform a pattern recog-
nition process to discriminate between regions be-
longing to the choroid and those located in the sclera.
This process is reflected graphically in Figure 2.
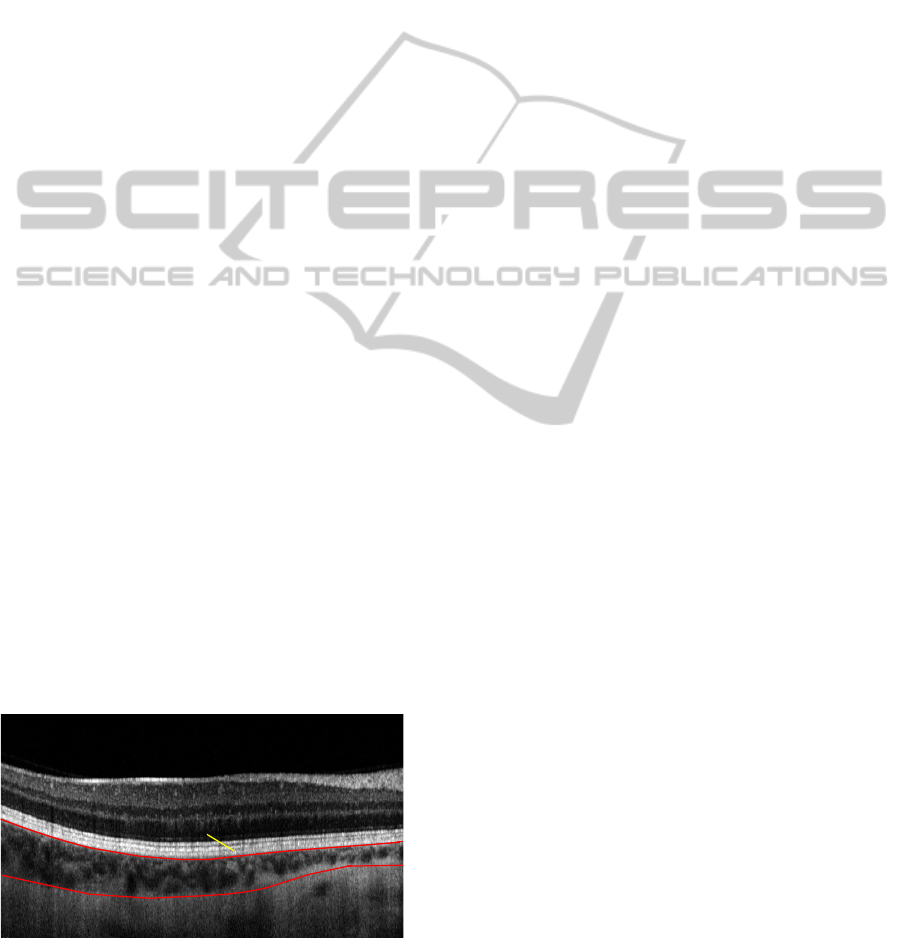
Choroid
RPE-BM
Sclera
OCB
Figure 1: Sample OCT image with choroidal layer bounda-
ries marked in red.
2.1 Preprocessing
Images provided by the OCT device includes irrele-
vant areas which must be excluded. Besides that, they
are captured following an inverted gray-scale distribu-
tion than that used in the segmentation process needed
in the ROI bounding step (Section 2.2). Thus, they
are automatically cropped and inverted to make the
following step feasible. It is essential to consider that
image captured by the scanner is resized for a better
visualization. This involves that, as it was observed
during initial test, decreasing resolution of the images
provided better results when texture features are ex-
tracted. Therefore, to tackle this process, after crop-
ping images, they are resized using a scale factor of
0.5. Consequently, not only the effectiveness of the
process is increased, but also the computation time is
reduced.
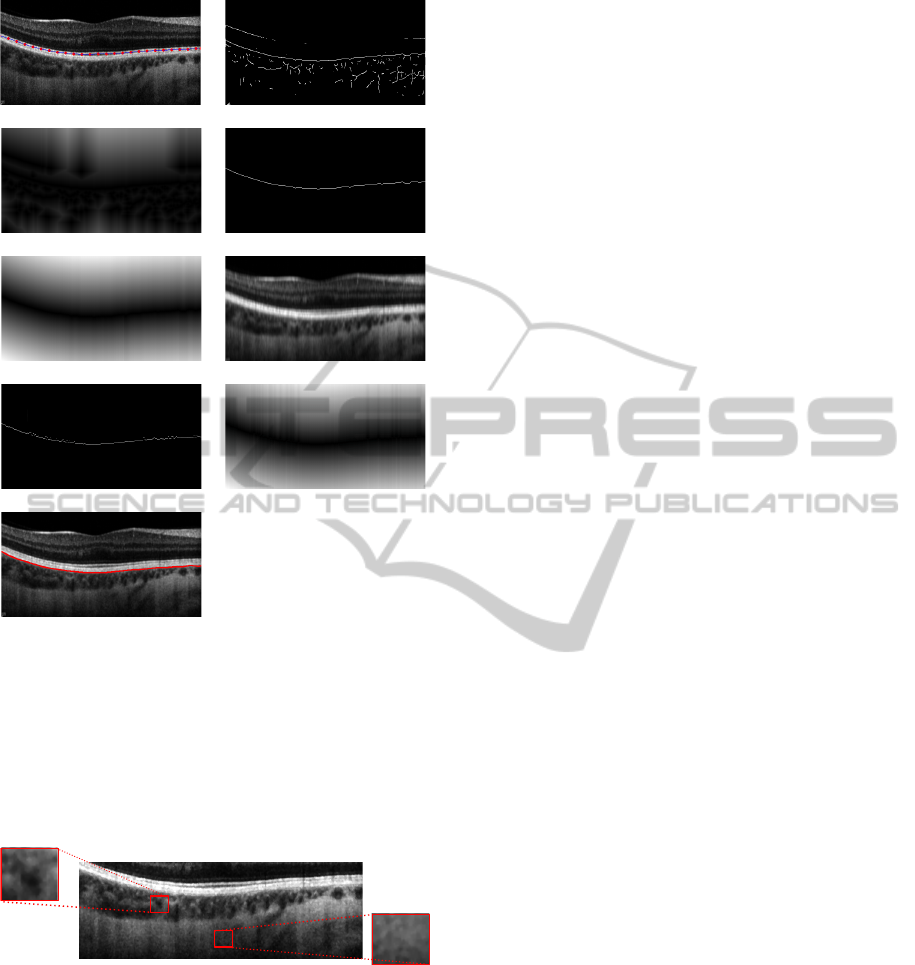
2.2 ROI Location
As it was commented, ROI is determined by the area
covering choroid and sclera. In order to bound it, the
inner boundary of the choroid surface, corresponding
to its borderline with the RPE-BC (see Figure 1), must
be detected. With that purpose, the multistage ac-
tive contour-based segmentation technique described
in (Gonz
´
alez et al., 2014) is used. This method detects
the boundary between these layers through a process
of energy minimization.
In particular, the active contour model used to seg-
ment this boundary is described as follows:
• Topology: it is defined as a sequence of nodes co-
vering the image width. Each node corresponds to
one pixel in the image and has two neighbors, ex-
cept for the first and the last ones. During the pro-
cess of minimization, nodes can make displace-
ments to its 8-connected neighbors (except for
nodes in the extrema, which only can move along
the rows in the image).
• Internal energy: first and second order terms are
considered in order to guarantee continuity and
curvature.
• External energy: since the boundary of interest
can be identified as a light-to-dark transition in the
image, besides the fact that it bounds a wide bright
area (RPE-BC), it includes information of edges
and regional intensity, as text belows explains.
The gradient distance is used, being computed
over edges corresponding to the mentioned kind
of transition. In order to avoid the influence of
some edges that would make the model reaching
wrong solutions and also for a fast evolution of the
ICAART2015-InternationalConferenceonAgentsandArtificialIntelligence
270
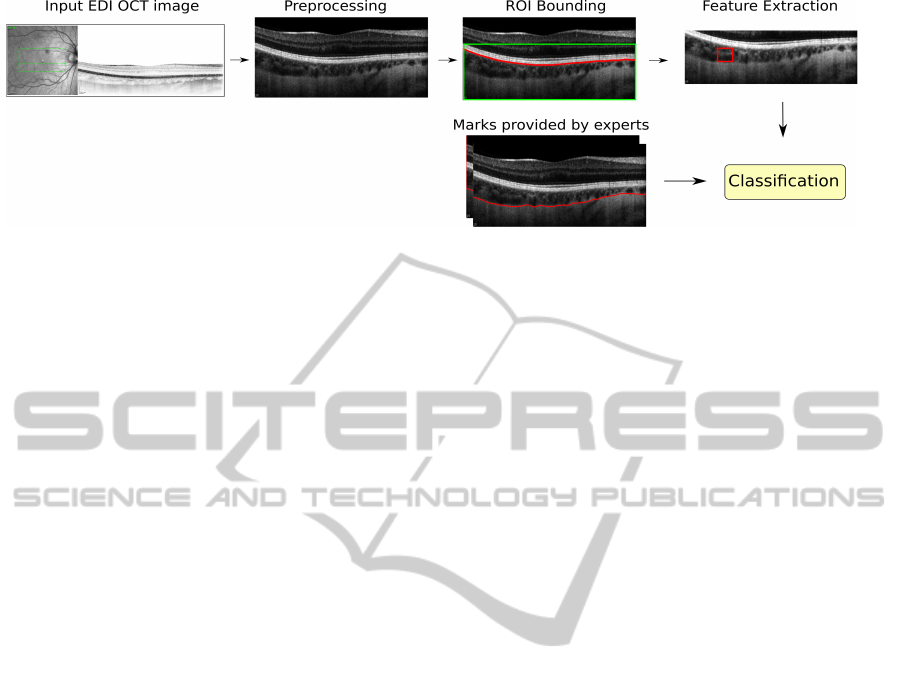
Figure 2: Phases followed for choroid characterization over a sample EDI OCT image.
contour, a new energy term is added, represent-
ing the distance between a node and the strongest
edge in the area of searching. This term is impor-
tant to encourage the movement of the contour in
the first steps of its evolution.
Regarding the intensity-based information, a term
encouraging pixels with bright regions above is
defined: accumulated intensity in a range of rows
above each pixel in the image is computed; then,
those pixels with the highest value per column are
extracted and finally, the value of this term is com-
puted as the gradient distance over them. These
steps are reflected in Figure 3 (f) (g) and (h), res-
pectively, for an easier understanding.
It is necessary to clarify that, in order to combine
different levels of information detail during the pro-
cess, this model is designed to work over two images
at the same time, each one enhanced in a different
manner. The first image is the original one smoothed
and with enhanced contrast, which contains precise
information, while the second image, obtained with
an aggressive preprocessing, provides a coarse level
of information, useful in the firsts steps of energy min-
imization.
Using this model, the nodes in the active contour
will be attracted to the desired boundary in the image
through a process of several stages of minimization.
For this boundary, two stages of minimization have
been defined, allowing to adjust parameters of the
model.
However, given that this method was designed for
standard OCT images, it needs to be modified in or-
der to make it feasible for EDI-OCT images. The
main difference between images captured with both
techniques is that lower layers present higher con-
trast and definition in case of EDI OCT. Thus, as pre-
vious step for RPE-BC/Choroid boundary segmen-
tation, the mentioned model is used to detect the
upper boundary of RPE-BC (it corresponds to the
strongest edge in the image). Using that information,
the active contour used to segment RPE-BC/Choroid
is initialized automatically and the segmentation of
the boundary is immediate, considering that it corre-
sponds to a very strong light-to-dark transition. Ob-
viously, parameters of the active contour-based model
must be adjusted in order to extend it for this new kind
of images.
2.3 Choroid Characterization
Once the upper boundary of the choroid is deter-
mined, it is necessary to establish its limit with the
sclera. Choroid layer presents different features than
the rest of layers in the retina. For instance, since
choroid is deep underneath the retina, OCT signals
can be degraded. This fact, in addition with the weak-
ness presented by choroid lower boundary, makes it
almost invisible in most cases. Besides that, its ap-
pearance is different from the other layers, because
it is formed by a dense vascularity structure and its
shape presents greater variations in thickness. In con-
traposition to that, sclera presents a more homoge-
neous intensity and it does not present vascularity fea-
tures.
Considering all these properties, it seems that the
detection of this layer can be tackled as a pattern
recognition problem, where its texture features can
be analyzed to characterize it. With that purpose, af-
ter enhancing the image contrast, several windows of
w × h pixels are obtained from the bounded region in
the images and are used to extract the different tex-
ture descriptors, described in Section 2.3.1 (Figure
4 shows a sample image with some of the extracted
windows). Then, the process of classification is per-
formed.
After assessing the performance of the different
texture descriptors at the current problem, the method
providing best results can be explored more deeply.
To do that, a feature selection procedure is applied
with the purpose of determining if removing irrele-
vant or redundant features can involve an improve-
ment in the performance of the classifier.
ChoroidCharacterizationinEDIOCTRetinalImagesBasedonTextureAnalysis
271
(d)
(e)
(b)
(g)
(a)
(f)
(c)
(h)
(i)
Figure 3: Segmentation of the choroid upper boundary
(RPE-BC/Choroid): (a) sample image with initialized ac-
tive contour; some energy terms: (b) edges corresponding
to dark to light transitions; (c) gradient distance computed
over (b); (d) strongest edges computed per column; (e) gra-
dient distance computed over (d); (f) accumulated intensi-
ties above each pixel; (g) strongest pixels per column in (d);
(h) gradient distance computed over (e); (i) boundary given
by interpolation of final nodes in the active contour.
(a)
(b)
Figure 4: Sample image with extracted windows correspon-
ding to (a) choroid layer and (b) sclera. Zoom has been
applied in order to show visual textural differences between
both areas (note the different homogeneity presented in both
cases).
2.3.1 Texture Descriptors
In order to analyze different modalities for texture
descriptor extraction, three widely used methods are
studied to perform the analysis, each one correspon-
ding to a different modality. Firstly, Markov Random
Fields (MRF) is analyzed, that is a model-based me-
thod; then, Co-ocurrences Features is proposed as sta-
tistical method and finally, as signal processing me-
thod, the Discrete Wavelet Transform (DWT). This
last method is chosen also because it is used in pre-
vious work (Danesh et al., 2014). Therefore, this
study is also useful to determine if the approach cho-
sen in that work is the most appropriate for this task
or, on the contrary, there are other methods that can
characterize better the choroid layer.
The three considered methods are detailed as
follows:
Markov Random Fields (MRF). (Besag, 1974) are
model based texture analysis methods that construct
an image model whose parameters capture the
essential perceived qualities of texture. A MRF is a
2D lattice of points where each point is assigned a
value that depends on its neighboring values. Thus,
MRFs generate a texture model by expressing the
gray values of each pixel in an image as a function of
the gray values in a neighborhood of the pixel. The
neighborhood of a pixel is defined as the set of pixels
within a Chebyshev distance d. Once the parameters
of the model are calculated, the descriptor of an
input image is obtained by computing the directional
variances proposed in (C¸ esmeli and Wang, 2001).
Notice that for a distance d, the descriptor comprises
4d features.
Co-occurrence Features. (Haralick et al., 1973) are
based on the computation of the conditional joint
probabilities of all pairwise combinations of gray
levels, given an interpixel distance and an orienta-
tion. This method generates a set of Gray Level
Co-occurrence Matrices, and extract several statistics
from their elements. As in the above method, the
Chebyshev distance is considered and so, for a dis-
tance d = 1, 4 orientations are considered (0
o
, 45
o
,
90
o
and 135
o
, as diagram in Figure 5 reflects), and
4 matrices are generated. In general, the number of
orientations and, accordingly, the number of matrices
for a distance d is 4d. From each co-occurrence ma-
trix a set of 14 statistics are computed, representing
features such as homogeneity or contrast. Then, mean
and range across matrices are extracted, resulting in a
set of 28 features which will be the descriptor of the
input image.
The Discrete Wavelet Transform. (Mallat, 1989)
generates a set of wavelets by scaling and translating
a mother wavelet, which is a function defined both
in the spatial and frequency domain. The different
parameters of the mother wavelet control the band-
pass of the filter in order to generate high-pass (H) of
ICAART2015-InternationalConferenceonAgentsandArtificialIntelligence
272
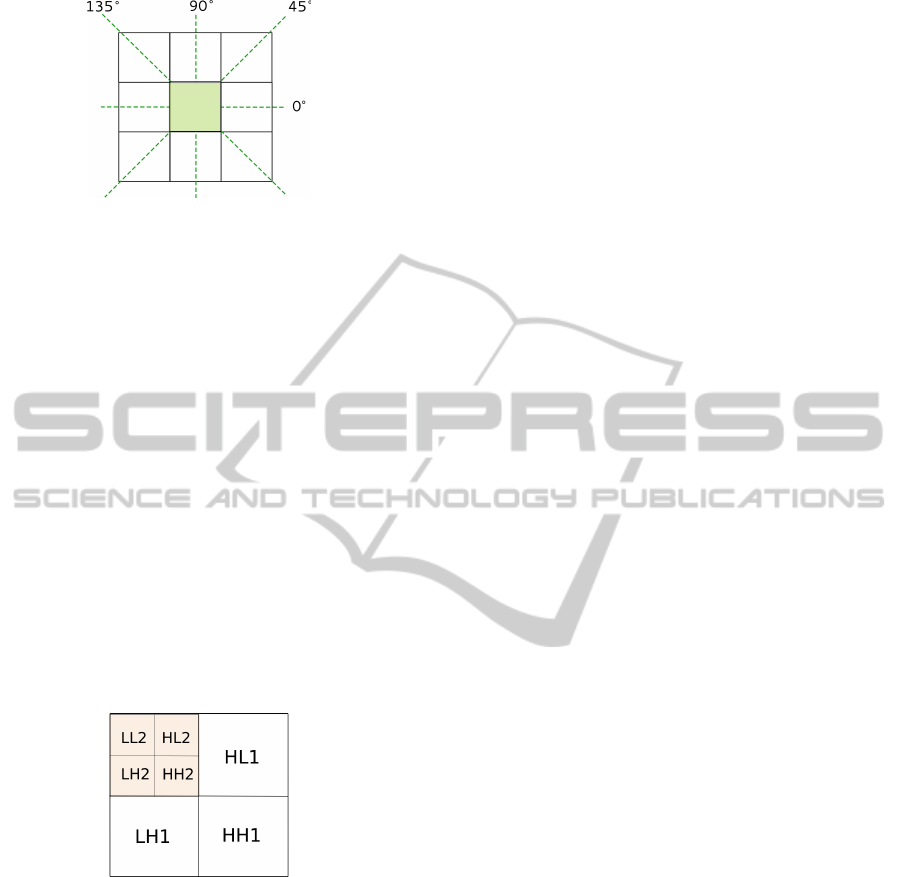
Figure 5: Orientations for distance d = 1 in Co-occurrence
Features.
low-pass (L) filters. The wavelet decomposition of an
image consists in applying wavelets horizontally and
vertically to generate 4 subimages at each scale (LL,
LH, HL, HH), which are then subsampled by a factor
of 2. After the decomposition, the process is repeated
n−1 times over the LL subimage, where n is the num-
ber of scales of the method. This iterative process re-
sults in the so-called standard pyramidal wavelet de-
composition shown in Figure 6.
Among the different mother wavelets found in the
literature, two of the most popular ones have been
used (Daubechies, 1992): Haar is the simplest non-
trivial wavelet, and Daubechies is one representative
type of basis for wavelets. The descriptor of an input
image is obtained by computing the mean and the ab-
solute average deviation of the input and LL images,
and the energy of the LH, HL and HH images. There-
fore, the descriptor of an input image is composed of
2 + 5 × n features.
Figure 6: Pyramidal wavelet decomposition for n=2 scales.
2.3.2 Classification
After descriptor extraction, they are processed by a
classifier, which will determine if a region must be-
long to choroid layer or not. In this work, a su-
pervised classifier, Support Vector Machine (SVM),
has been used. SVM is based on the statistical lear-
ning theory, performing classification by constructing
an N-dimensional hyperplane that optimally separates
the data in categories. Results in terms of percentage
accuracy are shown in next section, representing the
rate per cent of the windows correctly classified, ac-
cording to their category (in this case, belonging to
choroid layer or not).
2.3.3 Feature Selection
Once all textural descriptors have been assessed, a
feature selection process is applied over the method
providing the best performance. This is motivated by
the fact that an appropriate selection of the considered
features can lead to an improvement in the classifica-
tion, not only in terms of speed, but also regarding
the generalization capacity or simplicity of the model
(Bol
´
on-Canedo et al., 2013). In this work, despite
the variety of existing methods for feature selection,
filters are chosen, because they are computationally
simple and fast. In particular, three filters are consi-
dered:
• INTERACT (Zhao and Liu, 2009) is a subset fil-
ter mainly based on symmetrical uncertainty and
the consistency contribution, which indicates how
significantly the elimination of a feature can affect
consistency.
• Correlation-based Feature Selection (Hall, 1999)
is a simple multivariate filter that ranks feature
subsets according to a heuristic based on corre-
lation. Thus, subsets containing features that are
highly correlated with the class and uncorrelated
with each other, are selected.
• Consistency-based Filter (Dash and Liu, 2003) is
based on the evaluation of the worth of a subset
of features by the level of consistency in the class
values when the samples are projected onto the
subset of attributes. The inconsistency criterion
allows to determine what extent the dimensionally
reduced data can be accepted.
3 MATERIAL AND METHODS
The aim of this work is to characterize choroid layer
in the OCT retinal images through a texture analysis.
The materials and methods used in this research are
presented in the text that follows.
3.1 Data Source
Experiments have been done over a dataset of 63 two-
dimensional EDI OCT retinal images corresponding
to 7 different patients. Images were provided by Hos-
pital do Barbanza, Ribeira (Spain) and they were ex-
tracted using Spectralis OCT scanner (Heidelberg En-
gineering). Scanner optic axial resolution is 5µm.
Captured images have resolution of 1520 × 496 pi-
xels, although after the processes of cropping and re-
sizing applied during the preprocessing phase, their
dimensions are reduced to 495 × 218 pixels in mean.
ChoroidCharacterizationinEDIOCTRetinalImagesBasedonTextureAnalysis
273
3.2 Experimental Procedure
The experimental procedure is detailed as follows:
1. Extract windows from the ROI in the images,
using marks made by the experts to label them.
2. Apply the three texture analysis methods descri-
bed in Section 2.3.1 to the dataset of images.
3. Train a SVM (Section 2.3.2) with radial basis ker-
nel and automatic parameter estimation. Since 10-
fold cross-validation was used, the average error
across all trials was computed.
4. Evaluate the effectiveness of the proposed me-
thodology in terms of accuracy.
5. Apply the feature-selection procedures over the
textural method providing the best performance.
Repeat steps (3) and (4).
4 RESULTS AND DISCUSSION
Two experts have marked the OCB boundary in all
images. Windows for descriptor extraction have been
obtained and categorized from those areas correspon-
ding to agreement between experts. Window size is
w × h = 31 × 31 pixels, which seems big enough to
cover textural information in the choroid layer. Since
the number of windows extracted from the sclera
area is too much high than those extracted from the
choroid in each image, this set is reduced in order
to consider balanced sets. Regarding the texture des-
criptors used in this work, distances covering range 1
to 7 are studied for Markov Random Fields and Co-
occurrence Features, whereas for DWT, 4 scales and
4 different wavelets are used. Results are shown in
Tables 1, 2 and 3. Best rate for each method has been
highlighted.
Table 1: Accuracy(%) using SVM classifiers for Markov
Random Fields with distances d from 1 to 7.
1 2 3 4 5 6 7
80.52 79.59 71.99 77.48 77.38 74.67 75.35
Table 1 presents results for Markov Random
Fields, whose best rate is obtained for distance d =
1 (over 80%). Besides that, it is possible to ob-
serve that bigger the distance, the lower the accuracy,
what means that textural information is progressively
smaller in those cases.
Co-occurrence Features (Table 2) provides rates
over 90% in all cases. In particular, the highest ac-
curacy is near 94% and it is obtained using distance
d = 3.
Table 2: Accuracy(%) using SVM classifier for Co-
ocurrences Features for distances d from 1 to 7
1 2 3 4 5 6 7
93.88 93.80 93.97 93.76 93.62 93.26 93.32
Table 3: Accuracy(%) using SVM classifier for Discrete
Wavelet Transform, considering different mother wavelets
with scales n from 1 to 4. Daubi represents the Daubechies
orthonormal wavelet, with number of vanishing moments
equal to half the coefficient i. Note that the Haar wavelet is
equivalent to Daub2.
1 2 3 4
Haar 86.86 88.68 82.95 80.05
Daub4 86.11 84.02 82.58 79.42
Daub6 85.68 84.31 81.73 78.39
Daub8 85.66 85.86 82.08 78.82
Regarding DWT, Table 3 shows that using Haar
wavelet with n = 2 scales provides the best result
(88.68%). Results also reflect that performance de-
creases at the time that distance increases. This is due
to the window size chosen for this work, given that
when more scales are used, information in the small-
est LL subimages is degraded. Therefore, studying
more scales does not make any sense.
Though all considered texture analysis me-
thods present acceptable rates, the highest accuracy
(93.97%) is obtained using Co-occurrence Features
with distance d = 3. Besides that, this method pro-
vides, in general, better and more stable results. Re-
garding Markov Random Fields, most results are
worse than those provided by the other considered
methods. Despite the fact that both Markov Random
Fields and Co-occurrence Features uses information
of the pixel’s neighborhood, it is possible to conclude
that MRF does not work so well because the statis-
tics proposed by Haralick et al. provide much more
information. With regards to DWT, which was spe-
cially interesting because Haar wavelet was used in
the mentioned previous work (Danesh et al., 2014),
it presents lower accuracy (always below 90%) than
Co-ocurrences in all cases.
Table 4: Results using SVM classifier for Co-occurrence
Features with distance d = 3, after applying filters for fea-
ture selection: first row shows number of selected features
whereas the accuracy is shown in second row.
No FS INT CFS Cons
N. Features 28 14 9 15
Accuracy (%) 93.97 93.18 91.35 93.84
Since the method providing the best results, Co-
occurrence Features, considers features that may be
strongly correlated (Haralick et al., 1973), the feature-
selection process proposed in Section 2.3.3 is moti-
vated. Thus, filters described in that section are consi-
ICAART2015-InternationalConferenceonAgentsandArtificialIntelligence
274

dered in order to remove irrelevant features. They are
applied to the features extracted using Co-occurrence
Features with distance d = 3, since this method, as
it was commented, provides the best performance.
After feature selection, process described in Section
2.3.2 is repeated: SVM is trained and a 10-fold cross-
validation is done. Table 4 shows accuracy obtained
by each method (INTERACT - INT, correlation-based
feature selection - CFS and consistency-based filter -
Cons), as well as the number of features selected by
each one.
As it was commented previously, Co-occurrence
Features with distance d = 3 provides the best rate
(93.97%). For this descriptor, 28 features are consi-
dered. Results after applying feature selection, pre-
sented in Table 4, show that CFS has the most aggres-
sive behaviour since it retains 32.14% of the features,
but at the expense of a slight decrease in the accuracy
of the classifier, while Cons and INTERACT retain
around the 50% of the initial features with no degra-
dation in performance. Thus, results obtained with
Co-occurrence Features (d = 3) can be remained but
with a significant reduction in the number of features.
Note that a reduction in the number of feature implies
a decrease in the time needed to compute the descrip-
tor. This time, which is not a matter of study in this
paper, could become a bottle neck when applying a
segmentation process in which a great amount of win-
dows have to be analyzed, and herein also lies the re-
levance of using feature selection.
5 CONCLUSIONS AND FUTURE
WORK
In this work, an automatic characterization of the
choroid layer in EDI OCT retinal images based on
textural information has been presented. The me-
thod consists in locating the region of interest through
an active contour-based segmentation and then, ex-
tracting texture descriptors to perform a classification
process with the purpose of discriminating between
regions belonging to the choroid from those corres-
ponding to other areas. Different texture descriptors
have been considered for the pattern recognition task
in order to perform a comparative study and deter-
mine the best one to represent this layer. Results show
that the choroid can be identified in a very effective
way using Co-ocurrences Features, surpassing pre-
vious works (Danesh et al., 2014). Feature selec-
tion has been applied, allowing to eliminate the irre-
levant/redundant features with no degradation in the
accuracy of the performance. Therefore, texture in-
formation extracted with this method can be used to
characterize this layer in a robust way.
As future work, a deeper study of textural infor-
mation with different descriptors could be done, as
well as more classifiers can be considered. Besides
that, this information must be included in a methodo-
logy that allows to tackle the accurate segmentation
of the lower choroid boundary.
ACKNOWLEDGEMENTS
This paper has been partly funded by Instituto de
Salud Carlos III under PI14/02161 project and the
Secretar
´
ıa de Estado de Investigaci
´
on, Desarrollo e
Innovaci
´
on of the Spanish Government (A. Gonz
´
alez-
L
´
opez acknowledges its support under FPI Grant Pro-
gram). The authors would like to thank Hospital do
Barbanza, Ribeira (Spain) for providing images.
REFERENCES
Alonso-Caneiro, D., Read, S. A., and Collins,
M. J. (2013). Automatic segmentation of
choroidal thickness in optical coherence tomog-
raphy. Biomed. Opt. Express, 4(12):2795–2812.
Besag, J. (1974). Spatial interaction and the statistical
analysis of lattice systems. Journal of the Royal
Statistical Society. Series B, 36:192–236.
Bill, A., Sperber, G., and Ujiie, K. (1983). Physiology
of the choroidal vascular bed. Int. Ophthalmol.,
6(2):101–107.
Bol
´
on-Canedo, V., Snchez-Maroo, N., and Alonso-
Betanzos, A. (2013). A review of feature selec-
tion methods on synthetic data. Knowl. Inf. Syst.,
34(3):483–519.
C¸ esmeli, E. and Wang, D. L. (2001). Texture segmen-
tation using gaussian-markov random fields and
neural oscillator networks. IEEE Transactions
on Neural Networks, 12(2):394–404.
Danesh, H., Kafieh, R., Rabbani, H., and Hajizadeh,
F. (2014). Segmentation of choroidal boundary
in enhanced depth imaging octs using a multires-
olution texture based modeling in graph cuts.
Computational and Mathematical Methods in
Medicine, 2014(479268).
Dash, M. and Liu, H. (2003). Consistency-based
search in feature selection. Artificial Intelli-
gence, 151(1-2):155–176.
Daubechies, I. (1992). Ten Lectures on Wavelets.
Society for Industrial and Applied Mathematics,
Philadelphia, PA, USA.
ChoroidCharacterizationinEDIOCTRetinalImagesBasedonTextureAnalysis
275

Dhoot, D., Huo, S., Yuan, A., Xu, D., Srivistava,
S., Ehlers, J., Traboulsi, E., and PK., K. (2013).
Evaluation of choroidal thickness in retinitis pig-
mentosa using enhanced depth imaging optical
coherence tomography. British Journal of Oph-
thalmology, 97(1):66–9.
Gonz
´
alez, A., Ortega, M., Penedo, M., and Charl
´
on,
P. (2014). Automatic robust segmentation of reti-
nal layers in oct images with refinement stages.
In International Conference on Image Analysis
and Recognition (ICIAR), volume 8815 of Lec-
ture Notes in Computer Science, pages 337–349.
Springer Berlin Heidelberg.
Hall, M. (1999). Correlation-based Feature Subset
Selection for Machine Learning, PhD disserta-
tion. PhD thesis, University of Waikato.
Haralick, R., Shanmugam, K., and Dinstein, I. (1973).
Textural features for image classification. IEEE
Transactions on Systems, Man, and Cybernetics,
3(6):610–621.
Hu, Z., Wu, X., Ouyang, Y., Ouyang, Y., and Sadda,
S. (2013). Semiautomated segmentation of the
choroid in spectral-domain optical coherence to-
mography volume scans. Investigative Ophthal-
mology & Visual Science, 54(3):1722–9.
Imamura, Y., Fujiwara, T., Margolis, R., and Spaide,
R. (2009). Enhanced depth imaging optical co-
herence tomography of the choroid in central
serous chorioretinopathy. Retina, 29(10):1469–
73.
Kaji
´
c, V., Esmaeelpour, M., Glittenberg, C., Kraus,
M. F., Honegger, J., Othara, R., Binder, S., Fuji-
moto, J. G., and Drexler, W. (2013). Automated
three-dimensional choroidal vessel segmentation
of 3d 1060 nm oct retinal data. Biomed. Opt. Ex-
press, 4(1):134–150.
Lu, H., Boonarpha, N., Kwong, M., and Zheng, Y.
(2013). Automated segmentation of the choroid
in retinal optical coherence tomography images.
In IEEE Eng Med Biol Soc, pages 5869–72.
Mallat, S. G. (1989). A theory for multiresolution
signal decomposition: The wavelet representa-
tion. IEEE Trans. Pattern Anal. Mach. Intell.,
11(7):674–693.
Puzyeyeva, O., Lam, W. C., and Flanagan, J. e. a.
(2011). High-resolution optical coherence to-
mography retinal imaging: A case series illus-
trating potential and limitations. J. Ophthalmol-
ogy, pages 764183–6.
Yin, Z. Q., Vaegan, T. J., Millar, T. J., Beaumont,
P., and Sarks, S. (1997). Widespread choroidal
insufficiency in primary open-angle glaucoma.
Journal of Glaucoma, 6(1):23–32.
Zhang, L., Lee, K., Niemeijer, M., Mullins, R.,
Sonka, M., and Abrmoff, M. (2012). Automated
segmentation of the choroid from clinical sd-oct.
Investigative Ophthalmology & Visual Science,
53(12):7510–9.
Zhao, Z. and Liu, H. (2009). Searching for interacting
features in subset selection. Intell. Data Anal.,
13(2):207–228.
ICAART2015-InternationalConferenceonAgentsandArtificialIntelligence
276
