Moving Target FSR Shadow Detection Using GPS Signals
Hristo Kabakchiev
1
, Ivan Garvanov
2
, Vera Behar
3
, Panayot Daskalov
4
, and Hermann Rohling
5
1
Sofia University, 15 Tsar Osvoboditel Blvd,1504 Sofia Sofia, Bulgaria
2
ULSIT, bul. Carigadsko Shouse № 119, 1784 Sofia, Bulgaria
3
IICT- Bulgarian Academy of Sciences, Serdika St 4, 1000 Sofia, Bulgaria
4
UNWE, ulitsa 8-mi dekemvri, 1700 Sofia, Bulgaria
5
TU Hamburg-Harburg Institut für Nachrichtentechnik Eißendorfer Straße 40 D-21073 Hamburg, Germany
ckabakchievr@fmi.uni-sofia.bg, i.garvanov@unubit.bg, dkabakchieva@fmi.uni-sofia.bg, rohlingr@tu-harburg.de
Keywords: FS effect, FSR, GPS, detection and estimation.
Abstract: Forward Scatter GPS (FS-GPS) radio shadows obtained from different objects are investigated in this article.
FS radio shadow is essential physical phenomenon, which can be used to extract some useful information
about the objects that generate it. Registration of FS-GPS radio shadows from moving and stationary objects
is performed using a small commercial GPS antenna and mobile and stationary receiver. Topology of the
experiment meets the requirements for the appearance of the FS effect. The results presented in this article
show that from FS-GPS radio shadows of different objects can be extracted information about the parameters
of the object (size, speed and direction of movement, distance to the receiver). The information obtained can
be used in various applications like those in classic radar, including radio barriers, security, classification and
identification of moving and stationary objects.
1 INTRODUCTION
Forward Scattering Radar operates in the narrow area
of the forward scattering effect where the bistatic
angle is close to 1800, and the target moves near the
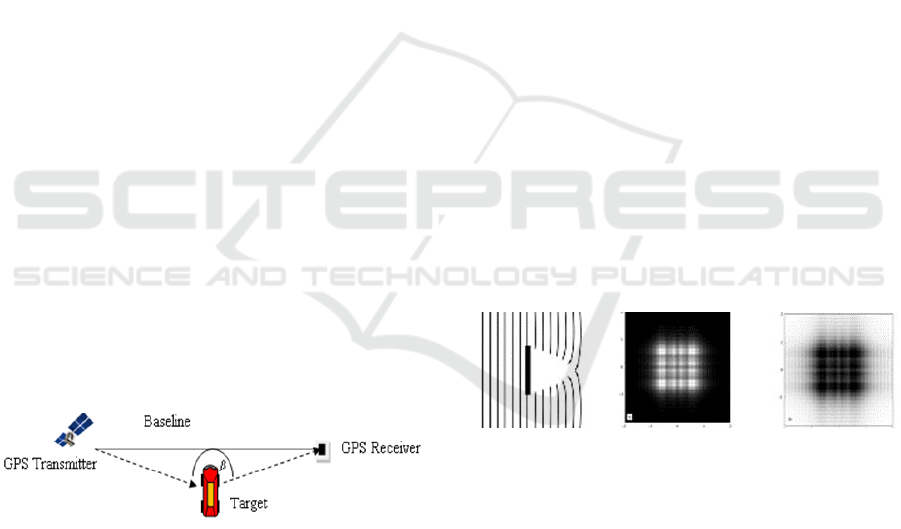
transmitter-receiver baseline (Fig.1) [1].
Figure 1: FSR topology.
In FSR, the Babinet principle is exploited to form the
forward scatter signature of a target (see figure 2).
The Babinet principle says “A plane absorbing screen
of limited dimensions may be replaced by a
complementary infinite plane screen with an aperture
shaped exactly like the original screen (the
complementary screen has openings where the
original screen is closed and vice versa). The incident
field diffracted at the aperture gives rise to the field
coinciding with the shadow field of the original
absorbing screen, (except for the sign)’ (Fig.2).
Figure 2: Babinet’s principle applied to the FS case with the
receiver positioned on the other side of the targets at β =
180°.
Due to the forward scattering effect, the Radar
Cross Section (RCS) of targets extremely increases
(by 2-3 orders) and mainly depends on the target’s
physical cross section and is independent of the
target’s surface shape and the absorbing coating on
the surface. The use of GPS signals as a passive radar
system is becoming increasingly popular as an
alternative to radar systems. The idea to apply a GPS
L1 receiver to FSR for air target detection is discussed
in [2]. Some experimental results of a GPS L1
receiver concerning the detection of air targets are
shown and discussed in [3]. A possible algorithm for
34
Kabakchie H., Garvanov I., Behar V., Daskalov P. and Rohling H.
Moving Target FSR Shadow Detection Using GPS Signals.
DOI: 10.5220/0005420900340040
In Proceedings of the Third International Conference on Telecommunications and Remote Sensing (ICTRS 2014), pages 34-40
ISBN: 978-989-758-033-8
Copyright
c
2014 by SCITEPRESS – Science and Technology Publications, Lda. All rights reserved
air target detection in a GPS L5-based FSR system is
described in [4], and the detection probability
characteristics are calculated in [5] in case of low-
flying and poorly maneuverable air targets in the
urban interference environment. GPS L1 FSR system
is researched in [6, 7] for detection of FSR shadows
from stationary ground objects. Target detection is
indicated if the signal integrated from some satellites
exceeds a predetermined threshold. In this paper a
passive FSR system, similar to the GPS L1 FSR
system, in which GPS satellites are exploited as non-
cooperative transmitters, is studied. The aim of this
study is to verify the possibility to detect FSR shadow
of moving ground targets when GPS satellites are
located at small elevation angles. The experimental
scenarios include stationary or moving targets,
stationary or moving GPS-FSR receivers that register
different FS shadows. The paper investigates the
possibility of extracting useful information from the
radio shadow The obtained experimental results can
be used to develop software applications to a GPS
receiver that could measure traffic movement, target
velocity and target classification.
2 FSR EXPERIMENT
DESCRIPTION
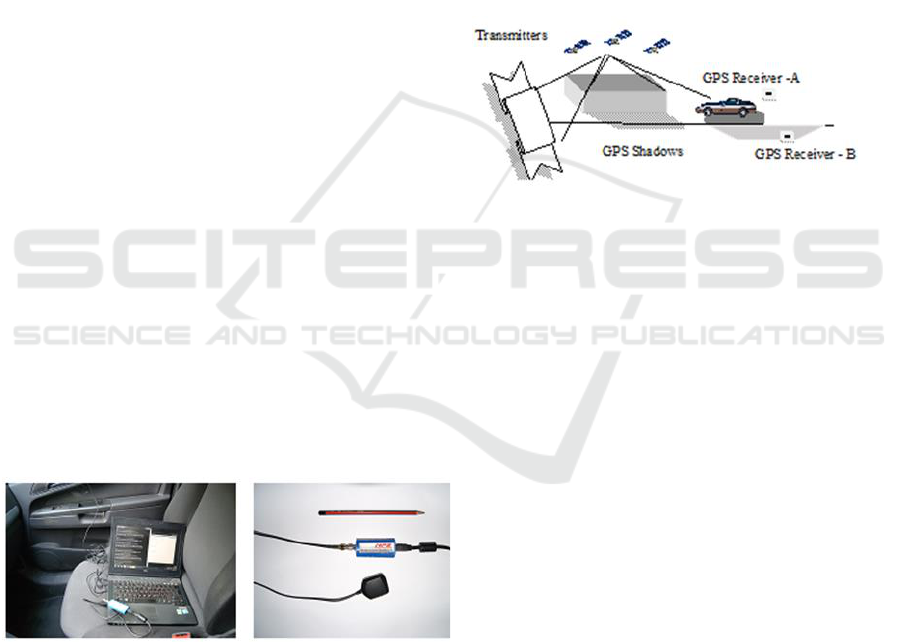
The purpose of the experiments is to verify that with
a small and omnidirectional commercial GPS antenna
is possible to record differences in GPS FS shadows
of moving and stationary targets depending on the
size of the target and the target velocity, and also to
verify whether the difference in the shadows allows
classifying the objects (Fig.3).
Figure 3: Experimental equipment
The paper discusses three experimental scenarios.
In the first two scenarios the objects are stationary
(bridge and building) and GPS receiver moves while
in the third scenario - the object moves and GPS
receiver is stationary. In all scenarios the condition
for the occurrence of FS-GPS effect are guaranteed.
In the registration of shadows from buildings and
vehicles are selected satellites located low on the
horizon. In a study of radio shadow from the trestle
are selected satellites located high above the horizon,
so that the baseline "receiver-satellite" is always
perpendicular to the plane of the object (building,
station, and car). The purpose of these experiments is
to check whether the type of the registrated FS
shadows depends not only on the dimensions of the
object, but also the speed of the GPS receiver or the
object. The dependence of the type of FS shadow on
the size and speed of the marine targets using coastal
FSR radars is established in [1]. During the first
scenario the GPS recording system is mounted at a
car. In this study we verify the possibility of detection
of ground targets by using a GPS L1-based FSR
system when GPS satellites are located at small
elevation angles (Fig.4).
Figure 4: GPS-FSR topology (GPS receiver – A is moving,
GPS receiver – B is stationary)
During the experiment, the car with the GPS
receiver moves parallel to the building and records
the GPS signal in order to registrate the FS shadow
from the beginning to the end of the building. The
idea of this experiment is to verify whether the energy
of the signal from the satellite and the proposed from
us the signal processing trough accumulation of the
navigation message from GPS within several hundred
milliseconds is sufficient to form the FS shadow of a
stationary object with large dimensions, which can be
registered with the experimental equipment. During
the second experiment the car with mounted GPS
receiver moves with velocity of 60-70 km. under the
large bridge (Fig.4). The third scenario includes a
moving targets and stationary-based GPS-FSR
system that records FS shadow of cars moving on the
road (Fig.4). The car with the GPS receiver is
positioned from the one side of the road and records
the signal from GPS. For recording are selected such
visible satellites, which are located at low elevation
angles and form a baseline (between satellite and
receiver) perpendicular to the road, in order to form
the FS effect. During the experiment are recorded the
satellite signals when cars move on the road. Cars
passing on the road have different dimensions (cars,
buses, trucks, etc.).
Moving Target FSR Shadow Detection Using GPS Signals
35
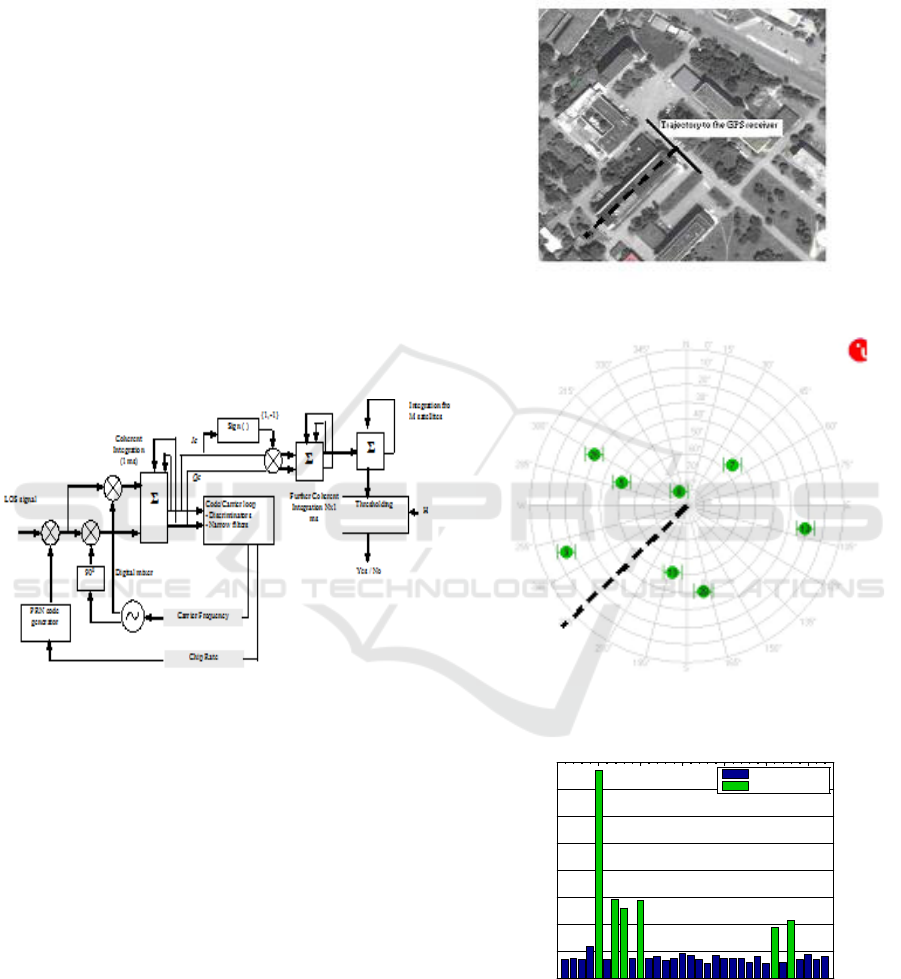
3 SIGNAL PROCESSING
The general block-scheme of a possible algorithm for
FSR shadow detection using several (M) visible
satellites is shown in Fig 4 [1, 8]. According to this
block-scheme, several visible GPS satellites are
acquired and tracked over the complete duration of
recorded signals. We consider the case when the
acquisition and tracking algorithms of a GPS receiver
are implemented in MATLAB. The absolute values
of the Ip component at the output of the
Code&Carrier tracking block are then integrated
during N milliseconds. These integrated output
signals from M satellites are additionally summed in
order to improve SNR before detection. Target
detection is indicated if the signal integrated from M
satellites exceeds a predetermined threshold H. In
such a system, the signal integrated at the output of
the Code&Carrier tracking block (message bits) of a
GPS receiver can be used for detection of the FSR
shadow created by moving targets.
Figure 5: Signal processing used for target detection in a
passive FSR using GPS signals from M satellites
In this paper we propose to additionally integrate the
output signals from M visible satellites in order to
improve the SNR before detection. Target detection
is indicated if the signal integrated from M satellites
exceeds a predetermined threshold.
4 EXPERIMENTAL RESULTS
Experiment 1. The receiver GNSS_SRR records the
signals received from the satellite when moving along
straight path behind a large building. The scenario
topology is shown in Fig.6. Straight line shows the
path of the GPS receiver mounted on the car. Dashed
line indicates the direction of the necessary baseline
"receiver-satellite" in which there is a condition for
the occurrence of FS effect. That line is shown in Fig.
6 and Fig.7. With this line we choose the most
suitable experimental satellite. Satellites that are
visible during this experiment are shown in Fig.7.
Figure 6: Experiment 1
Figure 7: Satellite constellation
Figure 8: Acquisition results (Experiment 1)
The intensity of the signals from all visible satellites
is shown in Fig.8. From Fig. 7 and Fig.8 follows that
the most suitable for this experiment is satellite 9
0 5 10 15 20 25 30
0
2
4
6
8
10
12
14
16
Acquisition results
PRN number (no bar - SV is not in the acquisition list)
Acquisition Metric
Not acquired signals
Acquired signals
Third International Conference on Telecommunications and Remote Sensing
36
because it is very close to the direction of the baseline
where can be occur the FS effect, and is located the
lowest elevation angles. The coherent integration of
the I
P
component power is made during 200ms, and
results of integration are shown in Fig.9.
Figure 9: Integrated power of the message (200ms)
In the paper [6] it has been found that the interval
of integration of the message is better to be 200ms
because this interval of integration allows you to keep
the shape of the shadow and to remove random
fluctuations. It can be seen that the shadow due to the
target (large building) can be exploited for detection
of the target (large building).
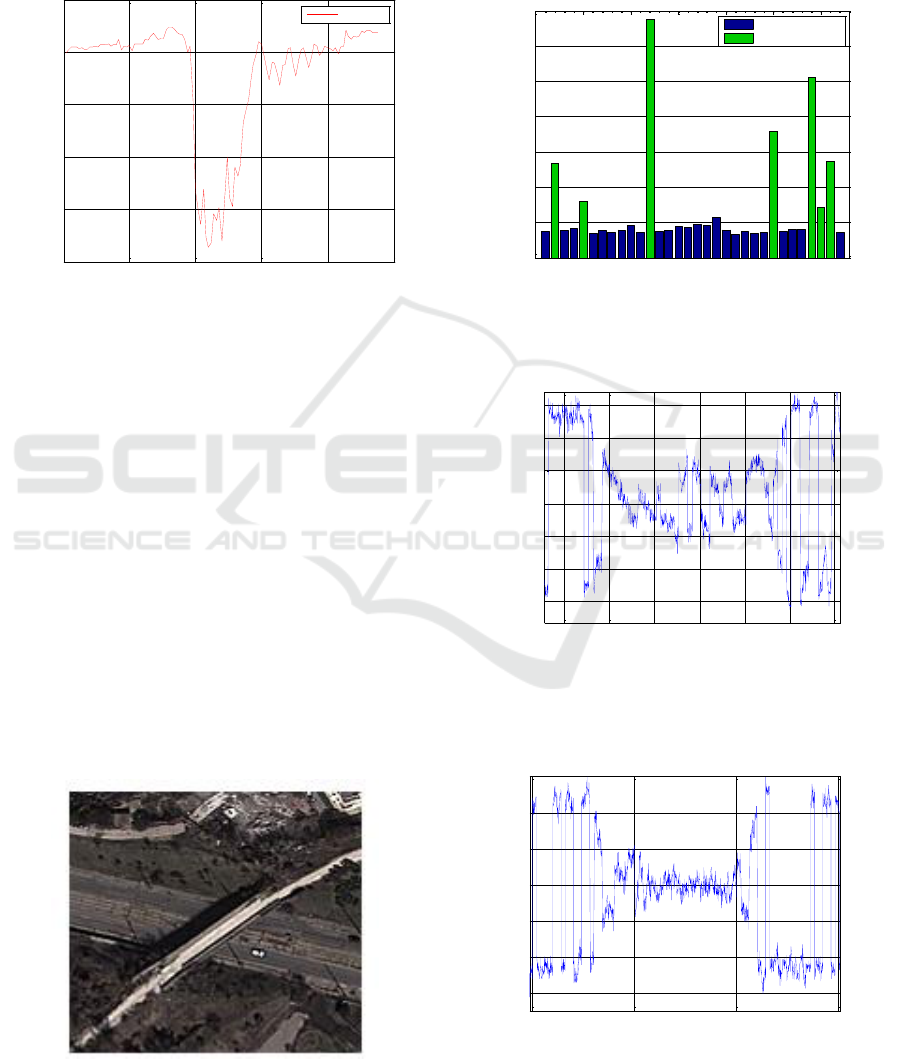
Experiment 2. The car with GPS receiver moves
with a constant velocity of 60 km/h under the small
bridge (Fig. 10). The output of C/A code acquisition
performance is shown in Fig. 11. It can be seen that
during this experiment seven satellites are visible,
three of which with numbers 12, 29 and 25 have the
strongest signals. The signals from these satellites
will be used for detection of the FS shadow created
be a bridge.
Figure 10: Experiment 2
These satellites are located at the high elevation
angles and should be meet the requirements for the
occurrence of the FS effect. Navigation messages at
the output of the Code&Carrier loop received from
the satellites 12, 25 and 28 are shown in Figs. 12-14.
Figure 11: Acquisition results (Experiment 2)
Figure 12: Navigation message of satellite 12
Figure 13: Navigation message of satellite 29
0 5 10 15 20 25
95
100
105
110
115
120
Integration time=200 ms
Time [s]
20log10(Ip) in dB
Channel-1
0 5 10 15 20 25 30
0
2
4
6
8
10
12
14
Acquisition results
PRN number (no bar - SV is not in the acquisition list)
Acquisition Metric
Not acquired signals
Acquired signals
8.6 8.8 9 9.2 9.4 9.6 9.8
-6000
-4000
-2000
0
2000
4000
6000
Bits of the navigation message
Time (s)
9 9.5 10 10.5
-6000
-4000
-2000
0
2000
4000
6000
Bits of the navigation message
Time (s)
Moving Target FSR Shadow Detection Using GPS Signals
37
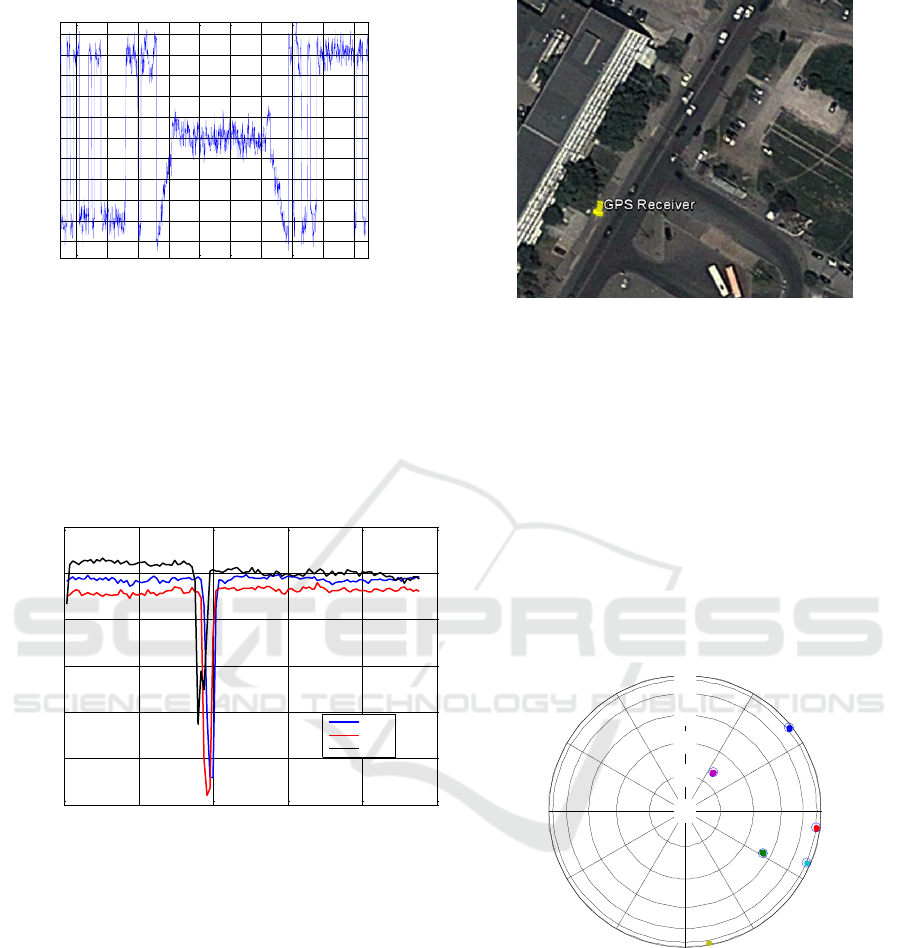
Figure 14: Navigation message of satellite 25
From figures 12-14, it is seen that during the
passage of the vehicle under the bridge, the intensity
of the information signal drastically reduces and
forms a FS shadow with the certain geometry and
form. The integrated messages from the three
satellites obtained with a sliding window of 200 ms
are shown in Fig. 15.
Figure 15: Integrated messages of satellites 12, 25 and 29
As seen from Fig. 15, the shape and size of the
shadow depends on the direction (the position of the
satellite) of the incoming signal from the satellites.
The deepest shadow is obtained by satellite 25, which
shows that this satellite creates the best conditions for
the occurrence of the FS effect.
Experiment 3. The GPS receiver is positioned at the
one side of the road (Fig. 16).The street has four lanes
width of 4m, two in one direction. On the west of the
receiver has a high building, so the GPS receiver only
sees the GPS satellites from the east. During the
experiment, several cars moves with a velocity about
10 - 20 km/h relative to the GPS receiver.
Figure 16: Experiment 3
The position of the visible satellites and the
intensity of the incoming signals from them are
shown in Fig. 17 and Fig.18. It can be seen that during
this experiment six satellites are visible, two of which
with numbers 16 and 32 create the best conditions for
the occurrence of the FS effect. They are the most low
on the horizon and the car crosses the baseline
"satellite - receiver" at the angle of about 90 degrees.
Satellites 1 and 30 are too low on the horizon, but in
their case the vehicle crosses the baseline “”satellite-
receiver”” at an angle other than 90 degrees.
Figure 17: Satellite constellation
In the case of satellites 1 and 30, the conditions of
the occurrence of FS effect are violated. Satellite 20
is located at the elevation angle close to 90 degrees,
i.e. high above the horizon, which worsens the
conditions of the occurrence of the FS effect. It is so
because the direction of propagation of the waves
from the satellite is not orthogonal with respect to the
cross section of the vehicle. The same was observed
for the satellite 23. The integrated signals from these
satellites 16 and 32 are shown on Fig. 19 and 20.
8.6 8.8 9 9.2 9.4 9.6 9.8 10 10.2 10.4
-5000
-4000
-3000
-2000
-1000
0
1000
2000
3000
4000
5000
Bits of the navigation message
Time (s)
0 5 10 15 20 25
95
100
105
110
115
120
125
Integration time=200 ms
Time [s]
20log10(Ip) in dB
Sat-29
Sat-25
Sat-12
10 20 30 40 50 60 70
-100
-50
0
50
100
Coordinates variations in UTM system
Measurement period: 500ms
Variations (m)
-100 -50 0 50 100
-100
-50
0
50
100
East (m)
Positions in UTM system (3D plot)
North (m)
30
210
60
240
90270
120
300
150
330
180
0
0
15
30
45
60
75
90
30
20
16
32
23
Sky plot (mean PDOP: 12.2654)
E
N
U
Measurements
Mean Position
Lat: 424039.5766
Lng: 23229.4092
Hgt: +426.3
Third International Conference on Telecommunications and Remote Sensing
38
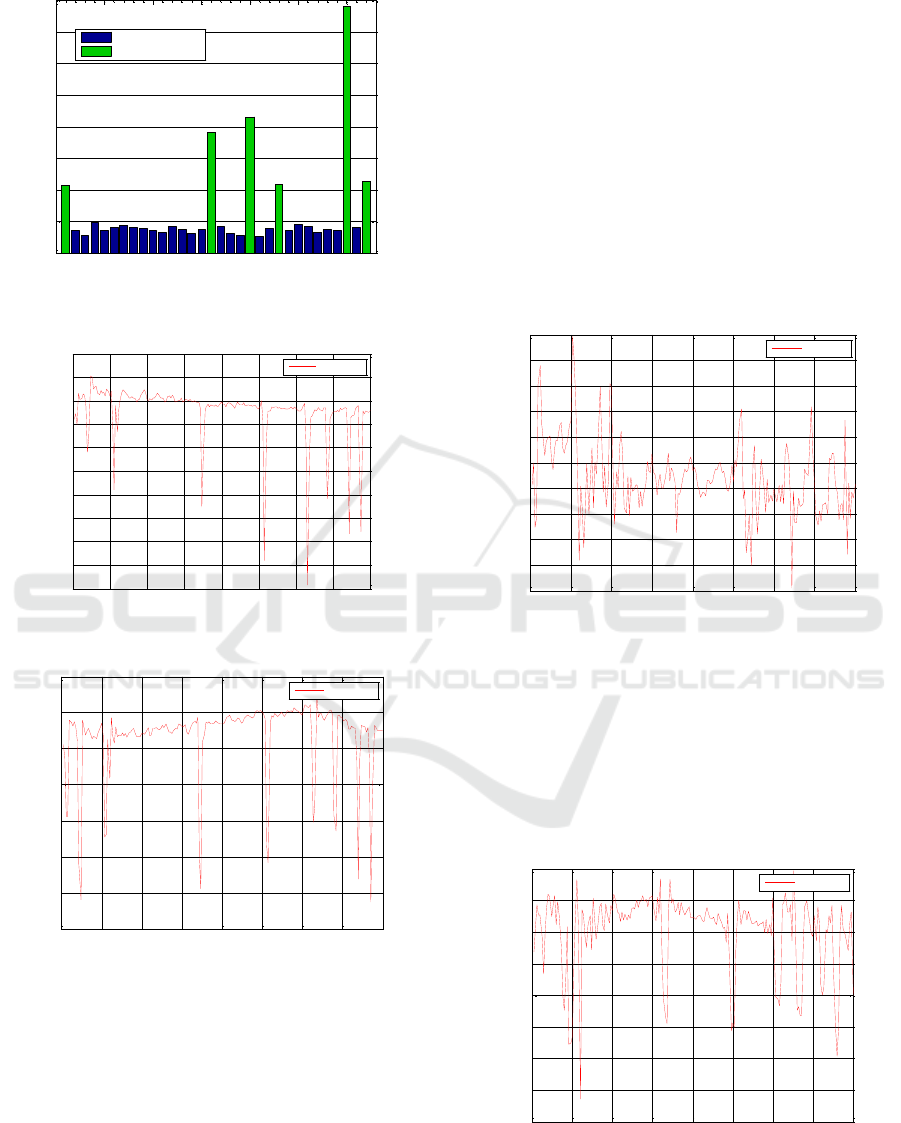
Figure 18: Acquisition results (Experiment 3)
Figure 19: Integrated message from satellite 32
Figure 20: Integrated message from satellite 16
These figures show a series of FS shadows from
different cars passing by the GPS receiver. As shown,
the depth and shape of the shadow provides
information about the size of the car, the speed and
the direction of movementof the car, and the distance
from the vehicle to the GPS receiver
.As can be seen that cars passing very close to the
receiver have the deepest FS shadow (about 8-10 dB).
A car passing at a distance of 4 meters from the GPS
receiver creates the deepest FS shadow (about 8-10
dB). With increasing distance to 16 meters the depth
of the FS shadow decreases by several dB (3-4 dB).
The experimental results show that the size, the depth
and the shape of the FS shadow could provide
information about the car velocity and the intensity of
the traffic. Using a predetermined multi-level
threshold can be defined the distance to the vehicle
from GPS receiver. It can be seen that the shape of the
FS shadow (the first peak) can be used to determine
the direction of the movement of the vehicle. In such
a way it can be realized a selection and classification
of vehicles.
The FS shadows obtained from 1 and 30 satellites
are shown in Fig. 21 and Fig. 22.
Figure 21: Integrated message from satellite 1
It can be seen that unlike the satellite 1, the signals
from the satellite 30 form the relative deep FS shadow
of passing cars. This shows that unlike the satellite 1,
the satellite 30 does not fulfill the conditions for the
occurrence of the FS effect.
Figure 22: Integrated message from satellite 30
0 5 10 15 20 25 30
0
2
4
6
8
10
12
14
16
Acquisition results
PRN number (no bar - SV is not in the acquisition list)
Acquisition Metric
Not acquired signals
Acquired signals
0 5 10 15 20 25 30 35 40
102
104
106
108
110
112
114
116
118
120
122
Integration time=200 ms
Time [s]
20log10(Ip) in dB
satellite 32
0 5 10 15 20 25 30 35 40
106
108
110
112
114
116
118
120
Integration time=200 ms
Time [s]
20log10(Ip) in dB
satellite-16
0 5 10 15 20 25 30 35 40
105
106
107
108
109
110
111
112
113
114
115
Integration time=200 ms
Time [s]
20log10(Ip) in dB
satellite 1
0 5 10 15 20 25 30 35 40
118
118.5
119
119.5
120
120.5
121
121.5
122
Integration time=200 ms
Time [s]
20log10(Ip) in dB
satellite 30
Moving Target FSR Shadow Detection Using GPS Signals
39
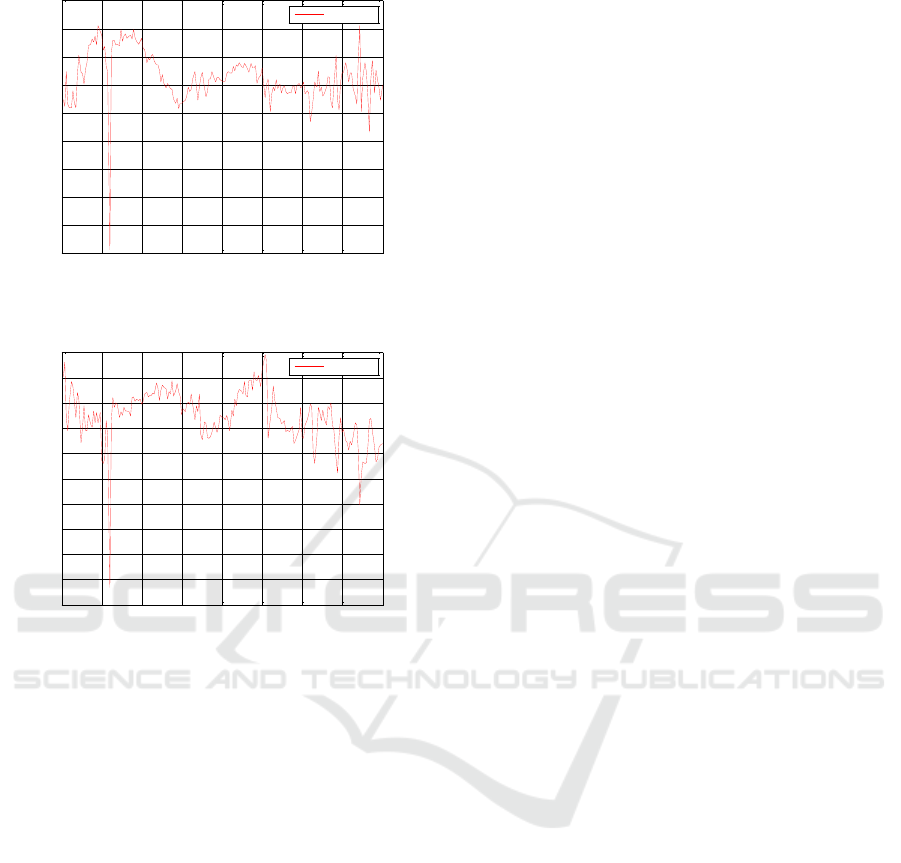
Figure 23: Integrated message from satellite 20
Figure 24: Integrated message from satellite 23
The integrated signals from satellites 20 and 23 are
shown on Fig. 23 and 24. This satellites are high
above the horizon ant the FS shadow is small. In this
case the majority of the energy of the transmitted
signal passes over the target and the signals from
these satellites cannot be used for detection of the FS
shadow created by cars.
5 CONCLUSIONS
Using a small commercial GPS antenna and GPS
receiver it is made a number of experiments with
moving and stationary objects and moving and
stationary receiver. Topology of the experiment
suggests the presence of the conditions of occurrence
of FS effect. This means that the satellite receiver and
a transmitter are located on the same line, which
crosses the object. Experiments have shown that
mobile and stationary object as well as mobile and
stationary GPS receiver can registrate the occurrence
of the FS radio shadow. Experiments have shown that
the FS shadow can provide information about the
parameters of the object (size, speed and direction of
movement, distance to the receiver), from the width,
shape and length of the received FS shadow.
The occurrence of FS shadow is essential physical
phenomena, which can be used to extract some useful
information about the objects that create it. The
information obtained can be used in various
applications like those in the classic radar, including
radio barriers, security, classification and
identification of moving and stationary objects.
ACKNOWLEDGEMENTS
This work is partly supported by the projects
DDVU02/50/2010, MU-FS_05/2007 and NIP-01-
2014.
REFERENCES
[1] Cherniakov M., (ed.), “Bistatic Radar: Principles
and Practice”, Wiley & Sons, 2007.
[2] Koch, V., R. Westphal, “New approach to a
multistatic passive radar sensor for air/space defense”,
IEEE AES Systems Magazine, pp. 24-32, November 1995.
[3] Suberviola I., I. Mayordome, J. Mendizabal,
“Experimental results of air target detection with GPS
forward scattering radar, 2012, In IEEE Geoscience and
Remote Sensing Letters, vol. 9, no. 1, pp.47-51 January
2012.
[4] Behar V., Chr. Kabakchiev, “Detectability of Air
Target Detection using Bistatic Radar Based on GPS L5
Signals”, Proc. IRS’2011, Leipzig, 2011, pp. 212-217.
[5] V. Behar, Chr. Kabakchiev, H. Rohling,” Air Target
Detection Using Navigation Receivers Based on GPS L5
Signals”, Proc. of ION GNSS’ 2011, Portland OR, 2011,
pp. 333-337.
[6] Kabakchiev C., I. Garvanov, V. Behar, H. Rohling,
“The Experimental Study of Possibility for Radar Target
Detection in FSR Using L1-Based Non-Cooperative
Transmitter”, Proc. of IRS’13, Dresden, Germany, 2013,
pp.625-630.
[7] Kabakchiev C., I. Garvanov, V. Behar, H. Rohling,
A. Lazarov, “The Experimental Study of Target FSR
Shadows Detection using GPS signals”, Proc. of the Third
International Symposium on Radio Systems and Space
Plasma, Sofia, Bulgaria, 2013, pp. 64-73.
[8] Borre K., D. Akos, N. Bertelsen, P. Rinder, S.
Jensen, “A Software-Defined GPS and Galileo Receiver:
Single-Frequency Approach”, Birkhäuser, Boston, MA,
2006.
0 5 10 15 20 25 30 35 40
115.5
116
116.5
117
117.5
118
118.5
119
119.5
120
Integration time=200 ms
Time [s]
20log10(Ip) in dB
satellite 20
0 5 10 15 20 25 30 35 40
109.5
110
110.5
111
111.5
112
112.5
113
113.5
114
114.5
Integration time=200 ms
Time [s]
20log10(Ip) in dB
satellite 23
Third International Conference on Telecommunications and Remote Sensing
40
