
Preliminary Comparison of Classifiers to Detect Spatio-spectral
Patterns of Epileptic Seizures via PARAFAC Decomposition
Marlis Ontivero-Ortega, Yalina García-Puente and Eduardo Martínez-Montes
Cuban Neuroscience Center, Havana, Cuba
1 OBJECTIVES
The automatic detection of epileptic seizures from
EEG recording is very important for clinical
diagnosis and monitoring and has become an issue
of major scientific and technological interest
(Orosco et al., 2013). In this work, we use the
spatio-spectral features extracted via multi-
dimensional Parallel Factor (PARAFAC) Analysis
of the EEG for seizure detection. This subject-
specific approach only requires extracting one
component that explains a seizure’s space-time-
frequency pattern. Then, a simple adaptive zero-
training technique (AZT) to classify the seizures,
with the additional advantages of being fast and
work online, is evaluated and compared with known
pattern recognition methodologies (LDA, SVM, k-
Means), according to its accuracy, sensitivity and
specificity on EEG recordings of two epileptic
paediatric patients.
2 METHODS
Two epileptic paediatric EEG data are used for
seizure detection. The first one (0.5h, 19 channels,
sampling frequency of 200Hz) corresponds to a
patient of the Center for Neurological Restoration, at
Havana (www.ciren.cu), while the second (4h, 23
channels, sampling frequency of 256Hz)
corresponds to patient chb01 of the epilepsy CHB-
MIT scalp EEG database, available online at
http://www.physionet.org/pn6/chbmit.
2.1 PARAFAC Model
The PARAFAC model is a multidimensional
generalization of the Principal Component Analysis,
with the advantage that the multilinear
decomposition is unique under very mild conditions,
without imposing orthogonality or statistical
independence among components (Miwakeichi et
al., 2004). In our case, the spectrograms of every
channel of an EEG segment are arranged into a 3D
array, indexed by time, frequency and electrodes
(spatial dimension). PARAFAC decomposes this
tensor into components, each with corresponding
temporal, spectral and spatial signatures
(Miwakeichi et al., 2004). The spatial and spectral
signatures obtained from PARAFAC analysis of a
pattern epileptic seizure, can be used for searching
these characteristics in new EEG segments. As the
epileptic activity can be explained by one or more
components, it is important to choose the component
better explaining the epileptic activity to be detected.
In this work, we explore the option of taking the first
component of PARAFAC “blindly”, which allows
for a faster and more automatic procedure. EEG
spectrograms and features (mean power ratio) were
found following the same procedure as in (Martínez-
Montes et al., 2013). This was done for the same
data sets using different segments’ length to test for
the effect of this practical parameter which defines
speed and computational load of the methodology.
Table 1 summarizes the data used.
Table 1: Number of seizure and non-seizure segments, for
different segments’ length.
Data Length = 2 s 4 s 6 s 10 s
1
Seiz/NonSeiz 30/957 19/475 14/315 11/187
Total 987 494 329 198
2
Seiz/NonSeiz 80/7120 42/3558 29/2371 19/1421
Total 7200 3600 2400 1440
2.2 Seizure Detection
LDA and SVM classifiers were used (10-fold cross-
validation) to detect seizures offline from the
features of all segments, using every seizure
segment as the pattern. In addition an ad-hoc binary
threshold (mean power ratio of 0.5) and k-means
clustering were used for comparison purposes. We
also introduce a simple adaptive zero-training
technique (AZT), based in the online classification
of each segment by computing the probability to
belong to two normal distributions that define the
Ontivero-Ortega M., García-Puente Y. and Martínez-Montes E..
Preliminary Comparison of Classifiers to Detect Spatio-spectral Patterns of Epileptic Seizures via PARAFAC Decomposition .
Copyright
c
2014 SCITEPRESS (Science and Technology Publications, Lda.)
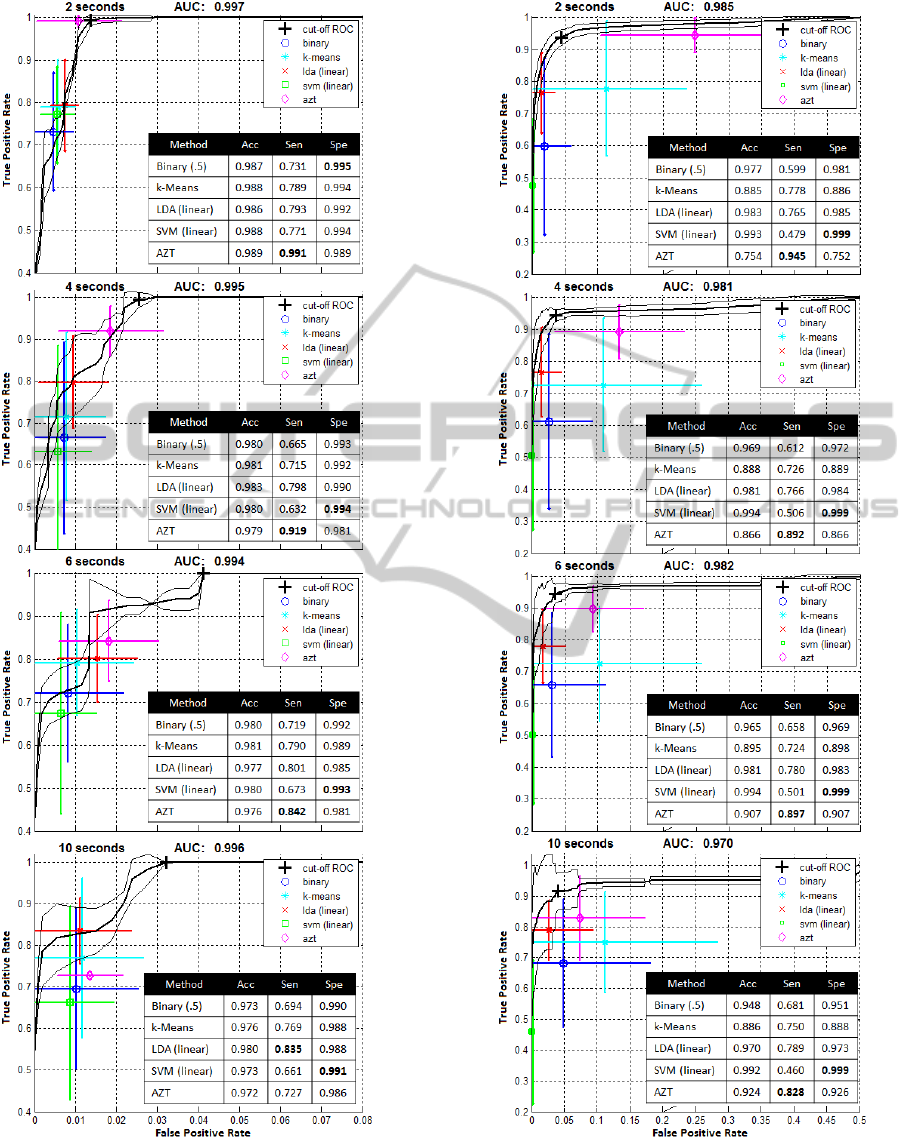
Figure 1: Data 1 - Mean (thick) and Standard deviation
(thin) ROC curves for the mean power ratio. For the 5
classifiers the Mean and false/true positive rate Std bars
for automatic thresholds are shown. The tables show the
average Mean accuracy, sensitivity and specificity.
Figure 2: Data 2 - Mean (thick) and Standard deviation
(thin) ROC curves for the mean power ratio. For the 5
classifiers the Mean and false/true positive rate Std bars
for automatic thresholds are shown. The tables show the
average Mean accuracy, sensitivity and specificity.

seizure and non-seizure classes. Initial means and
standard deviations are fixed to [1, 1] (seizure) and
[0, 0.5] (non-seizure), then they are iteratively
updated for an adaptive classification.
3 RESULTS
ROC curves (true positives vs. false positives), area
under the curve (AUC), automatic thresholds and
classification results (accuracy, sensitivity,
specificity in tables) are shown in figures 1 and 2. In
both figures, a region is plotted (zoom) for better
visualizing the behaviour of automatic thresholds.
The mean and standard deviation of ROCs
(across all segments used as the pattern) for
segment´s length of 2, 4, 6 and 10 seconds; together
with the optimal cut-off point (nearest point to (0,
1)) confirm the high potential of this feature for
detection purposes.
Table 2 shows a quantitative comparison of the
goodness of the automatic thresholds derived from
the classifiers, as measured by the Euclidean
distance between their sensitivity/specificity and
those of the best cut-off of the ROC for all seizure
patterns and different segments’ length.
Table 2: Mean ± Std of Euclidean distances between
optimal cut-off and automatic thresholds.
Method 2 s 4 s 6 s 10 s
Data 1
Binary 0.27±0.14 0.34±0.23 0.28±0.16 0.31±0.19
k-Means 0.21±0.11 0.29±0.20 0.21±0.12 0.23±0.19
LDA 0.21±0.11 0.20±0.11 0.20±0.10
0.17±0.08
SVM 0.23±0.11 0.37±0.25 0.33±0.23 0.34±0.23
AZT
0.02±0.01 0.08±0.06 0.16±0.09
0.27±0.01
Data 2
Binary 0.36±0.26 0.36±0.25 0.33±0.20 0.31±0.18
k-Means 0.28±0.11 0.33±0.10 0.33±0.07 0.30±0.08
LDA
0.19±0.12
0.20±0.13 0.11±0.11 0.18±0.08
SVM 0.48±0.20 0.45±0.23 0.46±0.21 0.48±0.23
AZT 0.22±0.22
0.16±0.07 0.11±0.05 0.16±0.11
4 DISCUSSION
The results illustrated in figures 1 and 2, show that
AZT outperforms the other algorithms in terms of
sensitivity (for small segments), while generally
offering the smallest specificity. This is an attractive
property for the clinical automatic scanning, when it
is more important not to miss a seizure, although
more false positives (FP) are introduced. While
LDA, k-Means and SVM give stable results for
different segments’ length, the AZT tended to have
lower sensitivity for longer segments. AZT also
showed smaller standard deviation for the true
positive (TP) rate than the other methods, and the
nearest pair of TP/FP to those defined by the optimal
cut-off of the ROCs in average (Table 1). This
means that the implicit thresholding in AZT offers a
better compromise of sensitivity and specificity.
One important limitation of the procedure
followed here is that blind one-component
PARAFAC decomposition may not always extract
the epileptic activity. We tested that when this step
was supervised to ensure using the correct
component as the spatio-spectral pattern, the
classification results with AZT improved in the
worst cases (Table 3). This procedure is much
slower and implies training the clinician in the
correct use of the PARAFAC model.
Table 3: Classification results for one 2-s long seizure
pattern of Data 2. A) Using blind one-component
PARAFAC. B) Using one PARAFAC component (out of
3) that best characterized the seizure.
Method
A) Sen Spe B) Sen Spe
Binary
0.963 0.898
1.000 0.362
k-Means 1.000 0.751 1.000 0.806
LDA (linear) 0.838 0.976 0.813 0.991
SVM (linear) 0.438 0.999 0.688 0.999
AZT 0.963 0.518
0.938 0.941
In summary, the uniqueness of the PARAFAC
decomposition ensures the subject-specific
characterization of seizures as well as the natural
cleaning of the data by screening only for the
activity of interest. The analysis exposed here
corresponds to a segment by segment detection with
just one pattern seizure, which can be done online
and with low computational burden. The feature
extracted via one-component blind PARAFAC is a
good descriptor of pattern seizure (AUC>.97) and
the proposed adaptive zero-training (AZT) online
classification technique is a promising method for
fast unsupervised seizure detection. Better results
can be expected with visual selection of the epileptic
component by a specialist. Finally, a more complete
validation of this methodology is necessary in a
larger epilepsy EEG database.
REFERENCES
Miwakeichi F, Martínez-Montes E et al. (2004)
Decomposing EEG data into Space-Time-Frequency
Components using Parallel Factor Analysis.
Neuroimage 22: 1035-1045.
Martínez-Montes, E., Márquez-Bocalandro, Y., et al.
(2013). EEG Pattern Recognition by Multidimensional

Space-Time-Frequency Analysis. In V Latin American
Congress on Biomedical Engineering CLAIB 2011
May 16-21, 2011, Habana, Cuba (pp. 1150-1153).
Orosco, L., Correa, A. G., and Laciar, E. (2013). Review:
A Survey of Performance and Techniques for
Automatic Epilepsy Detection. Journal of Medical and
Biological Engineering, 33(6), 526-537.
