
3D Echo and Invasive Pressure Synchronization
Generating Real Time, Multi Cycle Pressure Volume Loops
Dariusz Mroczek
1
, Kyong-Jin Lee
1
Juan Pablo Sandoval
1
, Helene Houle
2
,
Andreea Dragulescu, Lee Benson
1
and Rajiv R. Chaturvedi
1
1
Hospital for Sick Children, Toronto, Canada,
2
Siemens Medical Solutions USA, Inc., Ultrasound Division, Malvern, U.S.A.
1 BACKGROUND
The ventricular pressure-volume loop (PVL) relates
intracardiac pressure changes as a function of
volume changes during the cardiac cycle and is a
convenient method to understand major
determinants of myocardial performance. Acquiring
PVL is not simple in human models, the main
limitation being accurate volume measurement.
Traditionally PVL is obtained using conductance
catheterization which is based on the measurement
of the electrical conductivity of the blood volume by
placing a multiple electrode catheter along the long
axis of the ventricle (either right or left) during
catheterization and delivering an alternating current
between the most proximal and distal electrodes. -1-
Although conductance catheterization is considered
the gold standard for pressure volume relationship
acquisitions, this technology and equipment is
difficult to use and time consuming.
There has been considerable development in
three-dimensional echocardiography and more
recently display of cardiac structures in real time
rather than as offline reconstructed images from
multiple 2D echocardiographic slices. An important
clinical application of three-dimensional real-time
echocardiography (3D-RTE) includes delineation of
ventricular morphology and volume quantification -
2,3-
2 OBJECTIVES
Our objective was to explore the feasibility of using
3D-RTE together with cardiac catheterization to
determine ventricular function derived from PVL.
We established that success of our experiment
depends on several components and overall
reproducibility of our technique. Consequently we
identified signal synchronization (volume and
pressure), optimal sampling rate and the possibility
of multicycle acquisition as crucial requirements.
3 METHODS
3.1 Data Flow Diagram
3.2 Equipment
During cardiac catheterization ventricular volume
was attained by 3D RTE using the Siemens Acuson
SC2000 ultrasound system (Siemens Medical
Solutions USA Inc., Mountain View, CA) with a
4Z1c real-time volume imaging transducer (2.8
MHz). The SC2000 has a unique ability to produce
up to about 40 complete volumes per second in a
true real time acquisition mode. It is capable of
forming 64 parallel beams in real time and
processing of 160M voxels per second. Volume data
sets are free of multi-cycle averaging, regional
interpolation and “stitching” interference.
Ventricular pressure was obtained by a high
fidelity pressure cathether (Micro-Tip®, Millar,
Houston, Texas) which was advanced into the left or
right ventricle. Millar catheter frequency response is
greater than 10 kHz and the pressure signal was
acquired at 16 bit resolution by DT9804 (Data
Translation Inc) analog to digital converter.
All pressure, trigger and ECG signals were
recorded with Notocord hemodynamic software
(Notocord Systems, France, v 4.2).
Mroczek D., Lee K., Pablo Sandoval J., Houle H., Dragulescu A., Benson L. and R. Chaturvedi R..
3D Echo and Invasive Pressure Synchronization - Generating Real Time, Multi Cycle Pressure Volume Loops.
Copyright
c
2014 SCITEPRESS (Science and Technology Publications, Lda.)
3.3 Functional Integration and
Acquisition
Data was collected in children and adolescents with
congenital heart disease aged 0-18 years that
underwent cardiac catheterization for interventional
purposes. Different ventricular sizes and
morphologies were included.
Pressure and 3D volume data set acquisitions
were synchronized by common ECG source and
activated by foot-switch signal. In addition the
pressure signal was interfaced to the ultrasound
system and displayed in real time for reference.
Notocord software recorded real time pressure, ECG
and trigger spike that initiated the volume recording.
This trigger signal with the conjunction of ECG
established proper cardiac cycle and a reference
point (R wave) of the first collected volume. The
typical length of a complete volume data set was
between three to five cardiac cycles.
3.4 Post Processing and Data Plot
Ventricular volume quantification and analysis was
done offline using Siemens software with the
combination of automatic ventricular volume
detection and manual user correction (Figure 1). The
produced ventricular volume curve was exported to
a text file. Based on this extract, the number of
individual volumes per acquisition time defined
absolute sampling frequency for pressure signal
extraction. Furthermore, the pressure raw data from
the trigger marker combined with QRS and with the
same duration as a ventricle volume acquisition was
resampled and averaged using imaging volume
resolution (Figure 2). The produced pressure extract
had the same time resolution as the acquired 3D
ventricular volume. As a result, absolute values of
both tracings could be plotted on the same XY axis.
Figure 1.
Figure 2.
4 RESULTS
PVL generated with this technique had reasonable
resolution and demonstrated expected physiological
characteristics. The real time volume sampling rate
was sufficient to obtain accurate pressure-volume
relationships of systolic and diastolic cardiac
performance. Synchronisation between these
different physiological sources was proven to be
feasible and reproducible in different congenital
heart conditions and after cardiac interventions.
4.1 PVL Examples
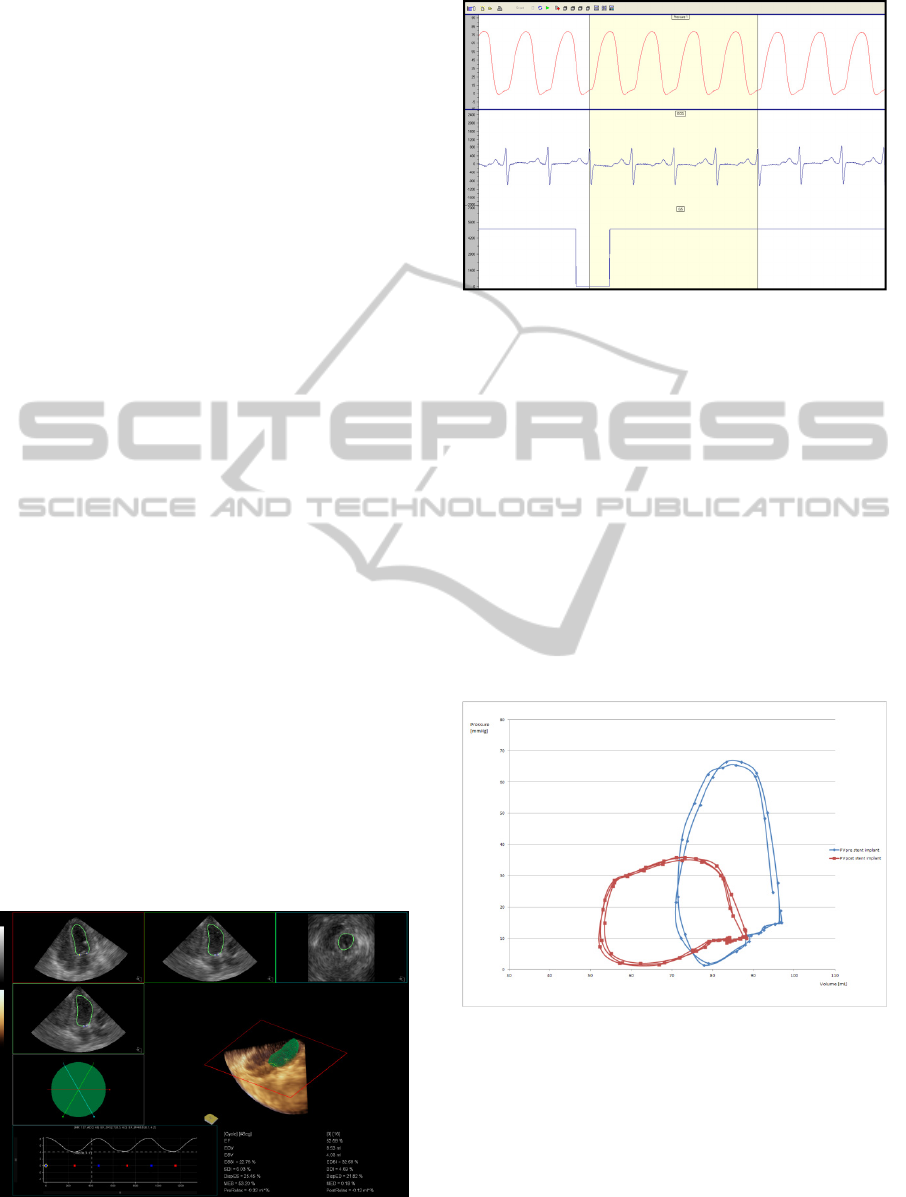
Figure 3: Right ventricle PVL after interventional
procedure (acute response).

Figure 4: PVL generated in a patient under varying
degrees of ventricular preload.
5 DISCUSSION
This described method is effective in acquiring PVL
and creates a platform for full integration and
synchronization of functional imaging and
hemodynamic data. It eliminates the use of costly
conductance catheters (a variety of them are usually
needed for full spectrum of ventricle sizes),
exposure to high frequency currents, flexibility of
ventricle volume selection and it does not rely on
complex volume calibration as is the case for
conductance systems.
Post-procedure analysis requires several steps
but can easily be integrated further and could
eventually become a built-in feature wherein
pressure-volume relationships could be calculated
instantaneously during a procedure.
The opportunity to synchronize 3D-RTE and
pressure data with a less invasive method such as
this one will allow clinicians to obtain valuable
insight of myocardial performance in a more simple
and accessible way. Furthermore, the pressure data
could potentially be used to gate volume acquisition
and immediately obtain the end-diastolic pressure
volume relationship (EDPVR) and end-systolic
pressure volume relationship (ESPVR).
It is acknowledged that development in integration
and automation is ongoing.
REFERENCES
Baan J, Van der Helde E, De Bruin H, Smeenk G, Koops
J, Van Dijk A, Temmerman D, Senden J, Buis B.
Continuous measurement of left ventricular volume in
animals and humans by conductance catheter.
Circulation 1984; 70:812-823
Lu X, Nadvoretskiy V, Klas B, Bu L, Stolpen A, Ayres
NA, Sahn DJ, Ge S. Measurement of volumetric flow
by real-time 3-dimensional doppler echocardiography
in children. J Am Soc Echocardiogr. 2007 Aug;
20(8):915-20.
Herberg U, Gatzweiller E, et al. Ventricular pressure-
volume loops obtained by 3D real-time
echocardiography and mini pressure wire-a feasibility
study. Clin Res Cardiol. 2013; 102:427-438.
