
Combining Empirical Mode Decomposition with Neural Networks
for the Prediction of Exchange Rates
J. Mouton
and A. J. Hoffman
School of Electrical, Electronic and Computer Engineering, North-West University, Potchefstroom, South Africa
Keywords: Empirical Mode Decomposition (EMD), Artificial Neural Network, Foreign Exchange Rate Forecasting.
Abstract: This paper proposes a neural network based model applied to empirical mode decomposition (EMD) filtered
data for multi-step-ahead prediction of exchange rates. EMD is used to decompose the returns of exchange
rates into intrinsic mode functions (IMFs) which are partially recomposed to produce a low-pass filtered
time series. This series is used to train a neural network for multi-step-ahead prediction. Out-of-sample tests
on EUR/USD and USD/JPY rates show superior performance compared to random walk and neural network
models that do not employ EMD filtering. The novel approach of using EMD as a filtering technique in
combination with neural networks consistently delivers higher returns on investment and demonstrates its
utility in multi-step-ahead prediction.
1 INTRODUCTION
The prediction of foreign exchange rates presents
several known challenges, the foremost being the
wide variety of behaviours that are observable at
many different time scales. The optimal choice of
time scale and forecast horizon for profitable trading
is a nontrivial matter, as the parameters at which the
signal shows the most predictable and exploitable
behaviour have to be found. A further challenge is
introduced by the inherent nonlinearity in the
relationship between past and future behaviour of
foreign exchange rates (Hsieh 1989; Pavlidis et al.
2012; Nusair 2013) .
Empirical Mode decomposition (EMD) is a
technique designed to decompose a signal into its
intrinsic modes (Huang et al. 1996), and has seen
wide usage in the area of financial analysis. What
makes EMD attractive in financial analysis is that it
is an empirically based technique that is a posteriori
and adaptive, allowing the data to speak for itself.
No a priori assumptions are required, as is the case
with traditional time-frequency techniques such as
Fourier or wavelet analyses. Time series analysis
traditionally seeks for a suitable model to fit the
data; this is complicated by the fact that the data is
typically non-stationary, with non-linear
relationships between past and future values and
behaviour occurring simultaneously at different time
scales. The time-frequency components obtained
from EMD can simplify this task by allowing one to
investigate the series for one intrinsic mode function
(IMF) at a time and over time horizons that are
optimal for the respective IMFs. While EMD is
traditionally used to analyse the individual modes of
a time series, usage of the technique as a filter has
also been identified (Huang et al. 2003; Flandrin
2004). An advantage of EMD-filtering is that the
data still retains its nonlinearity and non-stationarity,
which is not the case when using conventional
filtering techniques.
Artificial Neural Networks (ANN’s) are a
widely used machine learning technique that
simulates the structure of a biological neural
network. The structure of the neural network
consists of nodes distributed across input, hidden
and output layers, connected by weighted
connections and activation functions (Laurene
Fausett 1994). This structure gives neural networks
the built-in property to identify nonlinear
relationships between input and output variables,
making it ideal for application to nonlinear domains
such as financial prediction.
This paper proposes an ANN model applied to
data filtered with a novel EMD-filtering technique
for multi-step prediction of foreign exchange rates.
The purpose of the prediction will be to maximize
the returns of an investor by identifying the most
exploitable sampling period and forecast horizon
244
Mouton J. and Hoffman A..
Combining Empirical Mode Decomposition with Neural Networks for the Prediction of Exchange Rates.
DOI: 10.5220/0005130702440249
In Proceedings of the International Conference on Neural Computation Theory and Applications (NCTA-2014), pages 244-249
ISBN: 978-989-758-054-3
Copyright
c
2014 SCITEPRESS (Science and Technology Publications, Lda.)

using empirical methods. The training and input data
will be filtered to suit the forecast horizon with the
goal of improving the signal to noise ratio for the
appropriate time scale. The EMD-filtered ANN
model will be tested on out of sample exchange
rates, and will be compared with an ANN applied to
unfiltered data and a random walk model in terms of
accuracy of predictions and simulated returns on an
investment. The proposed model will give insight
into the ability of EMD-filters to improve
exploitable prediction accuracy by attempting to
increase the signal-to-noise ratio of the neural
network’s training data.
The rest of the paper is organized as follows: In
Section 2 a survey of the literature on EMD-based
machine learning is provided. Section 3 discusses
the methodology of the proposed model. Section 4
describes the data, pre-processing, performance
criteria and implementation of the proposed model.
The experimental results are also given and
discussed in Section 4. Section 5 concludes the
paper.
2 LITERATURE SURVEY
Machine learning techniques have been widely used
to forecast foreign exchange rates since the early
1990’s. For an overview of applications of machine
learning techniques to exchange rate prediction,
Imam’s survey article is recommended (Imam,
2012).
Our literature survey will focus on the use of
EMD in combination with machine learning in the
area of financial prediction. Huang et al. investigated
the use of EMD for analysis of non-stationary
financial time series (Huang et al., 2003). They
found that EMD with the Hilbert transform offered
better temporal and frequency resolutions than
Wavelet or Fourier analysis. The utility of EMD as a
filter to separate and extract variability on different
time scales was also noted. Wang examined the
predictive capability of an EMD-based Support
Vector Regression (SVR) model on the Shanghai
Securities Index. The EMD-based model performed
significantly better than the SVR model on its own
for both singe-step-ahead and multi-step-ahead
predictions (W. Wang et al., 2009). Several studies
focused on forecasting exchange rates using EMD-
based SVR models (Fu 2010; C. Lin et al., 2012;
Cheng and Wei 2014). For each case the EMD-
based model proved to have superior forecasting
accuracy compared to non-EMD-based or statistical
models. An EMD-based neural network was
designed in order to forecast financial crises using
exchange rate data (Yu et al., 2010). The EMD-
based model outperformed both statistical and neural
network models in correctly identifying crises. Yang
also used an EMD-based back propagation neural
network model to forecast the daily NTD/USD rate,
with the proposed model outperforming a random
walk model for all performance evaluation criteria
(Yang and H. Lin 2012). Two separate studies exist
on the application of EMD and neural networks in
order to forecast crude oil prices (Yu et al., 2008;
Xiong et al., 2013). Yu et al. noted superior accuracy
for one-step-ahead prediction, while Xiong found
that the EMD model also proved to be more accurate
for multi-step-ahead prediction.
3 METHODOLOGY
3.1 Empirical Mode Decomposition
EMD assumes that a signal is composed of a number
of intrinsic mode oscillations with distinct frequency
bands. These components, called Intrinsic Mode
Functions (IMFs), superimpose upon each other in
order to form the observable signal. An IMF is a
signal that satisfies the following two conditions:
1) For the whole data set the difference in the
number of extrema and zero crossings must be
less than or equal to one.
2) At any point, the mean value of the envelope
defined by the local maxima and the envelope
defined by the local minima must be zero.
The sifting procedure used to decompose a
signal
into IMFs can be described in terms of
the following steps:
1) Identify local extrema of x
t
2) Connect all local maxima using a cubic spline
interpolate to obtain the upper envelope x
t
and connect the local minima using a cubic
spline interpolate to obtain the lower envelope
x
t
3) Obtain the mean envelope:
/2 (1)
4) Extract the difference variable
(2)
5) Check whether
fulfils the above mentioned
IMF conditions. If the conditions are met then
is an IMF and
must be replaced with
the residual:
(3)
If the conditions are not met, replace
with
and repeat from step 1.
CombiningEmpiricalModeDecompositionwithNeuralNetworksforthePredictionofExchangeRates
245

6) Steps 1 through 5 are repeated until the residual
meets the stopping condition, SC:
(4)
where
is the j
th
iteration’s sifting result.
The sifting procedure described above
produces IMFs, each with a distinct frequency band.
This allows one to view the EMD technique as a
filter bank, where each IMF is the product of a band
pass filter that matches an inherent mode present in
the signal (Flandrin, 2004).
3.2 Artificial Neural Networks
This study will use a three layer feed-forward neural
network, which consists of the input, hidden and
output layers. The input layer receives historic
filtered exchange rate data. The hidden layer
consists of 10 nodes, and the output layer is a single
node for the predicted returns of exchange rate. The
network will be trained using the Levenberg-
Marquardt back-propagation algorithm. This
algorithms seeks to optimise performance based on
mean square error, and is accepted as one of the
fastest back-propagation training algorithms.
3.3 Proposed Model
The proposed EMD-filtered ANN model is
employed in order to do multi-step-ahead prediction
with the purpose of exploitable trading on exchange
rates. The procedure is shown in Figure 1 and
consists of the following steps:
Figure 1: The proposed EMD-filtered ANN model.
Empirical Mode Decomposition of the data will
decompose the time series into IMF’s. A low-pass
version of the signal is constructed by summation of
IMF
j
to IMF
n
and the residue, where IMF
j
is the IMF
with an oscillation period with at least half the
length of the forecast horizon. This filtered signal is
used to train the feed-forward neural network using
a Levenberg-Marquardt algorithm. The neural
network input data used for the out-of-sample
prediction will be filtered in similar fashion. The
predicted values will be compared to the actual
exchange rate values with the performance criteria
of root-mean-square-error, directional symmetry,
correlation and simulated returns generated by a
simple trading strategy.
4 EXPERIMENTAL RESULTS
4.1 Data and Pre-Processing
In order to evaluate the forecasting performance of
the proposed model, this study uses 30 minute
sampled EUR/USD and USD/JPY closing rates from
1 January 2013 to 31 December 2013. All the rates
are converted to normalised logarithmic returns,
which is the fraction by which the current sample
has changed compared to the previous sample, and is
given by:
ln
(5)
The data is divided into 12 months. The previous
month is used as the training set, with the
subsequent month used as the out of sample testing
set. This results in 11 training sets (January to
November) and 11 testing sets (February to
December), each with 1010 observations composed
of the 5 most recent available data samples. The
number of training observations was chosen to be at
least ten times the number of weighted connections
in the neural network, while the number of samples
to include per training observation was determined
using autocorrelation and mutual information
analyses. An average bid-ask spread for the period
was obtained from the Straighthold Investment
Group’s LiteForex server. The bid-ask spread is
used in the calculation of the simulated returns of the
predicted time series.
4.2 Performance Criteria
Following other research in the area of exchange
rate prediction (Tay and Cao 2001; Lu et al., 2009;
C. Lin et al., 2012), the following criteria are
evaluated in order to measure the performance of the
predictive model: root-mean-square-error (RMSE)
and directional symmetry (DS). Two further criteria
are used in order to measure the exploitable
NCTA2014-InternationalConferenceonNeuralComputationTheoryandApplications
246
predictability of the models. The first is the
percentage correlation between the actual and
predicted normalised returns (Corr). The second is
the simulated return percentage for the time period if
a trading strategy is implemented based on the
predictions. The simulation of the returns is
conducted in the following way, with an initial
balance of 100:
1) Check whether the next predicted sample is
expected to deliver a positive or negative return.
2) If the return is positive, take a long position. If
the return is negative, take a short position.
3) If the position in step 2 has changed from the
previous position, take into consideration the
bid-ask spread of the exchange rate.
4) If a long position has been taken in step 2,
calculate the returns for that step using the
actual returns and the current balance. If a short
position has been taken, the entire balance is
withdrawn from the security and is kept
unchanged, except for the bid-ask-spread where
applicable.
5) Repeat steps 1 through 5 with the updated
balance for the entire predicted series.
6) Calculate the percentage change between the
initial and final balance. This is the simulated
return for the time period.
The simulated returns (Ret) will give an
indication of the out-of-sample exploitability of the
model at the chosen sample rate and forecast
horizon. Finally, the t-statistics for the returns
generated by the prediction model are calculated
using a two sample t-test between the returns of the
models and the returns of the random walk.
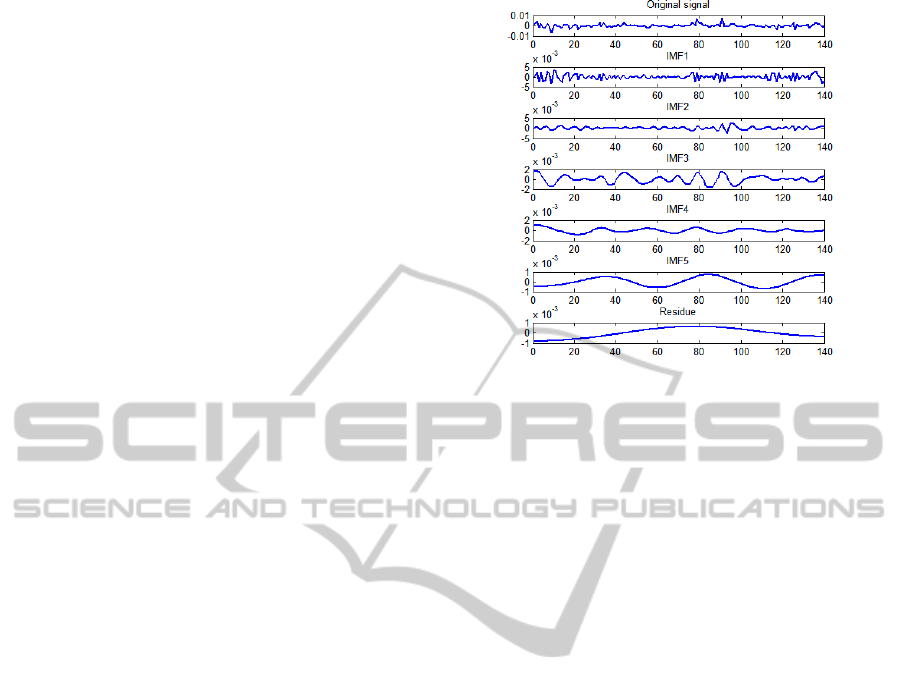
4.3 EMD Filter
The training and test input data must be filtered for
the EMD-filtered ANN model. Firstly the
normalised return time series is decomposed into
IMF’s using the EMD method described in Section
3.1. See Figure 2 for an example of a decomposed
segment of the normalised EUR/USD returns.
The EMD filter works on the principle of
recomposition of a subset of the IMFs. Each IMF
can be seen as a band-passed component of the
composite signal. For effective training of a neural
network for multi-step-ahead prediction, it is
necessary to design a Nyquist filter. This filter is a
low-pass filter that cuts off at an oscillation period
that is at least half the length of the forecast horizon.
The recomposition of the remaining IMFs in a
descending order will result in a low-passed filtered
version of the original signal, and is illustrated in
Figure 3.
Figure 2: EMD results for an extract of the normalised
EUR/USD returns.
4.4 Forecasting Results
The forecasting results of the proposed EMD-
filtered ANN model are compared to a random walk
and an unfiltered ANN model. The models are
compared based on the performance criteria of the
out of sample prediction of the EUR/USD and
USD/JPY exchange rates. Table 1 shows the
average monthly performance measurements that are
calculated by comparing the actual and the predicted
values of the EUR/USD exchange rate, while Table
2 shows the average monthly performance
measurements of the USD/JPY exchange rate. The
choice of forecast horizons stems from an analysis
of the frequencies found consistently in the IMFs at
the current sample rate.
4.5 Findings
After analysis of the experimental results, the
findings are as follows:
The EMD-filtered ANN model outperforms the
ANN and the random walk models in terms of
directional symmetry, correlation and simulated
returns for both exchange rates and all forecast
horizons.
The USD/JPY exchange rate offers higher
returns, which could indicate larger movements
or decreased market efficiency.
As the forecast horizon lengthens, some of the
exploitable price movements are lost due to less
frequent trading.
The t-test at a significance level of 0.05 rejects
the similarity in returns between the proposed
EMD-filtered ANN model and the random walk
model.
CombiningEmpiricalModeDecompositionwithNeuralNetworksforthePredictionofExchangeRates
247
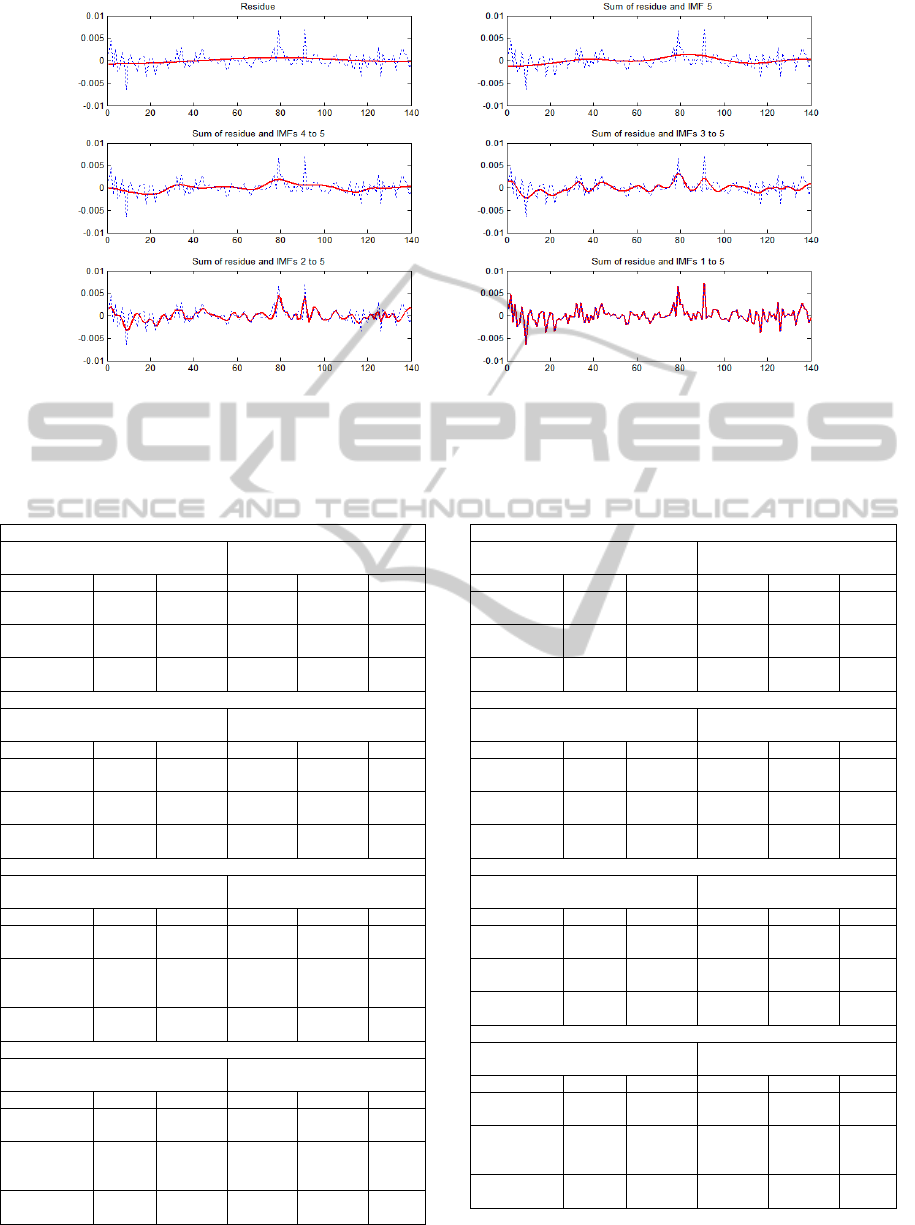
Figure 3: Recomposition of EUR/USD IMFs at different levels resulting in different low-pass filtered versions of the
original signal.
Table 1: Average monthly exchange rate forecasting
results of the EMD-filtered ANN, ANN and random walk
models for the 30 minute EUR/USD exchange rate.
1.5 Hour forecast horizon
Average maximum possible
monthly returns(%)
9.8971
Model RMSE DS(%) Corr Ret(%) t-value
EMD-filter
ANN
0.0012 63.93 0.3503 1.9046
6.385
8
ANN
0.0013 56.28 -0.0174 -1.7120
2.913
8
Random
Walk
0.0014 40.40 -0.0044 -3.7652 0
4.5 Hour forecast horizon
Average maximum possible
monthly returns(%)
6.6964
Model RMSE DS(%) Corr Ret(%) t-value
EMD-filter
ANN
0.0021 65.18 0.2611 1.3721
5.987
5
ANN
0.0021 54.95 0.0417 -0.6215
1.894
1
Random
Walk
0.0022 45.29 -0.0376 -1.8045 0
11 Hour forecast horizon
Average maximum possible
monthly returns(%)
4.9623
Model RMSE DS(%) Corr Ret(%) t-value
EMD-filter
ANN
0.0032 66.87 0.3618 1.5141
3.039
0
ANN
0.0034 48.48 -0.0913 -0.4948
-
0.721
8
Random
Walk
0.0033 49.29 -0.0129 -0.0403 0
20 Hour forecast horizon
Average maximum possible
monthly returns(%)
3.9599
Model RMSE DS(%) Corr Ret(%) t-value
EMD-filter
ANN
0.0045 65.53 0.4852 1.5795
2.350
5
ANN
0.0044 54.55 -0.0518 -0.2013
-
0.283
1
Random
Walk
0.0042 53.03 0.0504 0.0014 0
Table 2: Average monthly exchange rate forecasting
results of the EMD-filtered ANN, ANN and random walk
models for the 30 minute USD/JPY exchange rate.
1.5 Hour forecast horizon
Average maximum possible
monthly returns(%)
20.0362
Model RMSE DS(%) Corr Ret(%) t-value
EMD-filter
ANN
0.0017 64.52 0.3647 5.8295
6.717
9
ANN
0.0018 52.75 0.0261 -2.2571
0.785
1
Random
Walk
0.0021 40.42 -0.0180 -3.004 0
4.5 Hour forecast horizon
Average maximum possible
monthly returns(%)
12.4100
Model RMSE DS(%) Corr Ret(%) t-value
EMD-filter
ANN
0.0029 62.66 0.38110 3.7767
4.692
6
ANN
0.0031 51.54 0.0304 0.0199
1.042
8
Random
Walk
0.0032 45.70 -0.0090 -1.0180 0
11 Hour forecast horizon
Average maximum possible
monthly returns(%)
8.5538
Model RMSE DS(%) Corr Ret(%) t-value
EMD-filter
ANN
0.0044 64.44 0.4526 3.5785
4.157
7
ANN
0.0048 49.4949 -0.0334 1.2897
0.957
6
Random
Walk
0.0047 42.02 0.0107 0.3441 0
20 Hour forecast horizon
Average maximum possible
monthly returns(%)
6.9709
Model RMSE DS(%) Corr Ret(%) t-value
EMD-filter
ANN
0.0078 68.18 0.4193 3.4000
2.306
9
ANN
0.0068 51.5152 0.0133 0.1846
-
0.656
4
Random
Walk
0.0033 50.00 0.0566 0.6990 0
NCTA2014-InternationalConferenceonNeuralComputationTheoryandApplications
248

5 CONCLUSIONS
Forecasting non-linear financial time series has
received increased attention in recent years. This
paper proposed a novel EMD-filter in combination
with a neural network in order to forecast exchange
rates with the purpose of profitable trading. The
proposed model is compared to an unfiltered neural
network and a random walk model for out-of-sample
prediction of the EUR/USD and USD/JPY rates of
2013.
The proposed EMD-filtered neural network was
the best performing model based on the criteria of
directional symmetry, correlation and simulated
returns. This can be attributed to the EMD-filter’s
ability to increase the signal-to-noise ratio for the
applicable forecast horizon. The results are in
accordance with previous studies on EMD-based
prediction models where the use of EMD has
improved the prediction accuracy.
The two sample t-test rejects the similarity
between the returns generated by the proposed
EMD-filtered ANN model and the random walk
model at a significance level of 99% in all cases
except for 20 hour prediction horizons, where the
significance level if 95%. This is an indication that
the proposed model can consistently deliver higher
returns than a random walk at all the forecast
horizons for both exchange rates.
In conclusion, the out-of-sample test results
reveal that EMD-filtered ANN forecasting can be an
effective tool for investors in predicting exchange
rates.
REFERENCES
Cheng, C.-H. & Wei, L.-Y., 2014. A novel time-series
model based on empirical mode decomposition for
forecasting TAIEX. Economic Modelling, 36, pp.136-
141.
Flandrin, P., 2004. Empirical mode decomposition as a
filter bank. IEEE signal processing letters, 11(2),
pp.112-114.
Fu, C., 2010. Forecasting exchange rate with EMD-based
support vector regression. IEEE submissions, pp.0-3.
Hsieh, D., 1989. Testing for nonlinear dependence in daily
foreign exchange rates. Journal of Business, 62(3),
pp.339-368.
Huang, N.E. et al., 1996. The empirical mode
decomposition and the Hilbert spectrum for nonlinear
and non-stationary time series analysis. In
Proceedings of the Royal Society London. pp. 904-
993.
Huang, N.E. et al., 2003. Applications of Hilbert-Huang
transform to non-stationary financial time series
analysis. Applied Stochastic Models in Business and
Industry, 19(4), pp.361-361.
Imam, T., 2012. Intelligent Computing and Foreign
Exchange Rate Prediction : What We Know and We
Don ’ t. Progress in Intelligent Computing and
Applications, 1(1), pp.1-15.
Laurene Fausett, 1994. Fundamentals of Neural Networks
1st ed., Upper Saddle River: Prentice Hall.
Lin, C., Chiu, S.-hsiung & Lin, T., 2012. Empirical mode
decomposition–based least squares support vector
regression for foreign exchange rate forecasting.
Economic Modelling, 29(6), pp.2583-2590.
Lu, C.-J., Lee, T.-S. & Chiu, C.-C., 2009. Financial time
series forecasting using independent component
analysis and support vector regression. Decision
Support Systems, 47(2), pp.115-125.
Nusair, S.A., 2013. Real exchange rate dynamics in
transition economies: a nonlinear analysis.
International Journal of Finance and Economics,
18(March 2012), pp.188-204.
Pavlidis, E.G., Paya, I. & Peel, D.A., 2012. Forecast
Evaluation of Nonlinear Models : The Case of Long-
Span Real Exchange Rates. Journal of Forecasting,
595(September 2011), pp.580-595.
Tay, F. & Cao, L., 2001. Application of support vector
machines in financial time series forecasting. Omega,
29, pp.309-317.
Wang, W. et al., 2009. A Novel Hybrid Intelligent Model
for Financial Time Series Forecasting and Its
Application. 2009 International Conference on
Business Intelligence and Financial Engineering,
pp.279-282.
Xiong, T., Bao, Y. & Hu, Z., 2013. Beyond one-step-
ahead forecasting: Evaluation of alternative multi-
step-ahead forecasting models for crude oil prices.
Energy Economics, 40, pp.405-415.
Yang, H. & Lin, H., 2012. Combining Artificial
Intelligence with Non-linear Data Processing
Techniques for Forecasting Exchange Rate Time
Series. International Journal of Digital Content
Technology and its Applications
, 6(April), pp.276-284.
Yu, L., Wang, S. & Lai, K.K., 2008. Forecasting crude oil
price with an EMD-based neural network ensemble
learning paradigm. Energy Economics, 30(5),
pp.2623-2635.
Yu, L. et al., 2010. A multiscale neural network learning
paradigm for financial crisis forecasting.
Neurocomputing, 73(4-6), pp.716-725.
CombiningEmpiricalModeDecompositionwithNeuralNetworksforthePredictionofExchangeRates
249
