
The Dependence of Piezoresistivity of Elastomer/Nanostructured
Carbon Composites on Dynamic Mechanical Load Frequency
Artis Linarts, Imants Barons and Maris Knite
Institute of Technical Physics, Rigas Technical University, Paula Valdena 3, Riga, Latvia
Keywords: Dynamic Mechanical Loading, Piezoresistivity, Nanostructured Carbon Composites, Sensor Materials,
Piezoresistive Sensor.
Abstract: The aim of this article is to determine piezoresistive sensitivity of elastomer nanostructured carbon
composites at dynamic loading tests and show the piezoresistive effect correlations to various frequencies of
applied mechanical force in a manner that could provide a parameter of the highest detectible dynamic load
frequency. This parameter is crucial when determining sensor’s usability in possible applications. There are
only few articles on conductive polymer composite sensitivity in dynamic mechanical loading tests.With
this article we are trying to estimate the values of dynamic loading frequencies in which sensor would be
functional.
1 INTRODUCTION
Rapid detection of mechanical forces in tactile
sensing devices is very important for precise and
cautious automation. Electrically conductive
polymer composites (CPCs), being stretchable,
bendable, light weight, low cost, and soft, offer
several key advantages soft compared to their solid
state alternatives. Applications of CPCs are now
widely used in different research fields such as
stress/strain sensors (Knite et al., 2004), mechanical
damage self-monitoring materials (Nanni et al.,
2011), gas sensors (Knite et al., 2007), health control
(Sebastian et al., 2014), and tactile sensing skin for
human robotic application (Canavese et al., 2014).
If insulating polymer matrix is filled with
electrically conductive fillers like carbon nanotubes
(Wang and Cheng, 2014), carbon blacks (Zhou et
al., 2008; Wang et al., 2011; Knite et al., 2004;
Nanni et al., 2011; Aldraihem et al., 2009), metallic
particles (Jung et al., 2013), or hybrid fillers
(Zavickis et al., 2011) at concentrations just above
percolation transition also known as critical volume
fraction, piezoresistive effect in CPCs can be
observed (Zhou et al., 2008). Piezoresistive effect in
general describes the electrical conductivity
variation upon an influence of external force.
Conductivity of the piezoresistive CPCs can be
easily tuneable by changing the content of the
nanoparticles. However it should be noted that the
critical volume fraction as well as piezoresistive
sensitivity critically depends on the efficiency of
filler dispersion method used to produce these
composites (Zha et al., 2014). Piezoresistive CPCs
are starting to become one of the most widely
researched materials for possible sensor manufacture
because of simple and low cost preparation, simple
electronics and low power consumption (Stassi et
al., 2014). For example, tactile sensing skin for
human robotic application was made from nickel
particles and poly-dimethylsiloxane rubber. Particle
size was from 3.5 micrometers to 7 micrometers in
diameter. On particle surfaces were sharp spikes
ranging under hundred nanometers in height. Results
of this study revealed that this metal–polymer
composite is capable of sensing pressure
deformations with speeds from 2.5 up to 250 mm/s
(Canavese et al., 2014).
Structural health monitoring for observations of
other structural materials in buildings is another field
where CPC`s would be very helpful. These systems
were made from glass fibers with conductive carbon
tubes as spikes on their surface in the insulating
matrix of epoxy. Strain deformation experiments
revealed that these systems could sense different
types of deformation including longitudinal,
transverse and off-axis orientated (Sebastian et al.,
2014).
416
Linarts A., Barons I. and Knite M..
The Dependence of Piezoresistivity of Elastomer/Nanostructured Carbon Composites on Dynamic Mechanical Load Frequency.
DOI: 10.5220/0005121704160420
In Proceedings of the 11th International Conference on Informatics in Control, Automation and Robotics (ICINCO-2014), pages 416-420
ISBN: 978-989-758-039-0
Copyright
c
2014 SCITEPRESS (Science and Technology Publications, Lda.)

Conductive polymer composite with 10 parts by
weight carbon black embedded in a polyurethane
matrix was tested to confirm the usage of these
sensor materials for paint sensors. These sensors
could be applied to structures as paint and observe
structural stresses as well as noise levels in towns.
The experiments were conducted using compression
deformation with oscillation frequency under 100
Hz (Aldraihem et al., 2009).
In our Institute conductive polymer composites
are made from natural rubber as matrix and carbon
black is mostly used as the conductive filler. The
piezoresistive effect for this sensor material is stable
in temperatures from 20 to70 degrees Celsius. Knite
et al. have investigated polyisoprene nanostructured
carbon composites as sensor materials in quasistatic
loading tests where the loading happens once and
after it the relaxation is observed. Relaxation and its
velocity are strongly connected to dynamic loading,
so these studies were the base from which this
research was developed (Knite et al., 2004).
2 PREPARATION OF SAMPLES
AND THE EXPERIMENT
In our case CPCs were made by roll mixing of extra-
conductive carbon black (CB) Printex XE2 (specific
surface area 950 m2/g, average primary particle
diameter 30 nm, DBP absorption 380 ml/100 g)
together with natural raw rubber – polyisoprene (Pi)
and necessary vulcanization ingredients. Raw rubber
chemical composition expressed in parts per
hundred rubbers (p.h.r.) is shown in Table 1.
Table 1: Chemical composition of raw rubber composite.
Component Content, p.h.r.
Natural polyisoprene 100
Sulfur 3,5
Cyclohexyl-
benzothiazolesulfonamide
0,8
Zinc oxide 5
Stearic acid 1
Carbon black 8
The electrical conductivity of these composites is
highly dependent on the conductive filler
concentration and external influences like pressure,
tension, temperature. Since this CPCs has got a
positive piezoresistive effect (the electrical
resistivity increases on external influence) then
concentration of conductive filler should be slightly
over percolation threshold so that it would be easier
to monitor resistivity during testing. In this study to
achieve relatively low electrical resistivity we used
concentrations of 8 p.h.r. CB (further in text refered
to as PiCB8). To get an excellent electrical contact
for resistivity monitoring brass electrodes with
thickness of 0.05 millimetres where chemically
bound to both sides of the sample during
vulcanization. After curing, the samples were shelf
aged at room temperature for at least 24 hours before
any measurements were made.
Equipment for creating high frequency dynamic
loading was specially made for this research to study
the piezoresistivity of our sensor materials. Device
produces oscillating movements with frequency
from 3 to 45 Hz and the amplitude of movement
differentiates from 3 to 40 mm giving deformation
from 4.3 to 57.1% of samples length.
Device is electrically powered from the 220 V
AC grid. Rotation frequency of an electric motor is
controlled manually with a transformer that changes
electric voltage. The rotation frequency is monitored
using stroboscope. The electric motor has a gear at
the end of the shaft which is connected to an
eccentric part by timing belt. The eccentric part is
round and has a T-shape channel on its surface.
Through it a T-shape figure is moved to differentiate
the amplitude of the clamp movement. A connecting
rod is bolted to the T-shape figure which can be
fixated in different positions. The other end of the
connection rod is cylindrical and is gliding through a
pipe-like control channel, which turns the eccentric
movement in to linear movement. A clamp for
holding a sample is permanently connected to this
end of the connecting rod and is moving during the
experiment. The other clamp for holding the sample
is electrically insulated from all the other
components and stays static during the experiment.
Electrical resistivity is calculated from voltage
measured by an‘’HBM Spider8’’ data acquisition
system capable of 4,8 kHz reading frequency on 4
parallel channels which is connected to the sample
and a personal computer where data is stored.
Resistivity measurements where conducted with 1.2
kHz frequency. Data acquisition system is connected
to the sample as is shown in figure 1.
Figure 1: Circuit diagram for sample monitoring.
TheDependenceofPiezoresistivityofElastomer/NanostructuredCarbonCompositesonDynamicMechanicalLoad
Frequency
417
Two resistances– our sample and an etalon resistor
are in series with a nine volt voltage source which
produces the current for the circuit. Data acquisition
system ‘’Spider 8’’ is connected in parallel to the
etalon resistance to measure the voltage drop when
our sample is deformed. For more precise
measurements, the etalon resistance is almost
matched to the sensor’s resistance. Electrical
resistivity of the sample is at least one order higher
than the wire and contact resistances combined
therefore they are not taken in to account. The same
is true for the measuring equipment resistances.
Resistivity of the sample is calculated from the
formula:
ex
R
U
U
R
1
1
0
, (1)
where U
0
is the power source voltage and U
1
– the
voltage measured by Spider, R
x
is the resistance of
sensor sample and R
e
is the etalon resistance.
The piezoresistive effect at slow loading
frequency tests (0.005-0.1 Hz) was determined using
a Zwick/Roell Z2.5 universal material testing
machine coupled with an Agilent 34970A data
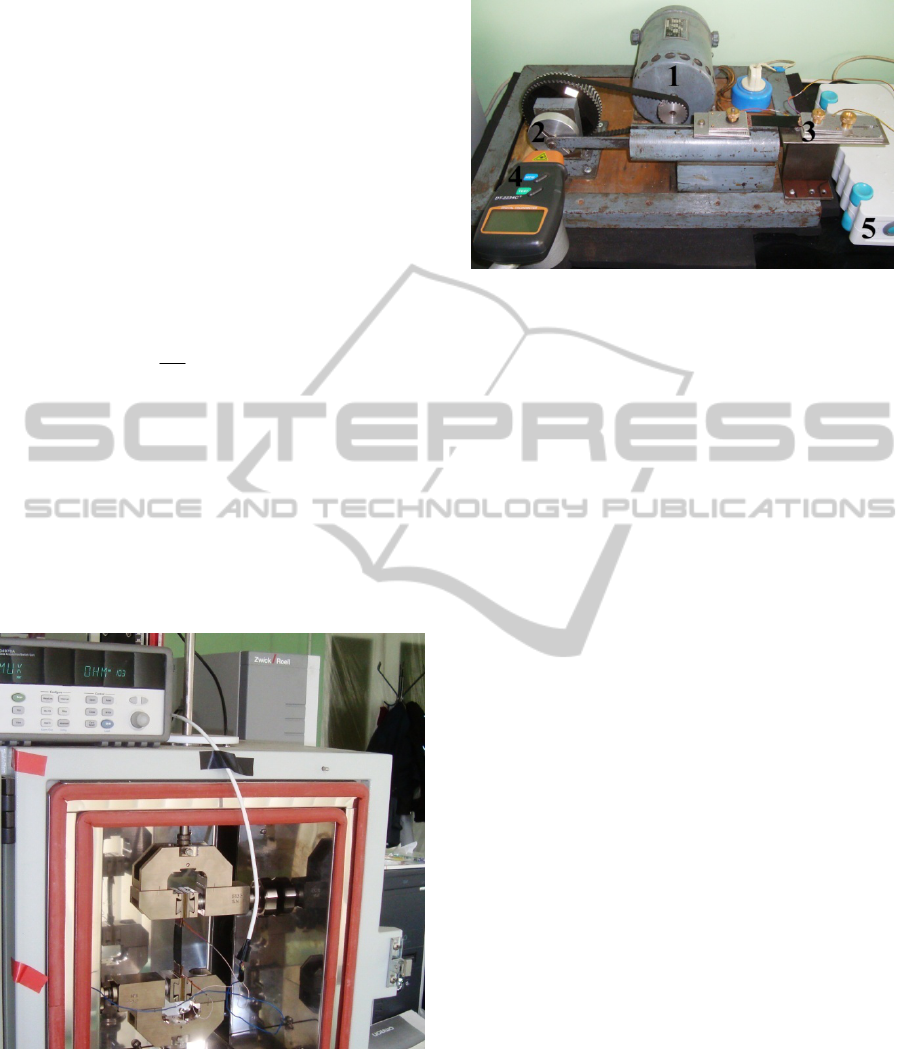
acquisition/switch unit. Images of the loading
equipment are shown in Figure 2.
Figure 2: Equipment used for dynamic mechanical loading
for low (top) and high (bottom) frequencies; where 1 –
electric motor; 2 – eccentric sheave; 3 – sample; 4 –
stroboscope; 5 – HBM spider 8.
Figure 2: Equipment used for dynamic mechanical loading
for low (top) and high (bottom) frequencies; where 1 –
electric motor; 2 – eccentric sheave; 3 – sample; 4 –
stroboscope; 5 – HBM spider 8. (cont.)
3 RESULTS AND DISCUSSION
Mechanical loading frequency influence on the CPC
piezoresistivity were conducted in room temperature
at 0 to 6.6%deformationfrom 0,005 to 45 Hz. For
deformation frequencies higher than 3 Hz the
desired loading frequency is manually set using the
transformer and the stroboscope. After at least 5
minutes of mechanical loading the change of sample
resistivity is measured in time.
The same was done for frequencies lower than 3
Hz, however in this case automated frequency
control was used. PiCB8 piezoresistive effect at
0.01, 3 and 40 Hz loading frequencies in 0 to 6.6%
deformation are shown in Figure 3.
The observed piezoresistive effect can be
explained by transverse slippage of nanoparticles in
the composite structure caused by external strain
leading to disarrangement of the conductive
channels. When the frequency is increased the
minimal and maximal resistivity values or resistance
at zero and 6.6 % deformation increases as well,
however the overall piezoresistivity tends to
decrease with increasing frequency as shown in
figure 4.
When the sample is deformed the average
distance between particles in the strain direction
increases leading to an increase in overall resistivity
of the sample, however at constant deformation in
time the polymer macromolecules reconfigure
(process known as strain relaxation) in strain
direction leading to a decrease of average layer
thickness between conductive particles and
subsequent increase of tunnelling current or decrease
of overall resistivity.
ICINCO2014-11thInternationalConferenceonInformaticsinControl,AutomationandRobotics
418
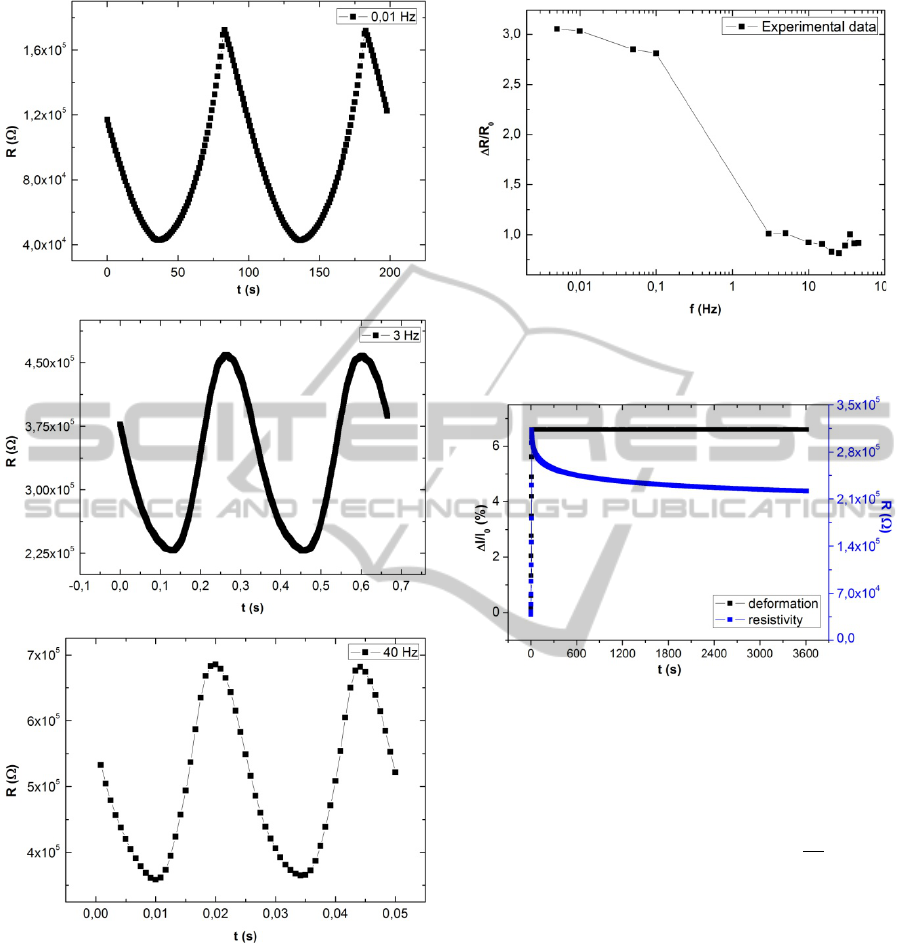
Figure 3: Change of resistivity in 0.01; 3 and 40 Hz
deformation frequencies.
To explain these results the relaxation of
sample’s resistivity at constant 6.6% strain
deformation was carried out in room temperature
(Figure 5). At constant deformation the decrease of
resistivity in time can be explained as fallows. The
3D conductive grid throughout the composite
structure is composed from carbon black particles
which mostly are separated by a thin layer of
polymer. The conductivity in this case is ensured by
tunnelling currents between particles.
Figure 4: The dependence of piezoresistive sensitivity
versus loading frequency.
Figure 5: Change of resistance in time at constant 6.6 %
strain deformation.
Luheng Wang et.al (14) described the change of
resistivity in time using a mathematical model
similar to stress relaxation in time:
∞
∑
∗exp
(2)
The exponents in equation (2) represent the
resistance relaxation times related to the movement
of the polymer composites constituent parts. We
found the best fitting of experimental curve using in
equation (2) three exponents i = 3 with three mean
relaxation times τ
1
= 1754, τ
2
= 197, and τ
3
= 22s
that could represent relaxation of carbon
nanoparticle aggregates, polymer chains, and chain
segments respectively.
Based on the additional investigation of
relaxation processes (Figures 5 and 6) and analysis
of the acquired values of relaxation time
1
,
2
, and
3
we explain the strain sensitivity ∆R/R
0
dependence on load frequency f as follows. At very
low tension load frequencies both the
macromolecular chain and the CB nanoparticle
TheDependenceofPiezoresistivityofElastomer/NanostructuredCarbonCompositesonDynamicMechanicalLoad
Frequency
419
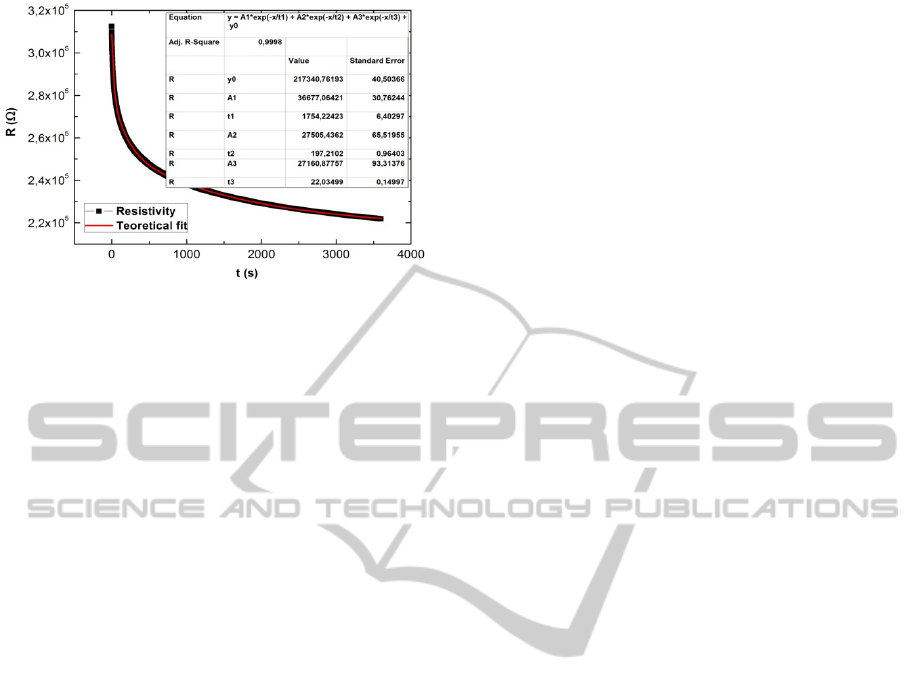
Figure 6: Fitting of experimental curve of change of
resistance in time at constant 6.6 % strain deformation
with equation (2) taking into account three mean
relaxation times:
1
= 1754,
2
= 197, and
3
= 22s.
aggregates have enough time to relax, therefore R
also relaxes with time when the mechanical loading
and the strain sensitivity is the highest. At higher
(>1Hz) frequencies CB aggregates have a difficulty
to follow the macromolecular chains during loading,
so the strain sensitivity decreases versus frequency.
4 CONCLUSIONS
It was shown that the polyisoprene high structure
carbon black composite samples can be used for
periodically changed mechanical load or mechanical
vibration testing. The maximal and minimal values
of resistivity increase with mechanical load
frequency while the piezoresistivity effect decreases.
These can be explained by analysing the
experimentally determined values of relaxation
times of carbon black aggregates and polymer
chains. The limiting factors for use of the developed
sensors at higher mechanical load frequencies are
the rise of maximal and minimal resistivity as well
as the decrease of piezoresistivity versus frequency.
ACKNOWLEDGEMENTS
This study was supported by ESF Grants Nr.
1DP/1.1.1.2.0/13/APIA/VIAA/021.
REFERENCES
Knite, M., Teteris, V., Kiploka, A., Kaupuzs, J.
2004.Polyisoprene-carbon black nanocomposites as
strain and pressure sensor materials, Sensors &
Actuators A: Physical, Volume 110, Issue 1-3, pp.
142-149
Nanni, F., Ruscito, G., Puglia, D., Terenzi, A.,Kenny,
J.M., Gusmano, G.2011.Effect of carbon black
nanoparticle intrinsic properties on the self-
monitoring performance of glass fibre reinforced
composite rods, Composites Science & Technology,
Volume 71, Issue 1, pp. 1-8
Knite, M., Klemenok, I., Shakale, G., Teteris, V., Zicans,
J. 2007.Polyisoprene carbon nano composites for
application in multifunctional sensors. Journal of
Alloys & Compounds, Volume 434-435, pp. 850-853
Sebastian, J., Schehl, N., Bouchard, M.Boehle, M., Li, L.,
Lagounov, A., Lafdi, K. 2014. Health monitoring of
structural composites with embedded carbon nanotube
coated glass fiber sensors. Carbon, Volume 66, pp.
191-200
Canavese, G., Stassi, S.,Fallauto, C.,Corbellini, S., Cauda,
V.,Camarchia, V., Pirola, M.,Pirri, C. F.
2014.Piezoresistive flexible composite for robotic
tactile applications. Sensors & Actuators A: Physical,
Volume 208, pp. 1-9
Wang, L., Cheng, L. 2014. Piezoresistive effect of carbon
nanotube silicone-matrix composite. Carbon, Volume
71, pp. 319-331
Zhou, J.F., Song, Y.H., Zheng, Q., Wu, Q., Zhang
M.Q.2008. Percolation transition and hydrostatic
piezoresistance for carbon black filled
poly(methylvinylsilioxane) vulcanizates. Carbon,
Volume 46, Issue 4, pp. 679-691
Wang, L., Ma, F., Shi, Q., Liu, H., Wang, X. 2011. Study
on compressive resistance creep and recovery of
flexible pressure sensitive material based on carbon
black filled silicone rubber composite. Sensors and
actuators, Volume 165, Issue 2, pp. 207-215
Aldraihem, O., Akl, W., Baz, A. 2009. Nanocomposite
functional paint sensor for vibration and noise
monitoring. Sensors & Actuators A: Physical, Volume
149, Issue 2, p233-240
Jung, J., Kim, M., Choi, J.K., Park, D.W., Shim, S.E.
2013.Piezoresistive effects of copper-filled
polydimethylsiloxane composites near critical
pressure. Polymer, Volume 54, pp. 7071-7079
Zavickis, J., Linarts, A., Knite, M. 2011. The downshift of
the electrical percolation threshold in polyisoprene–
nanostructured carbon composites. Energetika,
Volume 57, Issue 1, pp. 44-49
Zha, J. W., Li, W. K., Zhang, J., Shi, C. Y., Dang, Z. M.
2014. Influence of the second filler on the positive
piezoresistance behavior of carbon nanotubes/silicone
rubber composites. Materials Letters, Volume 118,
Issue 1, pp. 161-164
Stassi, S., Cauda, V., Canacese, G., Pirri, C.F. 2014.
Flexible tactile sensing based on piezoresistive
composites: A review. Sensors, Volume 14, pp.5296-
5332
Wang L., Ding T., Peng Wang P. 2008. Effects of
instantaneous compression pressure on electrical
resistance of carbon black filled silicone rubber
composite during compressive stress relaxation,
Composites Science & Technology, Volume 68,
pp.3448-3450
ICINCO2014-11thInternationalConferenceonInformaticsinControl,AutomationandRobotics
420
