
A Holistic Approach to Railway Engineering Design
using a Simulation Framework
Jesus Carretero, Carlos Gomez, Alberto Garcia and Felix Garcia-Carballeira
Computer Science and Engineering Department, University Carlos III of Madrid, Avda. Universidad 30,
Leganes, Madrid, Spain
Keywords:
Simulation Framework, Optimization, Expert’s Knowledge, Productivity.
Abstract:
Simulators have become frequently used tools in railway infrastructure design. However, most of them could
be improved by adding capabilities to increase their productivity. In this paper, we propose a simulation frame-
work in the field of railway infrastructure design, which allows to increase the productivity of simulators by
integrating as many aspects of the design process as possible. Also, we state that new generation simulators
should be capable of generating and evaluating new solutions by themselves. The framework follows a holistic
approach, focusing on four main issues: a) trade-off between accuracy and complexity; b) automatic gener-
ation and simulation of solutions; c) taking into account all parts in the design process (e.g. normative); and
d) integrating expert’s knowledge and optimization metrics. A case study is provided through a real-world
simulator of railway overhead air switches. The simulator is analyzed from the point of view of the proposed
framework, indicating how the different layers are fulfilled. Finally, the usability and productivity of the sim-
ulator is demonstrated performing an evaluation using different study cases. The evaluation shows how a high
number of scenarios are simulated, evaluated, and rated using optimization metrics, in order to find the best
solution of the problem’s search space.
1 INTRODUCTION
Simulators are excellent tools to face new engineering
problems, testing different prototypes to develop op-
timal designs in an easy and economic manner. Sim-
ulators have been widely used in railways since the
past century (Brunner et al., 1998; Goodman et al.,
1998), but they have traditionally adopted the role of
solvers, calculating the physical, chemical or mathe-
matical equations associated to a particular engineer-
ing problem (e.g. FEM, CFD, etc.), which usually are
set by the user.
We state that new generation simulators should be
capable of, starting from a range of possible parame-
ters, proposing and evaluating new designs, and that
they should consider all issues that can affect to the fi-
nal solution as part of its scope. Examples of such as-
pects are physical optimizations, normative,cost anal-
ysis, etc. We can resume this approach in four main
issues:
1. Trade-off between accuracy and complexity. The
simulator must evaluate a possible solution in the
lowest possible time. The results obtained must
be applicable to real world.
2. Automatic generation and simulation of possible
solutions. A simulator must be capable of propos-
ing and evaluating new solutions, exploring the
search space.
3. Other actors taking part in the design process (e.g.
legislation and normative) must be taken into ac-
count, to incorporate them into the simulator inso-
far as they influence the validity of the solutions.
4. Expert’s domain knowledge, useful to find the
best solutions, must be also integrated into the
simulator, as well as optimization metrics.
These issues have a great impact on the complex-
ity and usability of the simulators, and should be con-
sidered carefully.
In this paper we introduce a simulation frame-
work which takes into account all the aspects that
can influence in the design process of engineering
solutions. This framework proposes an holistic ap-
proach, in which simulators can propose and evalu-
ate solutions, needing little or no interaction by the
user. Since those aspects (apart from the simulator’s
physical domain) which can influence the final design
have been also taken into account, outcomes proceed-
71
Carretero J., Gomez C., Garcia A. and Garcia-Carballeira F..
A Holistic Approach to Railway Engineering Design using a Simulation Framework.
DOI: 10.5220/0005095400710082
In Proceedings of the 4th International Conference on Simulation and Modeling Methodologies, Technologies and Applications (SIMULTECH-2014),
pages 71-82
ISBN: 978-989-758-038-3
Copyright
c
2014 SCITEPRESS (Science and Technology Publications, Lda.)

ing from this framework are more suitable to be im-
plemented in the real world.
In order to provide a study case, we illustrate the
proposed framework through a real-world simulator
in the field of electric railways. We will analyze the
simulators characteristics, establishing a correspon-
dence to the different issues of the framework. The
aim of that simulator, presented in (Gomez et al.,
2012), is to design optimal configurations of over-
head line deployments on railway switches. Starting
from a set of parameters with regard to both infras-
tructure and train, the simulator generates different
deployments of the overhead infrastructure. For each
deployment, the simulator reproduces the pantograph
behaviour of the train running across the switch, tak-
ing into account pantograph and wire positions, cate-
nary geometry, tension of the wires, angles of attack,
and more. All these factors can influence the viability
of a solution, and thereby they must be considered.
Finally, the best deployment is selected, on the ba-
sis of several optimization metrics adopted from legal
normative and experts of the field. Therefore, more
than solving a particular set of equations, the simula-
tor takes into account the whole design process.
The paper is structured as follows: Section 2 de-
scribes the simulation framework proposed. Section
3 analyses in detail the railway overhead air switch
problem. Section 4 describes the architecture of the
simulator, and how it corresponds to the proposed
framework. Section 5 evaluates the simulator, indi-
cating times spent on each one of the framework is-
sues. Finally, conclusions, final remarks, and future
work are presented in Section 6.
2 SIMULATION FRAMEWORK
Railway infrastructures are considered critical sys-
tems, with requirements of efficiency, security and
safety, and hence they should be optimized. Nev-
ertheless, performing a high number of experiments
with real systems (tracks, locomotives, electric instal-
lations, etc.) is impracticable in terms of time and
money. The main goal of a simulator, in the field
of railway infrastructure design, is to simulate experi-
mental designs or prototypesto evaluate if they are ac-
ceptable or not, or to provide a degree of fitness. This
procedure is composed of several tasks: first, a candi-
date solution must be selected, either being provided
by the user, or being generated by the simulator itself.
Then, the simulation is performed and the results are
analysed. The candidate solution is scored, and a de-
cision to accept it or reject it is taken. This proce-
dure is repeated across multiple fields in this area. In
railway dynamics, rail-vehicle interaction is analysed,
aiming to get new designs of rails and bogies which
may reduce wear and breakdowns. In overhead con-
tact line designs, structural behaviour (Nejlaoui et al.,
2013) of poles and portal frames are evaluated, check-
ing their feasibility (Saa et al., 2012). In the field of
energy provisioning, a proposal of electric installation
locations may be simulated checking whether energy
is available to all planned trains (Abrahamsson et al.,
2013). (Hani et al., 2006) provides a simulation-based
optimization in order to provide the best building po-
sitions in a railway maintenance facility.
Although this general structure is present in most
railway infrastructure simulators, it may not be suf-
ficient to grant an acceptable degree of productivity,
and should be enhanced. A simulator in railway in-
frastructure design must not be restricted to evalu-
ate solutions provided by the user, but also it should
find acceptable solutions by itself, with a high degree
of fitness, and in a reasonable amount of time. To
achieve these targets we present a simulation frame-
work, which allows to increase the output of simu-
lators by covering more capabilities than the main
procedure described before. Our enhancements are
focused on four main issues below addressed. The
sources of this approach are: railway company ex-
perts, railway infrastructure design and planning pro-
cesses described in (Kiessling et al., 2009), and previ-
ous works in this area made by the authors (Carretero
et al., 2003) (Saa et al., 2012).
First of all, a trade-off between accuracy and com-
plexity is required when designing a simulator. Pro-
ductivity issues in railway industry require not to
waste so much time when evaluating a single solu-
tion, as the design process may require to evaluate a
lot of candidate solutions. There is a relationship be-
tween the accuracy of the model and the complexity
of the simulation. On the one hand, accurate mod-
els are usually hard to simulate, and require more and
more operations, so the more accurate is the model,
the more complex it is, and the more time is needed
to reach the solution. On the other hand, accurate
models are likely to reproduce real results. Optimal
balance between accuracy and simulation may be dif-
ferent in different design processes, but we state that
an efficient simulator should simulate and evaluate a
single candidate solution in the lowest possible time.
We state that an acceptable threshold to be productive
is to simulate and evaluate a candidate solution in less
than one hour.
In the second place, automatic generation and
simulation of solutions falls outside the scope of most
simulators. Therefore, the user must feed the simula-
tor providing new possible solutions, which leads to
SIMULTECH2014-4thInternationalConferenceonSimulationandModelingMethodologies,Technologiesand
Applications
72
!
"
#
$
%
&
'
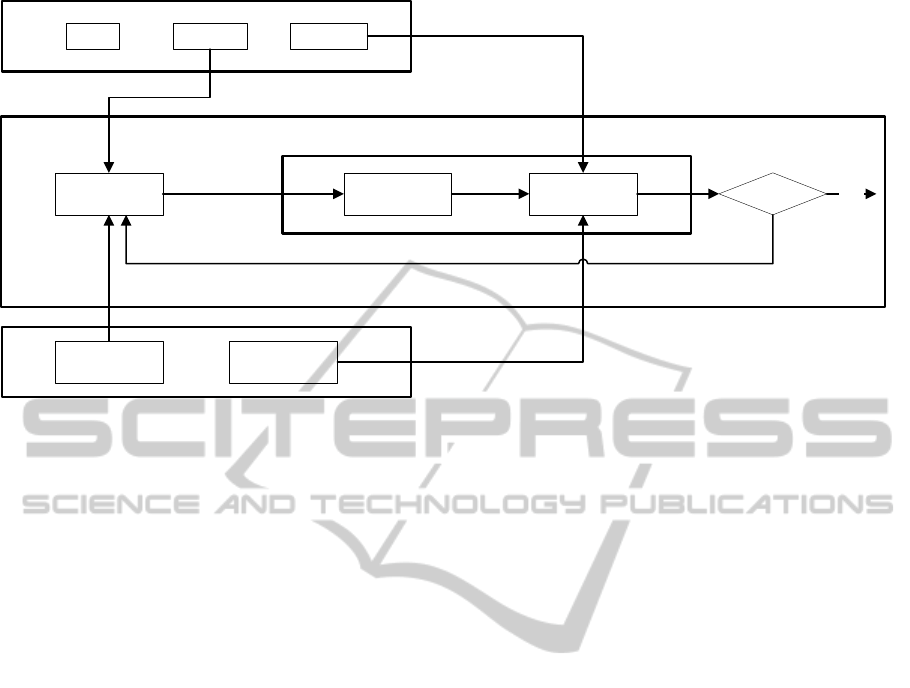
Figure 1: Simulation framework presented by the authors.
productivity losses. Moreover, the capacity of finding
good (maybe optimal) solutions is tied to the user and
her own ability to explore the problem’s search space.
We state that an efficient simulator should evaluate
and simulate a set of solution with a minimal user in-
volvement. To achieve that: a) the user should pro-
vide the simulation parameters as a set of possible
values (e.g. [minimum, maximum, increment]), and
the simulator uses them to generate candidate solu-
tions; b) the simulator should be able to generate new
solutions starting from an initial database (e.g. an in-
ventory or catalogue).
Thirdly, there are many stakeholders taking part in
the design process which usually fall out of the scope
of the simulation models. These parts can influence,
or even determine, the final acceptance of the candi-
date solutions (Naweed et al., 2013). For instance, the
set of possible solutions when looking for a valid de-
sign of a railway portal frame, can be limited by the
availability of constructive pieces in the company’s
inventory, and once found, a portal frame that stands
could not be in compliance with legal normative in
certain countries (BS-EN-50119, 2009). All issues
that have to be considered throughout the design pro-
cess, but fall out the scope of the simulation model,
should be also taken into account when simulators
generate and evaluate candidate solutions. This cat-
egory includes provider specifications, client require-
ments, technical security, and legal normative. Differ-
ent ways to include such restrictions out of the simu-
lation model are: a) restrictions to generate candidate
solutions: the simulator only generates candidate so-
lutions that fulfill with these initial restrictions; b) re-
strictions to evaluate a candidate solution, so that the
simulator evaluates these restrictions as well as any
others conditioned by the simulation model.
Finally, expert’s domain knowledge is a funda-
mental part in the engineering design process (Adeli,
2003). Expert’s knowledge defines as heuristics that
allow to speed up the search process and achieve the
best solutions in the problem’s search space. There-
fore it should be included as a part of the simula-
tion, particularly in those simulators that include au-
tomatic generation of candidate solutions (described
as the second issue). In a similar way to other par-
ticipants in the design process, expert’s knowledge
can be included when generating candidate solutions
in the form of decision rules. Those rules guide the
search process to generate better candidate solutions.
They can also be included to evaluate a candidate so-
lution in the form of optimization metrics, that can
be used to score the solution and to compare it with
others, thus choosing the best one.
The proposed framework is showed in Figure 1.
This figure is layered following the four issues previ-
ously mentioned. The core procedure of simulating
and evaluating candidate solutions composes layer 1.
Time invested in performing these two tasks must be
the lowest possible. Issue 2 is covered by the layer 2,
which contains the task of generating automatically
new solutions to be evaluated. This task could be fed
from other elements in layers 3 and 4 (e.g. require-
ments related to an inventory of constructive pieces,
or expert’s domain knowledge, applied to generate
better candidate solutions). Layer 3 is composed by
those restrictions that are not included in the simula-
tion procedure (layer 1), but that have an impact on
the solution. Those restrictions can be applied either
when generating or when evaluating a candidate so-
lution. Examples of such restrictions are availability
AHolisticApproachtoRailwayEngineeringDesignusingaSimulationFramework
73

of constructive pieces in company’s inventory when
proposing a design, or compliance with legal norma-
tive when evaluating the proposed design. Finally,
layer 4 represents the expert’s domain knowledge that
allows to obtain better solutions. Decision rules used
to generate better candidate solutions, or optimization
metrics used to choose the best one, are included in
this layer. This approach improves the efficiency of
the simulators by giving them the ability of searching
for the best solutions in the problem space. Obtained
solutions will be fully-integratedwith the different ac-
tors of the design process, and therefore they are more
suitable to be implemented in the real world.
3 CASE STUDY: OVERHEAD
LINE AIR SWITCHES
Overhead lines have become the way to provide en-
ergy to high speed trains. Apart from the significant
advantages over other mechanisms such as a third rail,
overhead lines are the only alternative when dealing
with high voltages (25.000 V) like those used in high
speed railways. Nevertheless, overhead lines require
to maintain the contact between pantograph and the
wire, in order not to break energy supply to the train.
This suppose an engineering challenge when the train
is moving along the main tracks (geometry, catenary
dynamics, wearing down, etc.).
When a train takes a switch in order to change to
other track, even more difficulties arise. The panto-
graph has to lose contact with the outgoing catenary
of the straight track, and make contact with the in-
coming catenary of the diverging track. On the one
hand, transition between overhead lines must be con-
ducted without losing contact with at least one of the
wires, in order not to interrupt power supply to the
train. On the other hand, the change must be per-
formed gently, in order to avoid excessive wearing or
breakdowns.
The task of designing an overhead line air
switches is a complex problem since several ele-
ments with different parameters must be considered.
(Kitchin and Holland, 1950) discusses the problems
to be faced by the designers of overhead equipment
for the electrification of railways. Some research
about the integration of catenaries and switches is pre-
sented in (Kiessling et al., 2009).
A standard catenary is composed of a messenger
wire holding a contact wire that supplies the elec-
tric power to the pantograph of the train. Both wires
are hung at a specific tension and are attached to
each other at regular intervals by drop wires. These
droppers are responsible for maintaining the contact
wire hung at a constant height with a slight deflec-
tion. Hence an uniform contact between the panto-
graph and the wire as the train travels along the track
is possible, thus avoiding any notches due to the pan-
tograph thrust force. In addition, contact wires must
be zigzagged slightly to the left and to the right of
track axis so that the pantograph wears evenly its fric-
tion surface. This stagger is a critical issue to be ana-
lyzed in the problem presented.
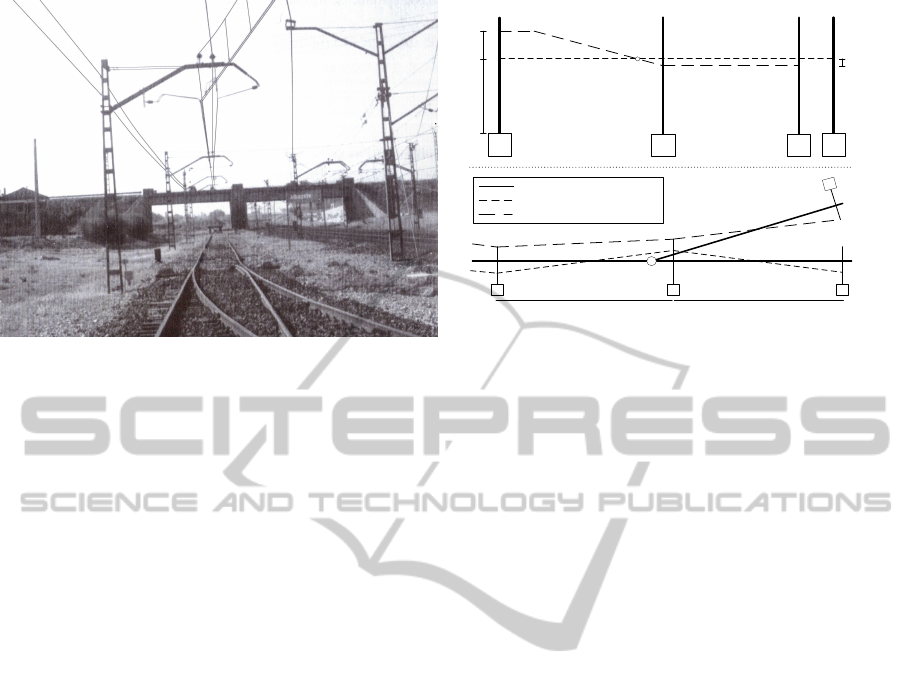
We focus on the critical study case of railway
switches, where a train travelling along the straight
track has to change to the diverging track. In this kind
of problem, two different catenaries are needed to
guarantee the electricity supply to both tracks, the left
side of the Figure 2 shows a real example of tangen-
tial overhead line air switches. Therefore, there will
be overlapped spans along the switch stretch length.
The right side of Figure 2 shows the configuration of a
overhead line air switch. As may be seen, the diverg-
ing track elevation span allows to lower the contact
wire height, so that the pantograph can progressively
change the rubbing wire while moving forward. The
beginning of this change takes place at a characteris-
tic pointCp where the heights of both elevation spans
match (see the right-up side of Figure 2). From this
point on, the pantograph will interact with the con-
tact wires of two different catenaries. Next, in the
switching span, both catenaries are gradually separat-
ing. This allows the pantograph to lose the contact
with the outgoing catenary and to get contact with the
incoming catenary.
The configuration of an overhead air switch poses
a set of restrictions to be ensured along the train tra-
jectory on the railway switch:
• When the train travels over the straight track, the
pantograph should only rub the contact wire of
this track. This avoids an excessive wear and tear
of the diverging track contact wire, that may result
in breakdowns and economical costs.
• Other possible flaw points to be analyzed, may oc-
cur when the train is travelling along the diverg-
ing track. Firstly, as the entire pantograph surface
is not suitable for making contact with the con-
tact wire, the pantograph should start rubbing it
over its central part, called friction surface. Sec-
ondly, the beginning of the rub should be smooth
and progressive. A hazardous breakdown of the
catenary or the pantograph may occur otherwise.
• Regardless of the track to be simulated, it is es-
sential that the pantograph is always rubbing one
of the contact wires, so that there is no electricity
notches affecting the train movement.
The number of combinations of catenary infras-
SIMULTECH2014-4thInternationalConferenceonSimulationandModelingMethodologies,Technologiesand
Applications
74
1 42
3
El (Elevation span)
Sl (Switching span)
Jp
Tracks
Straight track catenary
Diverging track catenary
s1
S1
s2
S2
S3
s3
junction
1 4
e
H
h
2
Cp
3
Figure 2: Photography of a real air switch and schemes (ground and elevation views).
tructure geometry for a single air switch may vary
between a few thousand and more than one million.
Each one of these combinations is a possible solution
of the design problem.
4 SIMULATOR ARCHITECTURE
This section describes the air switch simulator in
terms of the proposed framework described before.
The aim is to illustrate how a real-world simulator can
be adapted to the framework and the enhancement in
usability and productivity obtained through the adap-
tation. We start by describing the simulation model,
the core of the simulator in which one single scenario
is simulated and evaluated. Next, we analyse all lay-
ers of the framework and how they are reflected in the
simulator.
4.1 Simulation Model
The complete simulation model is described in
(Gomez et al., 2012), including all the equations
which determine output data. The model starts from
three main sets of input data which correspond to the
two key factors in an overhead line air switch: the
switch scheme and a candidate overhead line deploy-
ment, and the environmental conditions in which the
simulation is carried on:
• The switch scheme determines the trajectory of
the train across the rails, and therefore the posi-
tion of the pantograph on each instant. Based on
these data and trigonometry equations, the angle
at any point of the switch axis can be obtained,
thus allowing to simulate the pantograph position
when travelling along the switch.
• Overhead line deployment configuration deter-
mines characteristics of the contact wires across
the switch. It can be divided in two groups: cate-
nary geometry, which indicates the position of the
wires, and catenary installation features, which
defines catenary behaviour when the pantograph
makes contact with it.
– Catenary geometry contains the parameters re-
lated to the modelling of the ground plan and el-
evation of the catenary, i.e., its geometry. How-
ever, catenary geometry can support multiple
configurationsthat are allowed for the givende-
sign problem. For example, one solution may
be feasible whether the junction point is 90 or
120. These different configurations define the
multiple solutions for the design problem.
– Catenary installation features defines physical
characteristics of the catenary (stiffness, deflec-
tion, tension), which may affect the way the
pantograph makes contact with the wires. For
instance: a more rigid catenary is less sensitive
to displacements provoked by pantograph iner-
tia, but it is prone to breakdowns due to wear
and tear.
• Finally, a third set of input parameters is simu-
lation conditions data, which contains those en-
vironmental conditions apart from the rail switch
and catenary data (i.e. wind speed and direction,
trains speed, etc.).
With these data, the pantograph-catenary interac-
tion along the switch is simulated. Pantograph trajec-
tory across the switch is divided in simulation steps.
The simulator calculates the position of the panto-
graph referring to the contact wires on each step for
each simulation step of the scenario. Figure 3 illus-
trates all the stages followed by the simulator, that are
AHolisticApproachtoRailwayEngineeringDesignusingaSimulationFramework
75
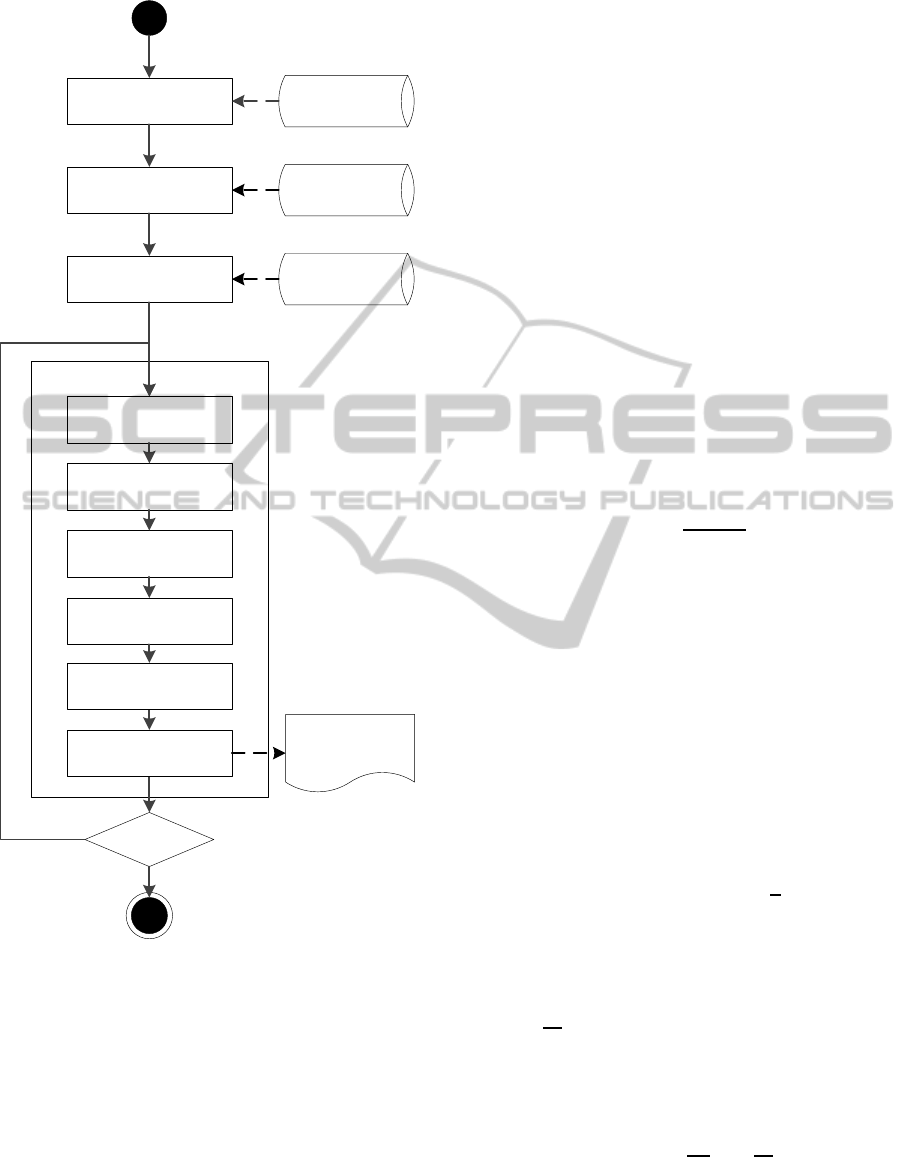
Figure 3: Simulation model and its stages.
stated below.
1. Compute pantograph position. First, pantograph
position k
i
is computed for each simulation step i
by increasing the former pantograph position in
the track with the pantograph displacement de-
fined (see Equation 1). For the first step, the initial
position is set to the position of the first pole of the
switch infrastructure k
0
.
k
i
= k
i−1
+ δ
j
(1)
2. Compute contact wires position. Second step is
computing contact wires position. This step is
in charge of calculating the position of the con-
tact wires accurately for the pantograph position
at this simulation step. Equation 2 is applied along
the span to compute the base wire height for that
point.
y
i
(k
i
) =
H k
i
< d
H − deflection(k
i
) d ≤ k
i
< l − d
H k
i
≥ l − d
(2)
where d is the distance from the beginning of the
span to the first dropper, and l is El or Sl, depend-
ing on whether the current span is the elevation
span or the switching span. Equation 3 is used to
compute wire deflection at each point, being D
max
the maximum deflection defined as an input pa-
rameter.
deflection(k
i
) =
(l − d) · (k
i
− d) − (k
i
− d)
2
·
4·
D
max
(l − d)
2
(3)
3. Apply environmental conditions. Depending on
the simulation conditions defined by the input pa-
rameters, wire stagger could be modified due to
several environmental aspects. Equation 4 is used
in our simulator to include the transversal wind
force. The equation computes the horizontal dis-
placement of the contact wire due to wind effects
in standard conditions (15 degrees and 600 meters
over the sea).
W
c
= Pv
ContWire
+ Pv
MesWire
(4)
where
Pv = q
k
·G
c
·dWire being q
k
=
1
2
G
q
·G
t
·ρWs
2
G
q
reflects the wind burst, with a value of 2.05, as
defined by the standard ENV 1991-2-4:1995 (see
page 42 in (BS-EN-50119, 2009)), G
t
is a terrain
factor, Ws is the wind speed, ρ is a factor equal to
1.225
kg
m
3
, and dWire is the diameter of the wire,
obtained from its section area A. Equation 5 is
applied to calculate wire contact horizontal dis-
placement:
w
i
(k
i
) =
W
c
T
·
k
2
i
2
(5)
where W
c
is the resulting wind force and T is
the tension due to the catenary. The result is a
quadratic curve, similar to the wire deflection.
SIMULTECH2014-4thInternationalConferenceonSimulationandModelingMethodologies,Technologiesand
Applications
76
4. Determine pantograph height. Once calculated
the contact wire positions, the pantograph height
must be computed for this simulation step as fol-
lows. Since there are two catenaries, for the main
and the diverging tracks, the pantograph height
will be the minimum height of the wires that are
within the projection of its friction surface, i.e.,
the rubbing contact wire will be the lower one. If
both wires are out of the friction surface projec-
tion, then the pantograph height will be consid-
ered as ∞ to indicate an error.
5. Modify contact wire elevation and angle. The fifth
step is modifying contact wire elevation and an-
gle due to the pantograph interaction. Some pa-
rameters needed, such as elasticity in the center
of the catenary spans and in the cantilevers, are
received as input parameters in the catenary in-
stallation features. Train speed Ts, must also be
considered. In order to know the elevation, the
pantograph pressure over the wires must be com-
puted, as shown in Equation 6 that follows ETI
regulation (ETI, 2008).
F
m
=
0.00097· Ts
2
+ 70 Ccs is A.C.
0.00097· Ts
2
+ 110 Ccs is D.C. 3.0 kV
0.00228· Ts
2
+ 90 Ccs is D.C. 1.5 kV
(6)
Next, the elasticity is computed for the catenary
point using Equation 7, where the denominator is
the stiffness at that point.
E(k
i
) =
1
K
0
1− αcos
2πk
i
l
(7)
where
K
0
=
K
max
+ K
min
2
and α =
K
max
− K
min
K
max
+ K
min
The elevation of the contact wire due to the pan-
tograph is obtained using Equation 8.
e(k
i
) = E(k
i
) · F
m
(8)
After determining the elevation produced by the
pantograph, the definitive contact wire height
must be computed as expressed in Equation 9.
y
i
(k
i
) = y
i
(k
i
) + e(k
i
) (9)
Thus, the contact wire position at a kilometric
point k
i
can be defined as the following tuple:
W p
i
(k
i
) = (st
i
(k
i
) + w
i
(k
i
),y
i
(k
i
)) (10)
55000
60000
65000
70000
75000
80000
85000
-2000
-1500
-1000
-500
0
500
1000
5200
5250
5300
5350
5400
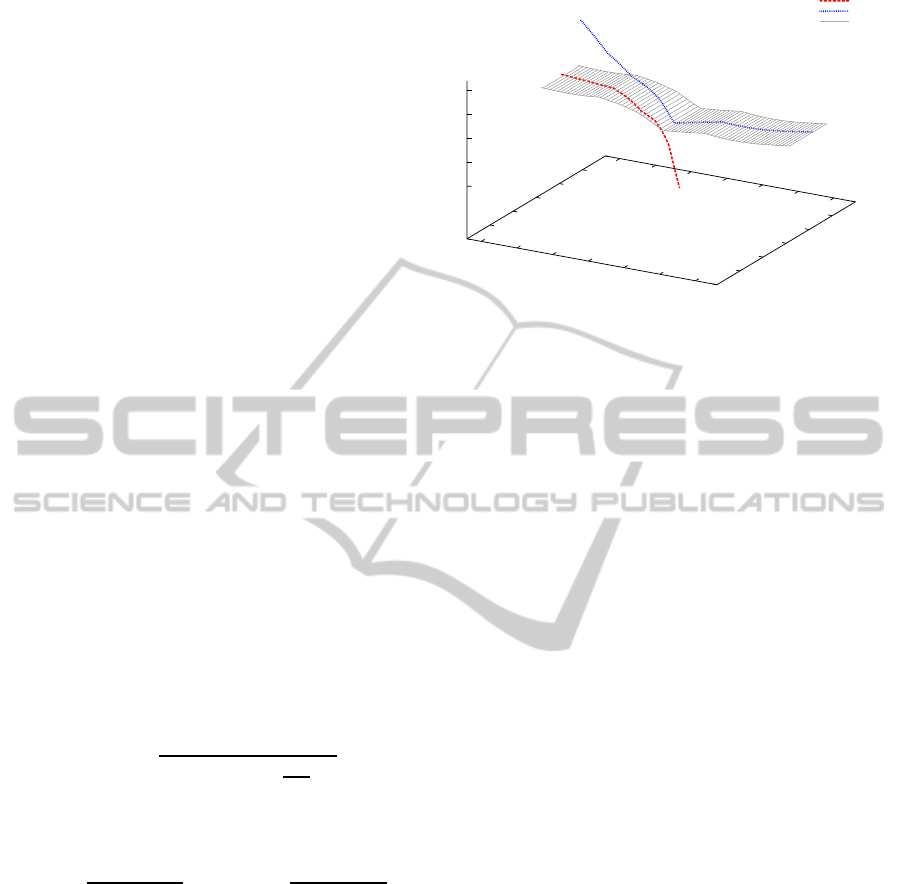
Straight track contact wire
Diverging track contact wire
Pantograph plane
Kilometric points (k
i
)
Stagger (st
i
)
Figure 4: Simulation graphic representation.
6. Write results. Last step is logging results to file.
Once computed all the significant parameters, the
target output data of the simulation step are writ-
ten to the simulation scenario log file.
The simulator provides the following output data:
• Kilometric point where an iteration of the simula-
tion algorithm has been executed.
• Output data of the catenaries belonging to the
straight track and the diverging track respectively,
including elevation, stagger, height, angle, etc.
• Switching distance at this simulation kilometric
point. It increases as moving forward along the
switch.
• Identification of what catenaries (straight, diverg-
ing, or both) are rubbed by the pantograph.
Having all these output data will allow to repro-
duce the simulation results a posteriori using a graph-
ical representation of the simulation. This represen-
tation shows relevant data displaying the pantograph
run, wire positions, alarms, etc., and can help to pro-
vide users relevant information. An example of this
representation is shown on Figure 4.
4.2 Evaluation Rules
Once simulated, a solution have to be evaluated in or-
der to decide a) if that solution is feasible, and b) if
that solution is a ”good” (maybe optimal) solution.
Evaluating a solution is carried out by a rules engine,
which applies a certain number of rules over the out-
put results obtained from the simulation. These rules
can be catalogued in different categories.
From domain specific restrictions (sine qua non
conditions), to different aspects involvedin the design
process beyond the simulation model scope, the rules
engine allows us either to mark a solution as valid
or not, or to score the solution indicating a degree of
AHolisticApproachtoRailwayEngineeringDesignusingaSimulationFramework
77

goodness. Domain specific restrictions, as part of the
simulation model, will be described now, while ad-
ditional rules coming from other actors in the design
process will be discussed on sections 4.5 and 4.6.
The following are domain restrictions inherent in
the simulation model. More than to normative, eco-
nomic aspects, or other parts, they are related to the
physical issues of the problem, such as maintaining
the power supply, avoiding breakdowns, etc.
1. The contact wires do not interact with the panto-
graph, so overhead line is not supplying the train
with energy.
2. The stagger of any of the wires interacting with
the pantograph is larger than a half of the panto-
graph friction surface. Usually pantographs are
designed to rub against the wire in a specific
strengthened zone, located at the middle of the
pantograph. In order to avoid breakdowns, con-
tact wires cannot make contact with the panto-
graph outside this zone.
3. Contact wires of straight and diverging tracks in-
tersect. Since different centenaries can be fed by
different power stations, accidental contacts be-
tween contact wires can produce short-circuits.
4.3 Layer 1: Trade-off between
Accuracy and Complexity
Time spent on simulating one single scenario is a crit-
ical issue with regard to simulator’s usability and pro-
ductivity. Furthermore, the more accurate a simula-
tion is, the longer the time required to carry on with it
will be. When simulating overhead air switches, step
size determines the detail level of the simulation. In
order to obtain results as real as possible, simulations
have to be carried out by millimetre-steps. By this
way, pantograph and wires output data are more ac-
curate. On the other hand, more steps imply more
computing resources, performing more calculations
in order to obtain a larger amount of output data.
For each simulation step, the processor has to
solve the equations shown before. Modern CPU
cores can perform millions of operations per seconds,
which implies no more than a millisecond spent on
solving simulation steps and writing output data to
files. The problem is that the largest railway switches
may have a length up to 1000 metres. This im-
plies that a scenario may require about one second
to be simulated (using steps of one millimetre). This
amount of time is acceptable when dealing with just
one single scenario, but when dealing with thousands
or millions of scenarios (see further sections) high-
performance techniques are necessary to run different
simulations concurrently, taking advantage of multi-
core or multi-processor systems.
4.4 Layer 2: Generation and Evaluation
of Possible Solutions
As previously mentioned, we state that an efficient
simulator should evaluate and simulate a set of solu-
tions with a minimal user involvement. New genera-
tion simulators should be capable of, starting from a
range of possible parameters, proposing and evaluat-
ing new designs. The proposed framework aims this
objectivethrough introducing a new component in the
simulator.
This component is a scenario generator, which
wraps the simulation model (simulation and evalua-
tion of one single scenario) generating different solu-
tions to be evaluated. This component generates new
scenarios through variations on the input data, thus al-
lowing experimentation with different simulation pa-
rameters, different components, or different domain
restrictions. Those scenarios are provided to the sim-
ulation engine, which carries on with the simulation
as described in the previous section.
Generating and evaluating multiple scenarios au-
tomatically allows the simulator to test different so-
lutions, thus providing a faster way of exploring the
solution space. Rather than obtaining one single so-
lution, by this way a set of feasible solutions is ob-
tained, and the user can select the best one. More-
over, as will be described in Section 4.6, enhancing
the simulator with optimization metrics or some ex-
perts knowledge brings the opportunity of performing
an automatic guided search of the solution space.
In order to cope with this issue, our simulator im-
plements a new module, accountable for generating
multiple scenarios. In order to do this, we change the
input data definition. With regard to the simulation
model, input parameters are transformed from scalar
values (e.g. train speed Ts = 220 km/h) to an inter-
val of test values defined by the user, who specifies
a maximum, a minimum, and a delta variation. Let P
an interval parameter,P = {P
j
/P
min
≤ P
j
≤ P
max
;P
j
=
P
min
+ j · ∆P; j ∈ N
∗
}. By this way we define a com-
plete set different values, and different simulations
each one using a differentvalue of this parameter have
to be performed.
Of course, introducing variations in several pa-
rameters at the same time increases the number of sce-
narios exponentially, since we have to perform com-
binations with elements of the two (or more) sets. An
advantage of this explosion is that the solution space
is rapidly explored, evaluating a huge number of solu-
tions from the problem space. As a drawback, a large
SIMULTECH2014-4thInternationalConferenceonSimulationandModelingMethodologies,Technologiesand
Applications
78

amount of computing power is required to perform a
large number of simulations, so the trade-off between
accuracy and complexity previously mentioned has
great significance. In this particular case, the number
of combinations of catenary configuration parameters
can reach over one million. Each one of these combi-
nations is a possible solution of the design problem.
In order to carry out the search efficiently, multiple
scenarios can be simulated concurrently, dispatching
simulation kernels performing different scenarios to
different CPUs. In Section 5, an illustrative example
will be shown, indicating input parameters variation,
number of scenarios generated, evaluated, and time
consumed in simulation.
4.5 Layer 3: Other Actors
The amount of scenarios outputted from the previous
layer would be unmanageable by the user if no more
filtering is applied apart from the physical domain re-
strictions. In order to increase the functionality and
productivity of the simulator, we have to take into
account the different stakeholders which take part in
the design process. Different determining factors may
fall into this category: legislation and normative, cost
limitations, provider or client restrictions, available
stock, and so on. There are two ways of consider-
ing such participants. The first is enhancing the set of
evaluation rules, checking not only physical domain
restrictions, but also specific restrictions from differ-
ent sources. The second is restricting values of the
input parameters, limiting the generation of new sce-
narios to only those which may comply with those
restrictions.
Our simulator may take into account different nor-
mative currently in force. So additional evaluation
rules have been implemented in order to check if a
solution is feasible or not, counting:
• Normative EN-50119 (BS-EN-50119, 2009).
This normative stipulates different restrictions
with regard to overhead line deployment (mini-
mum and maximum height, droppers configura-
tion, etc.). Moreover, it stipulates different restric-
tions about the way the pantograph makes contact
with the wires.
• Normative EN-15273 (BS-EN-15273, 2009).
This normative stipulates maximum width and
headroomin railway lines, stating that certain area
around the rails have to be free of obstacles. This
restriction has effect in the way the overhead lines
are deployed.
4.6 Layer 4: Expert’s Knowledge
Even if additional restrictions from other actors are
considered to filter the number of feasible solutions,
the resulting set might be too large to be useful. Be-
sides, the user doesn’t know what solutions are better
than the others. Expert’s knowledge can be applied
in order to discriminate, from the set of feasible solu-
tions, what are the best ones. In order to do this, first
of all we have to declare what optimization metrics
are going to be followed, i.e. the criteria that deter-
mines if a solution is better than other. Then, that cri-
teria can be applied by two ways: the first is enhanc-
ing the set of evaluation rules with a new set of rules
which don’t check the feasibility of the solution, but
score the solution following the proposed criteria; the
second is modifying again the generation of new sce-
narios trying to seek those scenarios that best fit with
the proposed criteria, in the same way as MOEAs
(MultiObjective Evolutionary Algorithm) try to reach
the optimal solution. The first approach may lead to
an exhaustive search in the solutions space, but as
drawback, all solutions must be simulated. The sec-
ond approach saves time by driving a guided search,
but a number of solutions can remain ”untested”.
With regard to our overhead air switch simulator,
several optimization metrics have been chosen. The
issue of getting such a solution for the overhead air
switch design problem is not defined by any regula-
tion, i.e., it is still an open research topic. We have
closely cooperated with railway experts to define the
metrics to be used, thus including that knowledge
within the simulator. Some example rules are shown
below:
1. Maximizing the average distance between contact
wires of straight and diverging tracks. It forces the
wires to be as far apart as possible. This will avoid
potential problems due to high electrical voltages
flowing through the wires.
2. Minimizing the variance of stagger of the diverg-
ing track contact wire. This metric is intended to
avoid too many sudden changes of position of the
contact wire on the pantograph.
3. Minimizing the average symmetry between con-
tact wires of straight and diverging tracks. It mea-
sures the difference between the stagger of both
contact wires, which are sought to be as symmet-
rical as possible to the axis of the pantograph,
thus avoiding a pantograph tilt towards one of the
sides.
4. Minimizing the input angle of the diverging track
contact wire in the pantograph along the transi-
tions STI-BTI. This angle is intended to be as low
AHolisticApproachtoRailwayEngineeringDesignusingaSimulationFramework
79
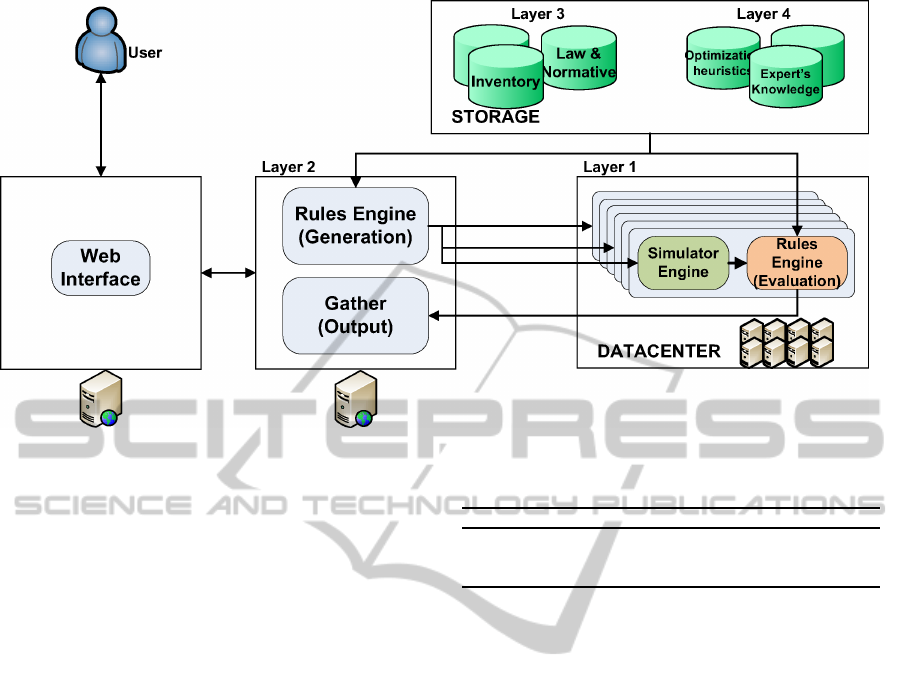
Figure 5: Simulation architecture following the proposed framework.
as possible, thus avoiding a sharp blow on the pan-
tograph. By smoothing the entry of the contact
wire in the pantograph, damages and premature
wear of the wire can be decreased.
5. Minimizing the output angle of the straight track
contact wire out of the pantograph along the tran-
sitions BTI-DTI. This angle is desired to be as
low as possible, thus avoiding a sharp blow on the
pantograph. This metric is particularly important
when simulating a train the other way around, i.e.,
from the diverging track to the straight track.
6. Minimizing the average of stagger of the diverg-
ing track contact wire. This metric ensures that
the diverging track contact wire is as focused as
possible to the axis of the pantograph, thus avoid-
ing the approximation of the thread to the edges of
the pantograph and ensures that the contact wire is
always going to enter a valid area.
The first metric is maximized, butthe overallfunc-
tion, that includes all the metrics, must be minimized.
To resolve this conflict, we change the sign of the first
metric value so as to normalize the result. In order to
compute the overall function, we use a specific weight
to confer greater or lesser importance on each metric.
At the end, the optimal scenario is the one that mini-
mizes the overall function value. Since there are met-
rics inversely correlated, it is impossible to find a sce-
nario having the best value per metric, being possible
to have a scenario better in some metrics and worse
in other ones. According to this fact, the framework
finds best scenarios considering an overall function of
all metrics, following a Pareto frontier.
Figure 5 describes the global architecture of the
Table 1: Parameters of the study cases.
Study case Radius Max. speed Type
1 250 m 20 km/h Former installations
2 500 m 60 km/h Non high-speed
3 1500 m 100 km/h High-speed
simulator, adapted to the proposed framework. The
simulation model is composed of the simulation and
evaluation components. A generation engine pro-
duces different scenarios to be tested, dispatching
simulations concurrently to any CPU available. Data
proceeding from other actors and expert knowledge
feed both generation and evaluation engines, in order
to reduce the amount of generated scenarios, filter the
number of feasible scenarios, and calculate the degree
of goodness in order to obtain the best ones.
5 EVALUATION
In this section we perform an evaluation of the over-
head air switch simulator using three different study
cases. A brief description of that study cases is pre-
sented in Table 1.
We have selected three types of switches, depend-
ing on the maximum allowed speed of trains run-
ning along the switch. The first study case is a small
switch with a short radius (the shorter the radius is, the
slower the train has to run along the switch). These
switches are used in old stations, legacy of former
installation. Due to its closed curve, these switches
should be crossed at low speed. The second study
case is a regular switch used in modern non-high
SIMULTECH2014-4thInternationalConferenceonSimulationandModelingMethodologies,Technologiesand
Applications
80

Table 2: Computing time and number of solutions generated and simulated.
Case Mode Scenarios generated Scenarios discarded Final set Generation time (s) Simulation time (s) Evaluation time (s)
1
Parallel
55440 54944 5 6
243
2
Sequential 1067
2
Parallel
81900 81750 5 8
960
10
Sequential 3548
3
Parallel
126000 125700 5 12
1789
24
Sequential 6510
speed tracks. Finally, the third study case is a high
speed switch.
Once all the study cases have been presented, we
analyse the results from two different points of view:
a performance analysis in terms of computational ef-
ficiency, and an analysis of the adaptation between
the proposed framework and the described simulator.
All the experiments have been carried out in a Linux
workstation with an Intel Core i5 760 2800 MHz, 4
CPU cores, and 16GB of RAM. We have used a MPI
version of the simulator dispatching one MPI process
per core.
Table 2 shows the workload distribution across the
different stages of the framework. It also indicates
the number of scenarios generated, evaluated, and dis-
carded. Following the proposed framework, most of
the computing time is spent on simulating and to a
lesser extent evaluating solutions. The remainder of
the computing time is spent on generating all the sce-
narios. In order to analyse the performance we have
calculated the speed-up, which shows the time im-
provement provided by concurrent simulation of sce-
narios when using a multi-core computer. The aver-
age speed-up calculated among all the study cases is
3.90. It can be seen that the parallel execution out-
performs sequential execution. This is because, as we
state on Figure 5, the simulator allows to dispatch sce-
narios to different cores of the CPU, carrying on sim-
ulation and evaluation stages concurrently. Provided
that all study cases have been test in a four-core CPU,
the calculated speed-up value is nearly the theoreti-
cal one (4). This implies the absence of bottlenecks
and a high degree of scalability with regard to to the
number of scenarios simulated. Only the generation
stage is not carried out concurrently, which represents
the remaining 0.1 between calculated and theoretical
speed-ups.
After analysing the performance, we focus on the
adaptation to the proposed framework. The character-
istic points are marked below:
• Generation of different scenarios by combining
the interval parameters is implemented as a rules
engine within layer 2.
• Normative EN-50119 and EN-15273 are imple-
mented as evaluation rules in layer 3, along with
physical domain restrictions described in Section
4.2. All are applied in the evaluation step.
• A high number of solutions are generated by vari-
ation of input parameters in all study cases. Nev-
ertheless, most of them are discarded by physical
criteria or normative. The final set of feasible so-
lutions is ordered through applying optimization
metrics defined in Section 4.6, leaving the user to
analyse only 5 scenarios out of the thousands that
compose the problem space.
6 CONCLUSIONS
In this paper, we have presented a simulation frame-
work with the aim of enhancing functionality and pro-
ductivity of simulators in the field of railway infras-
tructure design. This approach is focused on four
main issues: trade-off between accuracy and com-
plexity, automatic generation and simulation of pos-
sible solutions, taking into account other participants
in the design process, and integrate expert’s domain
knowledge and optimization metrics. This structure
improves the efficiency of the simulators by giving
them the ability of searching for the best solutions in
the problem space. Also, obtained solutions will be
fully-integrated with the different actors of the design
process.
A case study is provided in the form of a rail-
way overhead air switch simulator. We describe the
problem and the current simulation model which re-
produces the pantograph run across the air switch.
Starting from this simulation model, more layers have
been added following the proposals of the simulation
framework. As a result, the simulator provides a set
of feasible solutions, in accordance with current nor-
mative, and sorted by a degree of goodness provided
by expert in the field. Evaluation results show how a
huge amount (tens of thousands) of scenarios can be
tested, obtaining a reduced set of feasible solutions,
and grading these solutions using optimization met-
rics. Time to simulate and evaluate all scenarios has
been less than two hours in the works case.
As future work, we will analyse in more detail the
simulation framework. A main guideline is to propose
AHolisticApproachtoRailwayEngineeringDesignusingaSimulationFramework
81

a complete IDE, in which the user can customize all
elements described in this paper (simulation model,
evaluation rules, experts knowledge, etc.). Besides,
several efforts are currently in progress in order to
adapt the framework to modern computing paradigms
such as cloud computing. Finally, other future work
will be to extend the framework, from the limited do-
main of railway infrastructure design to a broad do-
main of simulation in engineering. Concepts in rail-
way infrastructure design are quite similar to other
engineering domains, (civil engineering, chemistry)
so the proposed framework could fit with these other
domains.
REFERENCES
Abrahamsson, L., stlund, S., Schtte, T., and Sder, L. (2013).
An electromechanical moving load fixed node posi-
tion and fixed node number railway power supply sys-
tems optimization model. Transportation Research
Part C: Emerging Technologies, 30(0):23 – 40.
Adeli, H. (2003). Expert Systems in Construction and Struc-
tural Engineering. Taylor & Francis.
Brunner, D., Cross, G., McGhee, C., Levis, J., and Whit-
ney, D. (1998). Toward increased use of simulation
in transportation. In Simulation Conference Proceed-
ings, 1998. Winter, volume 2, pages 1169–1175 vol.2.
BS-EN-15273 (2009). Railway applications. gauges. Tech-
nical report, -.
BS-EN-50119 (2009). Fixed installations. electric traction
overhead contact lines. Technical report, -.
Carretero, J., Perez, J. M., Garcia-Carballeira, F., Calderon,
A., Fernandez, J., Garcia, J. D., Lozano, A., Car-
dona, L., Cotaina, N., and Prete, P. (2003). Applying
rcm in large scale systems: a case study with railway
networks. Reliability Engineering & System Safety,
82(3):257 – 273.
ETI (2008). C(2008) 807-subsistema de energ´ıa del sistema
ferroviario transeuropeo de av. Technical report, -.
Gomez, C., Saa, R., Garcia, A., Garcia-Carballeira, F.,
and Carretero, J. (2012). A model to obtain optimal
designs of railway overhead knuckle junctions using
simulation. Simulation Modelling Practice and The-
ory, 26(0):16 – 31.
Goodman, C., Siu, L. K., and Ho, T. (1998). A review of
simulation models for railway systems. In Develop-
ments in Mass Transit Systems, 1998. International
Conference on (Conf. Publ. No. 453), pages 80–85.
Hani, Y., Chehade, H., Amodeo, L., and Yalaoui, F. (2006).
Simulation based optimization of a train maintenance
facility model using genetic algorithms. In Service
Systems and Service Management, 2006 International
Conference on, volume 1, pages 513–518.
Kiessling, F., Puschmann, R., and Schmieder, A. (2009).
Contact lines for electric railways: planning, design,
implementation. Publicis.
Kitchin, F. and Holland, J. (1950). Railway electrification:
design of overhead equipment. Electrical Engineers,
Journal of the Institution of, 1950(11):292.
Naweed, A., Hockey, G., and Clarke, S. (2013). Design-
ing simulator tools for rail research: The case study
of a train driving microworld. Applied Ergonomics,
44(3):445 – 454.
Nejlaoui, M., Houidi, A., Affi, Z., and Romdhane, L.
(2013). Multiobjective robust design optimization of
rail vehicle moving in short radius curved tracks based
on the safety and comfort criteria. Simulation Mod-
elling Practice and Theory, 30(0):21 – 34.
Saa, R., Garcia, A., Gomez, C., Carretero, J., and Garcia-
Carballeira, F. (2012). An ontology-driven deci-
sion support system for high-performance and cost-
optimized design of complex railway portal frames.
Expert Systems with Applications, 39(10):8784 –
8792.
SIMULTECH2014-4thInternationalConferenceonSimulationandModelingMethodologies,Technologiesand
Applications
82
