
Accuracy and Precision of the Tobii X2-30 Eye-tracking
under Non Ideal Conditions
A. Clemotte, M. Velasco, D. Torricelli, R. Raya and R. Ceres
Spanish National Council for Science Research (CSIC), Madrid, Spain
Keywords: Remote Eye Trackers, Tobii X2-30, Spatial Data Quality, Accuracy, Precision.
Abstract: This document describes a methodology for the measurement of accuracy and precision of a remote eye
tracker, the Tobii X2-30, under non ideal condition. The test was performed with 10 people. The results are:
2.46 and 1.91 degrees for the accuracy and precision respectively. The results can be used to establish the
target size on the screen.
1 INTRODUCTION
This study is part of the InteraPCion project
(InteraPCion project webpage, 2014), which seeks to
design adapted interfaces for people with cerebral
palsy (CP).
People with CP have trouble interacting with
their environment. The technology allows decrease
the difficulties of interaction with the environment
through games or adapted therapies.
These people however are not able to use
common computer access interfaces, such as
keyboards, mouse or touchscreens. They need
adapted access channels.
The characteristics of these users are: low
postural control, especially for the extremities and,
inability to speak. The eye-trackers systems are an
interesting option, which has not been deeply
explored yet in this context.
It is important that eye-tracking studies report the
real accuracy and precision of the eye trackers
(Blignaut and Beelders, 2012)(Akkil et al., 2014) It
is argued that the values provided by the
manufacturers are representative of the best possible
capability of the eye tracker under ideal conditions
and for participants with good tracking probabilities
(Tobii X2-30 Eye Tracker Accuracy and Precision
Test Report, 2013)(Accuracy and Precision Test
Method for Remote Eye Trackers, 2011).
To answer this question an experiment was
carried out in order to identify the precision and
accuracy of the Tobii x2-30 with non-disabled
people, under non ideal conditions (without any
chinrest). This information will be used to establish
the minimum size of objects on the screen during the
design of interfaces for people with disabilities.
2 MATERIALS AND METHODS
2.1 Protocol Test
The protocol for the test was the following:
1. Check the eye-tracker position with respect to
the screen. This must be positioned in the
middle of the screen and both must be
coplanar. If the eye-tracker is not well adjusted,
an offset can be introduced in the measures.
2. Run the Tobii Studio (record software) (Tobii
Studio software description webpage, 2014).
3. Take note of the user name, year of birth,
gender, and issues related to his vision.
4. Explain to the user the test procedure.
5. Check the user position with respect to the eye-
tracker. He must be aligned with the eye-
tracker.
6. Calibrate the eye-tracker.
7. Start the test.
8. Rest for 5 minutes.
9. Calibrate the eye-tracker.
10. Start the test.
11. Check that the eye-tracker data was recorded
correctly.
The test lies in:
1. The screen stays white for 1 second.
2. The first target showed up (Figure 1).
111
Clemotte A., Velasco M., Torricelli D., Raya R. and Ceres R..
Accuracy and Precision of the Tobii X2-30 Eye-tracking under Non Ideal Conditions.
DOI: 10.5220/0005094201110116
In Proceedings of the 2nd International Congress on Neurotechnology, Electronics and Informatics (NEUROTECHNIX-2014), pages 111-116
ISBN: 978-989-758-056-7
Copyright
c
2014 SCITEPRESS (Science and Technology Publications, Lda.)
3. The user must look at the centre of the target 5
seconds
4. Then, the target changes its position
automatically.
5. Repeat from the step 2, 15 more times.
6. After 16 targets have been displayed, the test
ends
Under ideal conditions, participants would use a
chinrest in order to prevent any head movements
that could affect the measurements. The aim of this
study was to describe the performance of the eye
tracking device under real and everyday conditions,
where the user's head can freely move while he uses
the eye tracker.
Nevertheless, in step five it was ensure that the
user is within range of the eye tracker, according to
the technical data.
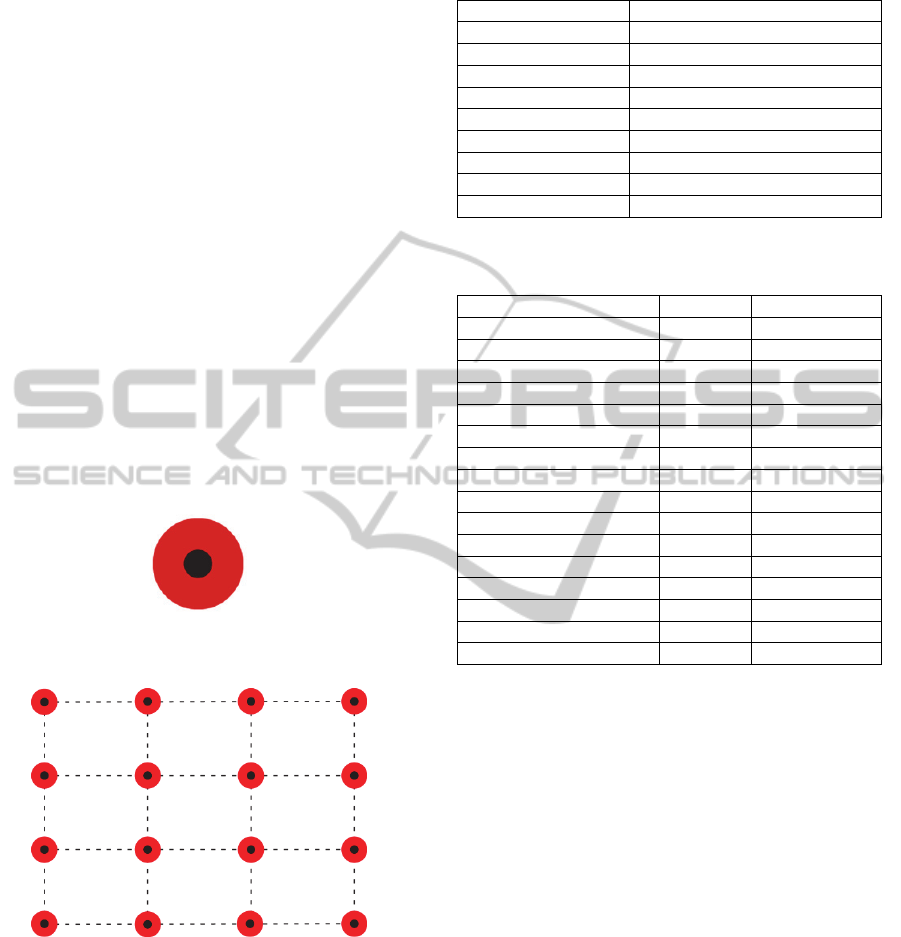
2.2 Target Features
The target consists in 2 concentric circles, with a 30
pixels (radius) internal black circle and a 100 pixels
(radius) external red circle as depicted in Figure 1.
Figure 1: The target lies in two concentric circles, the
internal black and the external red.
Figure 2: Targets are distributed in 4 rows and 4 columns.
Origin of the coordinate is at top-left.
The target can be positioned in 16 positions, over
4 columns and 4 rows (Figure 2), according to the
coordinates of Table 1.
The target position for each test was random,
following the order depicted in the Table 2.
In total, each target is displayed during 5
seconds. Each test lasts: 5 seconds / target x 16
targets + 1 initial second = 81 seconds
(approximately 1 minute and a half).
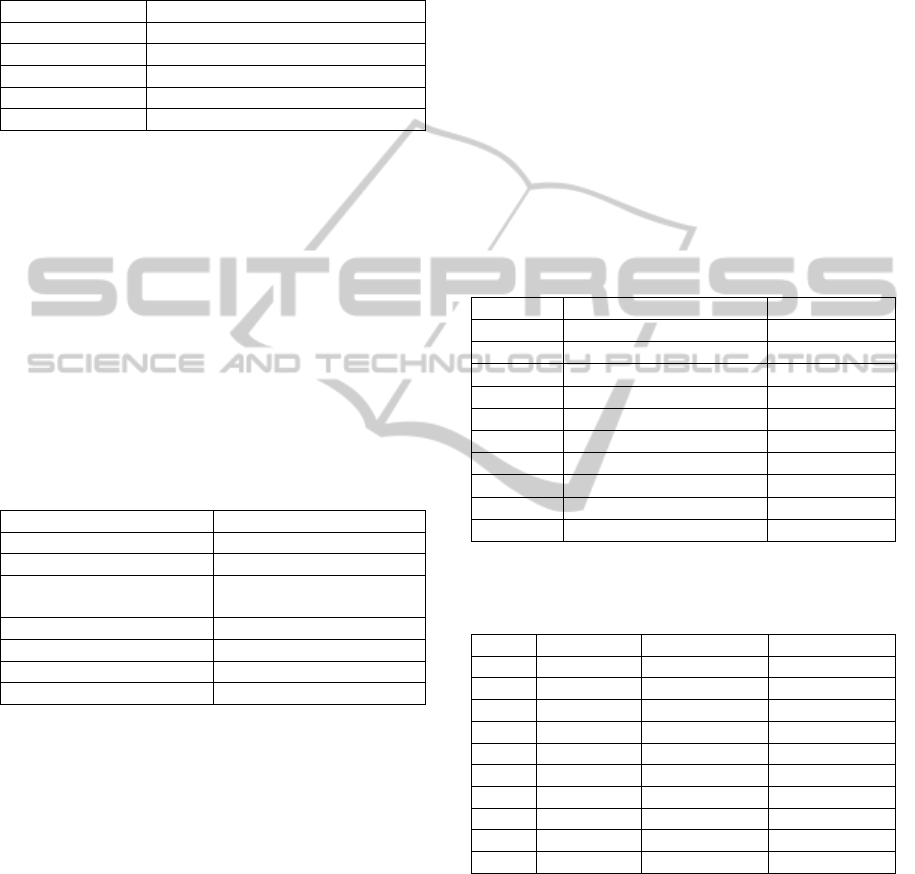
Table 1: Rows and columns’ coordinates.
Row Coordinate
1 100
2 370
3 655
4 920
Column Coordinate
1 100
2 460
3 820
4 1180
Table 2: Order of appearance of the targets, specified by it
coordinates values.
Order of appearance Row Column
1 1 3
2 4 4
3 4 1
4 1 4
5 1 1
6 2 2
7 3 1
8 2 1
9 3 3
10 2 3
11 4 2
12 2 4
13 3 4
14 1 2
15 4 3
16 3 2
2.3 Eye-tracker Features
The eye-tracker used for the experiment was the
Tobii X2-30 (Tobii X2-30 system description
webpage, 2014), at a sampling frequency of 40 Hz.
This eye tracker is a remote system (not head-
mounted), able to collect data from both eyes
(binocular). Accuracy and precision under ideal
conditions are 0.4 and 0.26 degrees respectively, at a
fixed distance from the user's head to the device.
The eye tracker is able to operate at a distance
between 40 to 90 cm to the user. The Tobii X2-30
allows head movements (at 70 cm) of 50 and 36 cm,
in the horizontal and vertical axes, respectively
(Tobii X2-30 Eye Tracker User’s manual. Appendix
A: Tobii X2–30 Eye Tracker Specifications, 2013)0.
The Tobii run the firmware 1.0.324726.
20130603.1649.root.
The experiment design was performed with the
Tobii Studio 3.2.1.190 Professional Edition.
NEUROTECHNIX2014-InternationalCongressonNeurotechnology,ElectronicsandInformatics
112
2.4 Computer Features
The computer used for the test was a HP Compaq
8000, with the characteristics shown in Table 3.
Table 3: Features of the computer used for the experiment.
Computer HP Compaq 8000 Elite CMT
CPU Intel Core 2 Quad Q9500
CPU Speed 2 x 2.83Ghz
RAM 4GB
OS W7 Professional 32b
Graphics card GeForce 8500 GT
At the moment of the test, only the Tobii Studio
software was running. Appearance and performance
of Windows were set up to “best performance” and
the energy saving options were set up to “hi
performance”.
2.5 Screen Features
The screen used for the test was a HP L1950g 19-
inch, with the features described in the Table 4.
According to the screen characteristics, each
pixel has 0.03cm. Then, the internal black circle has
0.9cm (0.03cm/pix X 30pix) and the external red
circle has 3cm (0.03cm/pix X 100pix).
Table 4: Features of the screen used for the test.
Screen HP L1950g
Dimensions 19 inch (48.25 cm)
Technology LCD
Screen Opening (WxH) 14.9 x 11.9 inch (37.8 x
30.3 cm)
Aspect Ratio 5:4
Resolution 1280 x 1024
Pixel Pitch 0.294 mm
Frequency 60Hz
2.6 Calibration Procedure
Five points were used for the calibration. The
Calibration procedure is:
1. A small animated circle is shown on the screen
to catch the user’s attention.
2. When it arrives at the calibration point, the
point rests for about 0.5 seconds to make the
user stare at it. Then, the object shrinks to
focus the gaze.
3. When shrunk, the eye tracker starts to collect
data for the specific calibration point.
4. The eye tracker waits until calibration data
from the current position is collected.
5. The circle is enlarged again.
6. Steps 1-5 are repeated for all 5 calibration
points.
2.7 Participants’ Information
In total, 10 participants were recruited, whose
characteristics are shown in the Table 5.
40% of the participants are women, and the 60%
men. All participants are regular readers. 3 out of the
10 participants (U2, U7 and U10) have had contact
with an eye-tracker before. One user has systematic
contact with an eye-tracker.
Half of the participants normally use glasses
while working with a computer. These people have
taken the tests without their glasses. One user uses
contact lenses. This user has performed the test with
their contact lenses on.
The color of the eyes of the participants as well
the dominant eye is indicated in Table 6. The user
U10 has very narrow eye shape.
Table 5: Year of birth and gender of the participants.
User Year of birth Sex
U1 1970-1974 Female
U2 1985-1989 Male
U3 1985-1989 Male
U4 1985-1989 Male
U5 1990-1994 Female
U6 1985-1989 Female
U7 1980-1984 Male
U8 1985-1989 Male
U9 1980-1984 Female
U10 1980-1984 Male
Table 6: Eyes color (B: Brown, G: Green), dominant eye
(L: Left, R: Right) and issues related with the vision per
user.
User Eyes color Dominant eye Vision
U1 B R Not Corrected
U2 B R Not Corrected
U3 G L Contact lens
U4 B R Glasses
U5 B R Glasses
U6 G L Glasses
U7 B L Not Corrected
U8 B R Glasses
U9 G R Not Corrected
U10 G L Glasses
2.8 Environment Illumination
The illumination in the test room can be considered
stable during the tests, which last approximately one
hour. The illumination was sunlight and fluorescent
lighting.
2.9 Data Pre-processing
Data provided by the eye-tracker at each sample
AccuracyandPrecisionoftheTobiiX2-30Eye-trackingunderNonIdealConditions
113
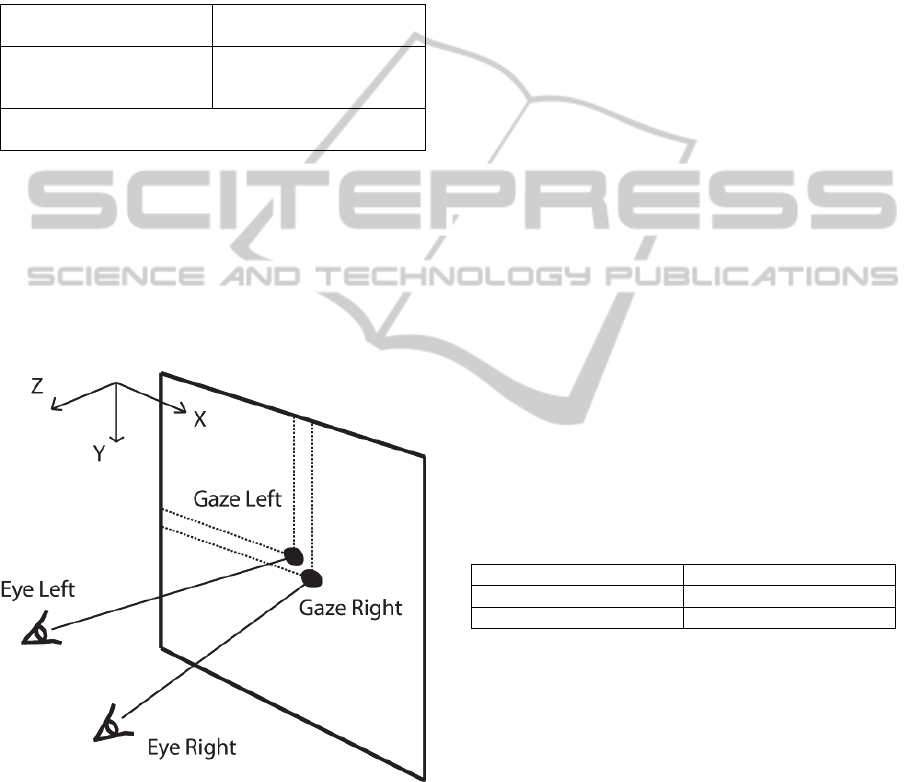
time are: the X,Y coordinates of the point where the
participant is looking at (gaze of each eyes), and the
X,Y,Z coordinates of the position of the eyes, as
depicted in the Table 7. There is also the target
position coordinates in every sample time, defined
by the protocol.
Table 7: Data provided by the eye-tracker in each sample
data: gaze point and eye position. The target position at
the screen is also know, defined by the protocol.
Left gaze
(X[t],Y[t])
Right gaze
(X[t],Y[t])
Left eye position
(X[t],Y[t],Z[t])
Right eye
position
(X[t],Y[t],Z[t])
Target position
(X[t],Y[t])
The origin of the coordinate system is the upper
left corner of the screen, then the coordinate of the Z
axis is zero constantly for the target and gaze
positions.
For each sample provided by the eye-tracker a
number of simplification were made. One gaze point
is calculated (Gaze), with the average of each eye
gaze coordinates independently:
Figure 3: This figure depicted the gaze for each eye
projected to the screen as a red and blue line. Also are
depicted the points of intersection between the gaze and
the screen (red and blue circles). Coordinates origin is the
upper left corner of the screen.
Gaze(X[t],Y[t],Z[t]) =
(
Mean
{
Gaze Left(X[t]),
Gaze Right(X[t])
},
Mean
{
Gaze Left(Y[t]),
Gaze Right(Y[t])
}
)
Also, for each sample provided by the eye-
tracker, one eye position is calculated (Eye), with
the average of both eye coordinates:
Eye(X[t],Y[t],Z[t]) =
(
Mean
{
Eye Left(X[t]),
Eye Right(X[t])
},
Mean
{
Eye Left(Y[t]),
Eye Right(Y[t])
},
Mean
{
Eye Left(Z[t]),
Eye Right(Z[t])
}
)
Summarizing, after the simplification the data
are the presented in the Table 8, depicted graphically
in the Figure 4.
Table 8: After the simplification, the data are the average
Gaze point, Eye position and Target position.
Gaze (X[t],Y[t],0)
Eye position (X[t],Y[t],Z[t])
Target position (X[t],Y[t],0)
With these three points (Gaze, Target and Eye
position) two vectors are created: Eye-Target and
Eye-Gaze:
a = Eye – Target
b = Eye – Gaze
For each sample data the angle between these
two vectors are calculated as follow:
Angle(a,b) = atan(norm(
cross(a,b)), dot(a,b))
Where atan calculate the inverse tangent, norm
calculate the norm of the vector, cross calculate the
cross product and dot calculate the dot product. With
these angles, the accuracy and precision are
calculated, as is defined later.
NEUROTECHNIX2014-InternationalCongressonNeurotechnology,ElectronicsandInformatics
114
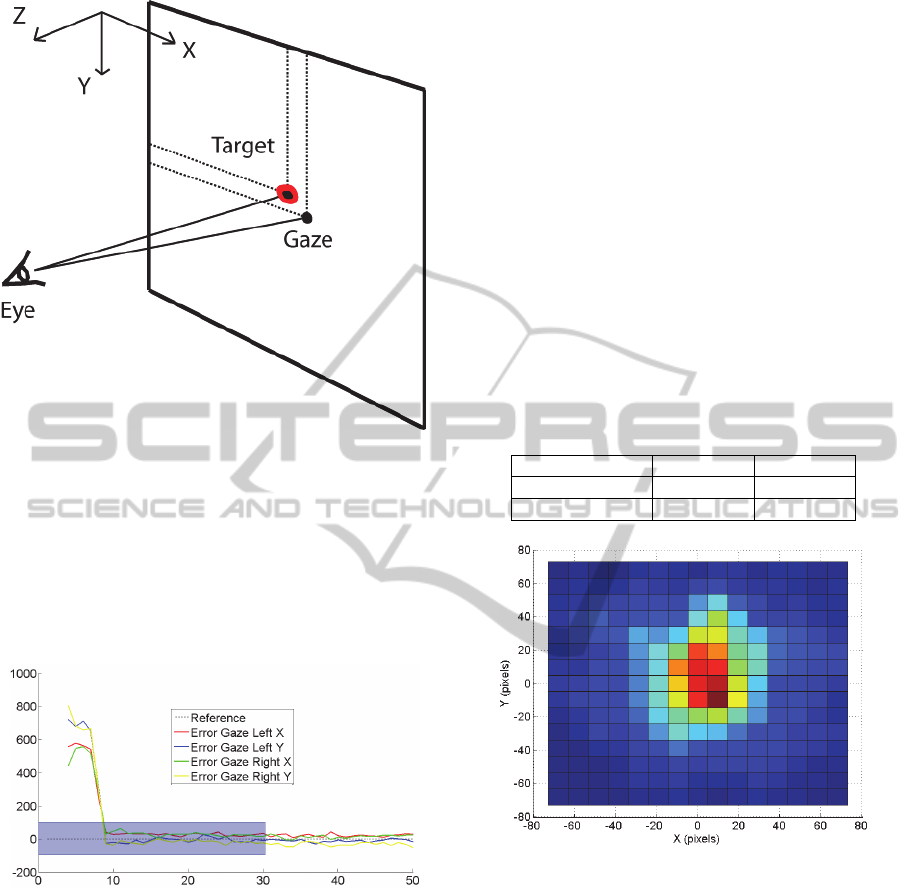
Figure 4: Graphically, the data simplified are the Target
Gaze and Eye position.
For the analysis, the last 4.25 seconds, after the
target appeared, have been processed. The first 0.75
seconds are not used for the analysis because it is
considered the time required to fix the gaze in the
target displayed. The Figure 5 depict the first 0.75
seconds as a gray area.
Figure 5: This figure depicted the error (gaze coordinate
minus the target coordinate) as a function of time. In this
figure the gray rectangle enclose the first 0.75 seconds not
used for the analysis because it is considered the time
required to fix the gaze in the target displayed.
Angles with a value greater than 3 times the
standard deviation of all the angles are considered
outliers and are discarded from further analysis.
2.10 Definitions
The accuracy and precision are calculated as the
mean and standard deviation respectively of all the
angles recorded (angles between the vectors Eye-
Target and Eye-Gaze):
Accuracy = mean(angle)
Precision = std(angle)
3 RESULTS
After data preprocessing, the rate of outliers is
1.20% from a total of 44517 samples. Accuracy and
precision without outliers are presented in the Table
9.
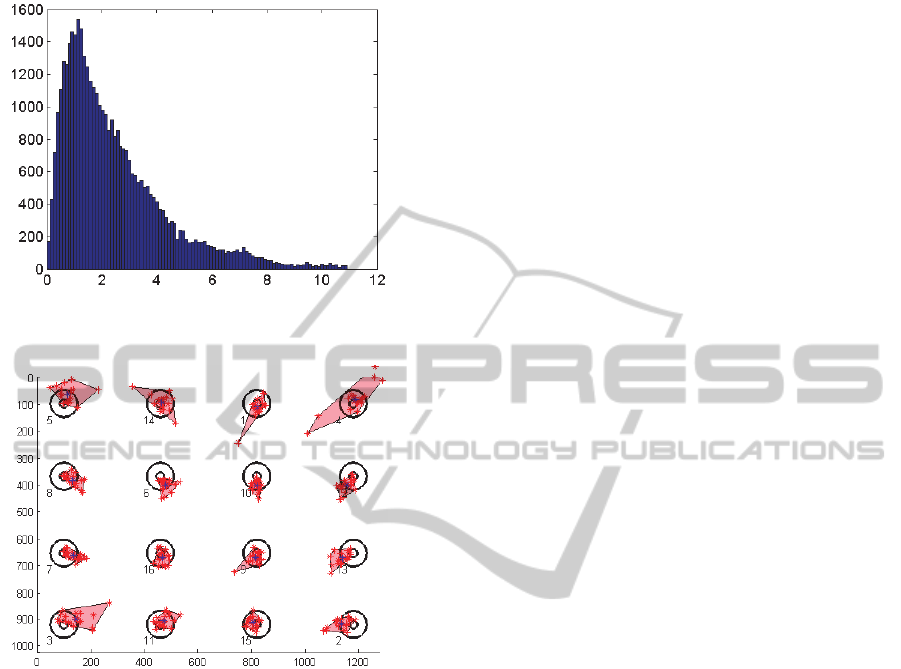
The histogram of Gaze is showed in the Figure 6
(as a heat-map), and histogram of the angles in the
Figure 7. Both of these histograms were made after
data pre-processing (without outliers).
Table 9: Accuracy and precision of the data provided by
the test and by the datasheet (Tobii X2-30 Eye Tracker
User’s manual. Appendix A: Tobii X2–30 Eye Tracker
Specifications , 2013)0, in degrees.
Measured Datasheet
Accuracy 2.46º 0.40º
Precision 1.91º 0.26º
Figure 6: Histogram of the data recorded as a function of
the X,Y coordinates, in pixels.
Figure 8 shows the average gaze position for
each target. Each target has associated 20 red points,
representing each user (each participant perform 2
tests). For this figure, data with outliers were used.
4 DISCUSSION
The obtained results facilitated the establishment of
the target size on the screen, according to the
following criteria. The precision establish the
minimum size of the target. Otherwise, the user of
the eye-tracker cannot maintain the gaze over the
target. Precision can be reduced filtering the signal.
AccuracyandPrecisionoftheTobiiX2-30Eye-trackingunderNonIdealConditions
115
The accuracy is more critical than the precision,
because it cannot be reduced with filtering technics.
Figure 7: Histogram of the angles between the vectors
Eye-Gaze and Eye-Target. The pick is at 1.15 degrees.
Figure 8: Average gaze position for each target. The axis
measurement units are pixels.
5 CONCLUSIONS
We describe a method for the measurement of
accuracy and precision of a remote eye tracker, the
Tobii X2-30. The test was performed with 10
people, under non-ideal condition (without a
chinrest). Even without the chinrest device, the
user's head was always within the range of the eye
tracker during the sessions.
The experiment outputs are 2.46 and 1.91
degrees for the accuracy and precision, respectively.
As expected, this values are higher than the ones
described by the device developers under ideal
conditions, but might be better descriptors of the
device's performance since were calculated in real
conditions.
All the participants in the study were young
healthy subjects with perfect postural and motor
control. The interest of this analysis is to expand the
results to a population of disabled people, through
the developed of alternative computer access. The
results could be used to better define some
parameters of alternative computer interfaces for
disabled people, such as button size on the screen
and distance between buttons.
REFERENCES
Tobii Studio software description webpage. Retrieved
August, 2014, from http://www.tobii.com/en/eye-
tracking-research/global/products/software/tobii-
studio-analysis-software/.
InteraPCion project webpage. Retrieved August, 2014,
from http://www.car.upm-csic.es/bioingenieria/GBIO-
CP/proyectos.html.
Tobii X2-30 system description webpage. Retrieved
August, 2014, from http://www.tobii.com/de/eye-
tracking-research/global/products/hardware/tobii-x2-
30-eye-tracker/.
Blignaut, P., & Beelders, T., 2012. TrackStick : A Data
Quality Measuring Tool for Tobii Eye Trackers. In
Proceedings of the Symposium on Eye Tracking
Research and Applications - ETRA ’12 (p. 293). New
York: ACM Press.
Akkil, D., Isokoski, P., Kangas, J., Rantala, J., & Raisamo,
R. 2014. TraQuMe: A Tool for Measuring the Gaze
Tracking Quality. In Proceedings of the Symposium
on Eye Tracking Research and Applications -
ETRA’14 (pp. 327–330). New York, USA: ACM
Press.
Tobii X2-30 Eye Tracker Accuracy and Precision Test
Report. Version 1.0.1, 2013. Tobii Technology AB.
Retrieved August, 2014, from http://www.tobii.com/
Global/Analysis/Training/Metrics/Tobii 20X2-30 Eye
Tracker Accuracy and Precision Test Report.pdf?
epslanguage=de
Accuracy and Precision Test Method for Remote Eye
Trackers. Version 2.1.1, 2011. Tobii Technology AB.
Retrived August, 2014, from http://www.tobii.com/
Global/Analysis/Training/Metrics/Tobii_Test_Specific
ations_Accuracy_and_PrecisionTestMethod_version
2_1_1_.pdf
Tobii X2-30 Eye Tracker User’s manual. Appendix A:
Tobii X2–30 Eye Tracker Specifications. Version
1.0.1, 2013. Tobii Technology AB. Retrieved August,
2014, from http://www.tobii.com/Global/Analysis/
Downloads/User_Manuals_and_Guides/Tobii_X2-30_
EyeTrackerUserManual_WEB.pdf?epslanguage=de
NEUROTECHNIX2014-InternationalCongressonNeurotechnology,ElectronicsandInformatics
116
