
Can SKOS Ontologies Improve the Accuracy of Measuring Semantic
Similarity of Purchase Orders?
Steven B. Kraines
Future Center Initiative, The University of Tokyo, Kashiwa-No-Ha, Kashiwa-Shi, Japan
Keywords: Knowledge Representation, SKOS Ontologies, Semantic Similarity.
Abstract: The effect of additional domain knowledge provided by a SKOS ontology on the accuracy of semantic
similarity calculated from product item lists in purchase orders for a manufacturer of modular building parts
is examined. The accuracy of the calculated semantic similarities is evaluated against attribute information
of the purchase orders, under the assumption that orders with similar attributes, such as the industrial type of
the purchasing entities and the type of application of the modular building, will have similar lists of items.
When all attributes of the purchase orders are weighted equally, the SKOS ontology does not appear to
increase the accuracy of the calculated item list similarities. However, when only the two attributes that
give the highest correlation to item list similarity values are used, the strongest correlation between item list
similarity and entity attribute similarity is obtained when the SKOS-ontology is included in the calculation.
Still, even the best correlation between item list and entity attribute similarities yields a correlation
coefficient of less than 0.01. It is suggested that inclusion of semantic knowledge about the relationship
between the set of items in the purchase orders, e.g. via the use of description logics, might increase the
accuracy of the calculated semantic similarity values.
1 INTRODUCTION
A key element of any knowledge management
system is the ability to measure the semantic
similarity between two entities in a knowledge base,
e.g. personnel records in a human resources
knowledge base, knowledge experts in an expertise
knowledge base, research papers in an academic
knowledge base, or miscellaneous facts in a
common sense knowledge base (Bizer et al.2005,
Bleier et al.2011, Kraines et al. 2011). To assess the
semantic similarity, one must be able to identify
when the descriptors of two entities in a knowledge
base mean the same thing even if they do not say the
same thing, which requires the ability to “understand”
the entity descriptors and to reason about what they
mean. This in turn requires that the system be
provided with background knowledge in a form that
the system can reason with. Ontologies are often
used to provide this background knowledge (Zhong
et al., 2002, Oldakowski et al., 2005).
Recently high expectations have been placed on
the ability of SKOS (simple knowledge organization
system) ontologies to handle problems such as the
semantic gap (www.w3.org/2004/02/skos, Bizer et
al., 2009, Bechhofer et al., 2008, Aleman-mesa et
al., 2007). Unlike “heavy weight ontologies” that
have a framework for defining a wide range of
semantic relationships based on some form of logic,
a SKOS ontology uses only three kinds of semantic
relation-ships between concepts: “broader”,
“narrower”, and “related to”. SKOS ontologies take
the form of hierarchical classifications if the
“broader/narrower” relationships are used, or
thesauri if only the “related to” relationships are
used.
Semantic searches using thesauri generally use
the “concept expansion” approach, where a search
query is augmented by adding terms that are a
specified number of “related to” links from one of
the original search terms. The “broader/narrower”
semantic relationships used in hierarchical
classifications can improve the accuracy of this
expansion by selectively adding only “broader”
concepts and optionally weighting a concept match
by the concept depth in the classification hierarchy.
However, even a hierarchical classification provides
limited capability to create queries and knowledge
descriptors that enable semantic inference. For
example, one cannot describe the specific semantic
248
B. Kraines S..
Can SKOS Ontologies Improve the Accuracy of Measuring Semantic Similarity of Purchase Orders?.
DOI: 10.5220/0005074702480255
In Proceedings of the International Conference on Knowledge Engineering and Ontology Development (KEOD-2014), pages 248-255
ISBN: 978-989-758-049-9
Copyright
c
2014 SCITEPRESS (Science and Technology Publications, Lda.)

nature of a relationship between two concepts.
The question we address in this paper is whether
or not the limited semantics provided by a SKOS
ontology is enough to improve the accuracy of
evaluating the similarity between pairs of purchase
orders for products manufactured for assembly of
modular buildings. The purchase orders that we
consider here are complete lists of building
components purchased together for the fabrication of
a modular building. The similarity between a pair
purchase orders can be described as the number of
similar components in the two orders.
We use a SKOS ontology, which describes a
“broader/narrower” classification of the building
component products, to calculate similarity between
items in two different purchase orders. We measure
the accuracy of the semantic similarity calculation
results against attributes of the purchase orders,
based on the assumption that similar purchase orders
will tend to have similar item lists.
In formal terms, we test the following
hypothesis: “The additional information from SKOS
semantic relationships between items in different
sets can increase the accuracy of similarity scores
calculated for those sets,” where the accuracy of the
similarity scores is assessed based on the assumption
that sets (in our case “purchase orders”) having
similar attributes will tend to have similar items.
The article is organized as follows. Section 2
describes related work. Section 3 outlines the
methodology used. Section 4 describes the results,
and section 5 discusses how much the SKOS
ontology contributes to the accuracy of the
calculated semantic similarity. Section 6 proposes
some future directions for this work.
2 RELATED WORK
Semantic web technologies such as ontologies have
been used in e-commerce and “order fulfillment
process” (Breslin et al. 2010, Li and Horrocks 2003).
Fard et al. (2013) measured the semantic similarity
between individual products purchased by users
using content-based filtering based on a “user profile
ontology” and an “items ontology”. Evaluating their
method against bills of a construction materials
supplier with 2581 products, they found that
accuracy of content-based filtering based on
semantic similarity is higher than that based on
cosine similarity.
Pan et al. (2008) studied automated ontology-
mapping approaches using three different types of
concept features: corpus-based, attribute-based, and
name-based. They demonstrate in an evaluation
against two ontologies from the architecture,
engineering and construction industry that attribute-
based features, which most closely correspond to our
work, outperform the other two types of features in
terms of precision and F-measure.
Much of the previous work on using ontologies
to measure semantic similarity between sets of
concepts has been done in the area of semantic web
service match-making and ontology mapping. Dong
et al. (2013) give a comprehensive review of
semantic web service matchmaking techniques that
employ some degree of semantic reasoning based on
ontologies. Almost all of the matchmakers that they
review just divide matches into four discrete types:
exact matches, plug-in (exact inheritance) matches,
subsumption matches, and intersection matches. Cai
et al. (2011) describe the semantic matchmaking
methodology in their ManuHub system for
managing manufacturing services with ontologies.
Like the systems reviewed by Dong et al., ManuHub
also gives an “all or nothing” evaluation of the
semantic matches between the matching parameters.
The problem of assessing the similarity of two
lists of items is related to market basket analysis
(Agrawal et al., 1993). Bellandi et al. (2007) used
ontologies to reduce the “search space” of the
association rule mining algorithm by abstracting
items in a particular basket to a higher ontological
class. They describe their ontology as a full
description logics ontology. However, for the
“abstraction constraints”, they simply generalize the
class of a basket item to a predefined level of the
hierarchical structure of the ontology, which is
essentially equivalent to using a SKOS model of the
ontology. Won et al. (2006) also used the
hierarchical structure of an “items” ontology to
abstract items in market baskets to more general
classes in order to reduce the number of association
rules that are generated. Wang et al. (2007)
demonstrated that an ontology in the form of a
commodity classification hierarchy can increase the
effectiveness of association rule mining in obtaining
useful and meaningful association rules from the
FoodMart2000 dataset. In all three studies, the
original classes of the basket items were replaced
with the higher level classes, so the information
given by the original more specific classes was lost.
As a result, a match between two beverages might
be scored the same as between two Budweiser beers.
CanSKOSOntologiesImprovetheAccuracyofMeasuringSemanticSimilarityofPurchaseOrders?
249

other option product
equipment option product
booth product
water heater product
equipment light product
electrical product
ventilation product
wash room product
equipment window product
indoor option product
indoor light product
frame product
sheet product
partition product
indoor window product
door product
floor product
outdoor option product
shutter product
color variation product
entranceway product
outdoor window product
deck unit product
cover product
window roof product
panel product
window product
window screen product
window sash product
window rail product
window lace product
window grill product
window glass product
window film product
window drape product
window blinds product
light product
other other option product
Other Internal Options
Other special order parts
Other equipment options
Other External Option
Figure 1: Upper levels of the product classification
schema.
3 METHODOLOGY
We apply a technique for calculating semantic
similarity between two items that considers the
specificity of the most specific class which
subsumes the classes of the two items.
We obtained data for 520 purchase orders from a
manufacturer of modular buildings. The data
contains the list of product items in the purchase
order together with several attributes of the
purchase, including the industry class of the
purchaser and the type of use application of the
modular building. In consultation with the
manufacturer, we constructed a classification of the
item types in the category “other option products.”
This category contains building components that
have more specialized roles and that were therefore
thought to have the most specificity for the general
type of a purchase order. The classification, which
we constructed manually, has a maximum depth of
five. The upper levels of the classification are
shown in Figure 1.
From the 520 original purchase orders we auto-
matically filtered out the ones that included less than
10 types of items because we want to obtain strong
semantic similarities that are not just coincidental
matches of a few items. This resulted in a set of 135
purchase orders that we have used in the analysis.
We then calculate the similarity between a search
purchase order A and a target purchase order B,
including the reflective similarity of the same order
with itself. To assess the similarity of indirect
matches between items in two different purchase
orders that have similar but not identical classes, we
apply the SKOS ontology as follows.
First, we calculate the match score of each class
in the ontology as a function of the depth of the class
and the inverse of the total number of occurrences in
the entire data set as suggested by Resnik (1997):
match score of class i =
depth of class i / (# instances of class i)
k1
where k1 is greater than or equal to zero.
Next, for each item in the search order A, we
find all item classes that subsume both the search
item class i and the class j of at least one item in the
target order B:
match score of search class i to target class j =
k2(match score of class subsuming i and j)
where k2 is a penalty for an indirect match that is set
to some pre-selected value between 0.0 and 1.0 if
class i is not the same as class j, and 1.0 otherwise.
A k2 value of 0.0 corresponds to the case where the
KEOD2014-InternationalConferenceonKnowledgeEngineeringandOntologyDevelopment
250

SKOS ontology is replaced with a simple controlled
list of terms.
We then find the subsuming class for item i
having the highest score:
match score of search class i to target order B =
max(match score of class i to class j)
for all j in target order B
The match score between search order A to target
order B is the sum of these maximum scores:
match score of search order A to target order B =
sum(match score of class i to order B)
for all i in search order A
We originally included a final step where the
similarity scores of a search order with each target
order are normalized to the maximum possible
similarity score for the search order, which is the
similarity score of the search order with itself.
However, we decided not to use this normalization
step for the following two reasons. First, the
normalization results in a large number of matches
with nearly indistinguishable similarity scores.
Second, we judged that the normalization process
itself may not be justified by the problem we are
addressing. Normalization acts to score a match of a
small number of items between sets having few total
items equal or higher than a match of a larger
number of items between sets having many items.
This is the desired behaviour for a matching system
that must handle matches between item sets created
“in the wild”, such as meta-tag lists on webpages.
However, as noted earlier in this section, here we
want to find matches that have a strong absolute
level of semantic similarity, so we want to assign
higher scores to matches that have larger numbers of
items in common even if the item sets are larger.
Finally, we rank all of the matches by similarity
score and examine the correlation of the similarity
score with the similarity of the attributes of the
purchase orders.
4 RESULTS
We show the results of the matching and ranking for
the six conditions for the similarity scoring
coefficients shown in Table 1.
The top 20 non-self matches for each of the six
conditions are listed in Table 1. The top 20 matches
for the case where k1 is 2, corresponding to a strong
exponential weighting for the uncommonness of an
item class, are identical for all values of k2.
Therefore, it appears that when the scoring is
weighted more heavily for matches between
uncommon items, the classification from the
ontology does not affect the results very much.
However, when k1 is 1, which corresponds to a
weaker linear weighting for class use frequency, the
rankings are no longer identical. Although the top
scoring matches, such as the match between orders
32 and 51, occur in all of the top 20 lists, the value
of k2 influences the ranking of the matches. This
means that the classification information has a
stronger influence when the scoring is less highly
weighted towards uncommon item matches.
To assess the accuracy of each of the semantic
similarity calculation conditions, we examine how
closely the similarity scores based on the item lists
reproduce the similarity of three attributes of the
purchases: the industry type of the purchaser, the
application area for the purchase (e.g. event facility,
temporary facility, on-site facility, etc.), and the
application type (e.g. office, shop, learning facility,
etc.).
We scored the similarity between the purchase
order attributes as follows:
Attribute similarity score =
a1*attributeMatch1 +
a2*attributeMatch2 +
a3*attributeMatch3
where attributeMatch1 is 1 if the industry type of the
two orders is the same and 0 if it is different,
attributeMatch2 is 1 if the application area of the
two orders is the same and 0 if different, and
attributeMatch3 is 1 if the application type of the
two orders is the same and 0 if different. The values
for a1, a2, and a3 are set as shown in Table 2.
We then applied a smoothing filter to the ranked
attribute similarity scores and plotted the smoothed
scores against the item list similarity scores. The
plot having the strongest correlation between item
list similarity scores and attribute-based similarity
scores is shown in Figure 2. The correlation
coefficients for all combinations of item list
similarity calculation conditions and attribute-based
similarity score formulations are summarized in
Table 2.
When all of the purchaser attributes are weighted
equally, the best correlation is 0.0046, which is
given by condition 6. This is the formulation that
ignores product classification and favours the item
types that appear least frequently. However, a higher
correlation coefficient of 0.0089 is obtained when
the application area attribute is ignored.
Interestingly, this correlation is given by condition 2,
which is the formulation that gives some weight to
the product classification and less weight to the
CanSKOSOntologiesImprovetheAccuracyofMeasuringSemanticSimilarityofPurchaseOrders?
251
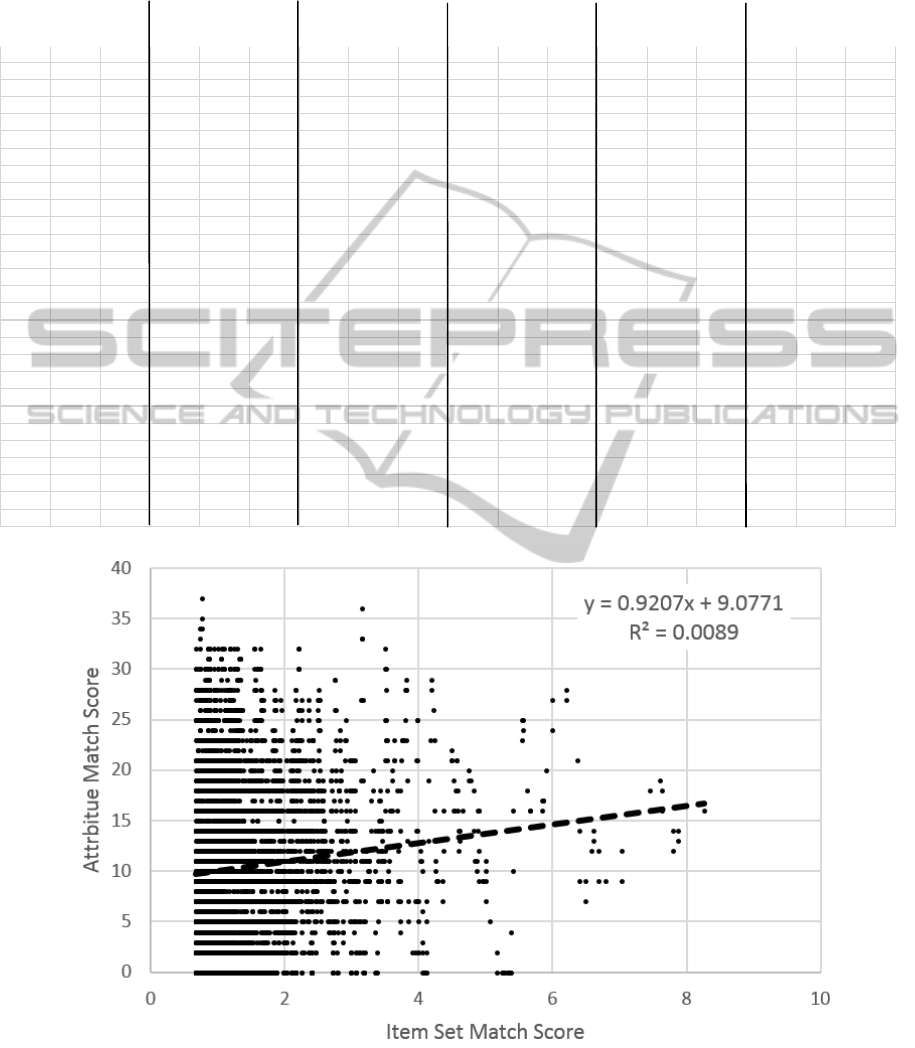
Table 1: Top matches for each similarity calculation condition. The purchase order used as the query for the similarity
calculation is labelled “search”, and the purchase order used as the matching target is labelled “target”. Note that while in
most cases the score for two orders is the same irrespective of which is the search and which is the target, there are some
exceptions, such as the case of orders 32 and 51.
Condition 1 Condition 2 Condition 3 Condition 4 Condition 5 Condition 6
(k1=1, k2=1.0) (k1=1, k2=0.5) (k1=1, k2=0.0) (k1=2, k2=1.0) (k1=2, k2=0.5) (k1=2, k2=1.0)
Figure 2: Correlation between smoothed attribute similarity score for the orders and item list similarity score calculated
using condition 2.
search target score search target score search target score search target score search target score search target score
32 51 10.9 32 51 10.8 32 51 10.7 81 62 34.9 81 62 34.9 81 62 34.9
81 62 10.6 81 62 10.5 81 62 10.5 98 33 34.8 98 33 34.8 98 33 34.8
98 33 9.0 98 33 8.8 98 33 8.7 33 98 34.8 33 98 34.8 33 98 34.8
33 98 9.0 33 98 8.8 33 98 8.7 32 51 34.4 32 51 34.4 32 51 34.4
71 6 8.6 71 6 8.4 71 6 8.2 51 32 28.2 51 32 28.2 51 32 28.1
6 71 8.6 6 71 8.4 6 71 8.2 71 6 28.1 71 6 28.1 71 6 28.1
51 32 8.4 51 32 8.3 51 32 8.1 6 71 28.1 6 71 28.1 6 71 28.1
106 35 8.4 98 35 7.9 117 63 7.7 13 23 27.1 13 23 27.1 13 23 27.1
35 106 8.4 35 98 7.9 63 117 7.7 98 35 26.9 98 35 26.8 98 35 26.6
98 35 8.3 117 63 7.8 13 23 7.5 35 98 26.9 35 98 26.8 35 98 26.6
35 98 8.3 63 117 7.8 98 35 7.4 23 13 26.4 23 13 26.4 23 13 26.4
117 63 7.9 106 35 7.6 35 98 7.4 117 63 26.4 117 63 26.3 117 63 26.3
63 117 7.9 35 106 7.6 117 104 7.4 63 117 26.4 63 117 26.3 63 117 26.3
13 23 7.7 13 23 7.6 104 117 7.4 117 104 26.3 117 104 26.3 117 104 26.3
117 104 7.5 117 104 7.4 106 35 6.9 104 117 26.3 104 117 26.3 104 117 26.3
104 117 7.5 104 117 7.4 35 106 6.9 126 90 26.2 126 90 26.2 126 90 26.2
129 35 7.2 126 90 7.0 126 90 6.9 90 126 26.2 90 126 26.2 90 126 26.2
35 129 7.2 90 126 7.0 90 126 6.9 101 98 25.5 101 98 25.5 101 98 25.4
126 90 7.2 23 13 6.8 23 13 6.7 98 101 25.5 98 101 25.5 98 101 25.4
90 126 7.2 51 35 6.7 99 106 6.6 107 71 25.3 107 71 25.3 107 71 25.3
98 90 7.0 35 51 6.7 51 35 6.5 71 107 25.3 71 107 25.3 71 107 25.3
90 98 7.0 129 35 6.6 35 51 6.5 23 18 25.2 106 12 25.2 106 12 25.1
23 13 6.9 35 129 6.6 106 99 6.4 18 23 25.2 12 106 25.2 12 106 25.1
51 35 6.9 99 106 6.6 101 98 6.3 106 12 25.2 23 18 25.1 116 45 25.1
35 51 6.9 98 90 6.5 98 101 6.3 12 106 25.2 18 23 25.1 45 116 25.1
99 106 6.6 90 98 6.5 107 71 6.1 106 35 25.2 116 45 25.1 23 18 25.0
101 98 6.4 101 98 6.4 71 107 6.1 35 106 25.2 45 116 25.1 90 18 25.0
KEOD2014-InternationalConferenceonKnowledgeEngineeringandOntologyDevelopment
252

Table 2: Correlation coefficients for the smoothed attribute similarity score calculated for different combinations of
purchase order attributes and the item list similarity score calculated using each of the similarity calculation conditions.
Condition 1 Condition 2 Condition 3 Condition 4 Condition 5 Condition 6
k1 1 1 1 2 2 2
k2 1.0 0.5 0.0 1.0 0.5 0.0
a1=1,a2=0,a3=0 0.00380 0.00300 0.00240 0.00390 0.00390 0.00460
a1=0,a2=1,a3=0 0.00150 0.00220 0.00140 0.00120 0.00100 0.00090
a1=0,a2=0,a3=1 0.00490 0.00630 0.00480 0.00390 0.00360 0.00380
a1=1,a2=1,a3=0 0.00001 0.00020 0.00007 0.00004 0.00002 0.00006
a1=1,a2=0,a3=1 0.00820 0.00890 0.00680 0.00710 0.00660 0.00710
a1=0,a2=1,a3=1 0.00040 0.00050 0.00060 0.00040 0.00040 0.00060
a1=1,a2=1,a3=1 0.00180 0.00160 0.00160 0.00180 0.00180 0.00220
frequency of appearance. Although, it is difficult to
make any strong conclusions from the weak
correlations shown in Table 2, they suggest that
while the naïve approach of using all of the
purchaser attributes equally does not seem to benefit
from the SKOS ontology, a more informed selection
of attribute weights may bring out the benefits of the
SKOS ontology for similarity calculation. More
experiments with other data sets would be necessary
to quantify how much the hierarchical classification
structure provided by the SKOS ontology can
actually improve the accuracy of semantic similarity
estimates in industrial applications.
5 DISCUSSION
The results of our analysis in the previous section
suggest that our hypothesis that the SKOS ontology
increases the accuracy of the similarity scores is
supported when the entity attributes are selected to
give the best correlation and when item matches are
weighted as a linear rather than an exponential
function of how uncommon they are.
However, even in the similarity calculation
formulation showing the strongest correlation
between item list similarity score and purchase order
attribute similarity score, the SKOS ontology
appears to contribute only a small amount to the
accuracy of the semantic matching. The low
correlation between the item list similarity scores
and the entity attribute similarity scores could be due
to problems in one or both of the following
assumptions.
A1: Purchase orders having similar attributes
will tend to have similar product lists.
A2: Matching of set contents using SKOS
ontologies is an accurate measure of that
similarity.
We can address assumption A1 by examining
correlations of item list similarity scores with other
entity attributes. Some possibilities include the time
and place of the purchase, and whether the purchaser
is a first-time or repeat customer.
We can test assumption A2 by using a more
powerful form of semantic reasoning, e.g. by using a
“heavy weight” ontology based on description logics
that supports semantic reasoning based on logical
inference to assess the similarity of the particular
relationships between the items in each purchase
order (Bellandi et al., 2007; Guo and Kraines 2008a).
6 FUTURE DIRECTIONS
The work reported here is part of a long-term effort
to assess the feasibility of getting human creators of
knowledge resources to create descriptors of those
resources in a form that can be “understood” by a
computer in the sense that we described in the
introduction (Kraines et al. 2006). It is usually
assumed that the people creating knowledge
resources are doing so for reasons unrelated to
computer-based knowledge sharing tasks such as
searching and matching, and therefore, the creators
of knowledge resources cannot be expected to do
any additional work to create computer-
understandable descriptors.
However, in the increasingly consumer-
dominated knowledge sharing marketplace where
eyes have become the scarce resource (Dzbor et al.
2007), we believe that in a growing number of
CanSKOSOntologiesImprovetheAccuracyofMeasuringSemanticSimilarityofPurchaseOrders?
253
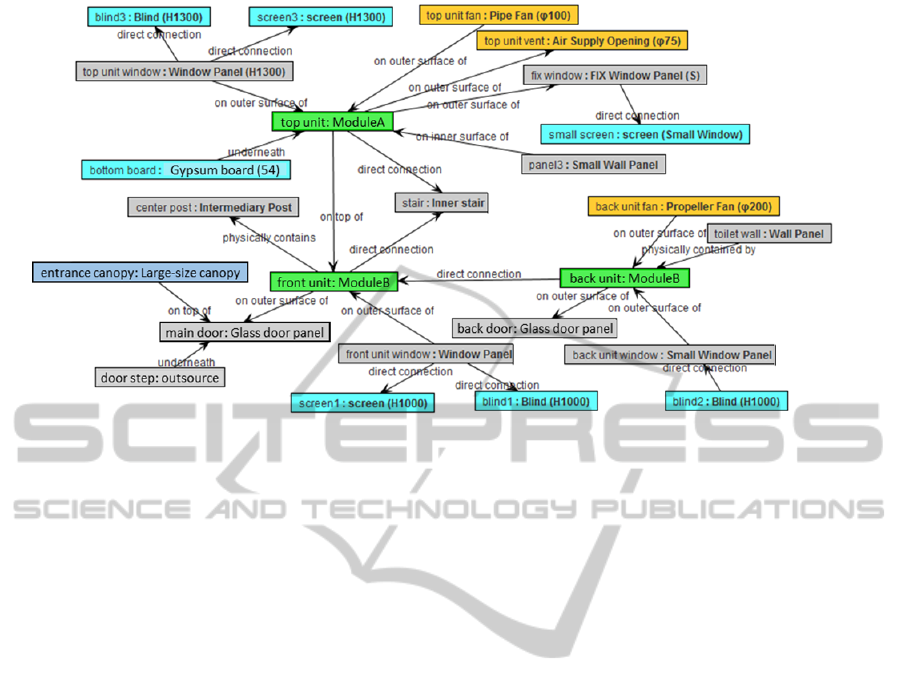
Figure 3: An example of a computer-understandable description of a modular building sale in the form of a semantic graph
grounded in a “heavy-weight” ontology. Boxes show instances of the ontology classes, with the class name on the right and
the instance name on the left. Box colors indicate types of classes. Arrows show object properties between instances.
knowledge sharing areas, individual knowledge
sharers perceive significant value from efforts to
make their shared resources easier for information
systems to process (a well-known and somewhat
notorious example of this is Search Engine
Optimization). In the context of the study reported
here, this might involve requiring salespersons from
the company to enter information about a particular
sale in a prescribed form that ensures that the
semantics of the sale order is preserved in a form
that can be “understood” by a computer.
For example, salespersons rely more and more
on tablet computers to provide information about a
particular purchase order to a new client. In the
modular building sector, a software application
might be available that enables the salesperson to
construct a 3D virtual representation of the building
that the client is considering. If the computer stores
the information on how the different parts of the
modular building are fitted together in a form that is
clear and rich enough to support semantic similarity
calculation using inference based on a heavy-weight
ontology, then when the salesperson works with the
client to design a new modular building, he or she
would be automatically creating a “computer-
understandable” description of the sale order, such
as the one shown in Figure 3.
The other side of getting creators of knowledge
resources to make computer-understandable
descriptors is to develop applications in areas that
directly benefit the knowledge creator, a concept
termed “instant gratification” by McDowell et al.
(2003). One example is natural language generation,
which can be used to generate accurate representa-
tions of the semantic graphs in any language that is
handled by the generator (Kraines and Guo, 2009;
Androutsopoulos et al. 2007).
Another is the application of knowledge mining
techniques to extract frequently occurring semantic
motifs from the knowledge base describing common
combinations of products (Guo and Kraines, 2010;
Guo and Kraines 2008b). Motifs, such as knowing
that most clients who selected a particular kind of
building module tended to purchase and directly
connect a particular kind of window to the building
modules, could help a salesperson identify additional
parts that should be included with a design selected
by the user but that might have been overlooked.
Additionally, we are considering how the semantic
similarity reported in this paper could be used as a
similarity measure for clustering item sets.
ACKNOWLEDGEMENTS
The author thanks Sankyo Frontier Co. for providing
data and funding, and Weisen Guo for coding part of
the program for calculating semantic similarity
based on SKOS ontologies.
REFERENCES
Agrawal, R., Imielinski, T., and Swami, A. 1993. Mining
KEOD2014-InternationalConferenceonKnowledgeEngineeringandOntologyDevelopment
254

association rules between sets of items in large
databases, In Proc. of the ACM SIGMOD Conference
on Management of Data, pp. 207-216.
Aleman-meza, B., Bojars, U., Boley, H., Breslin, J.G.,
Mochol, M., Nixon, L.J., Polleres, A., and Zhdanova,
A.V. 2007. Combining RDF vocabularies for expert
finding. In Proc 4th European Semantic Web Conf, pp.
235-250.
Androutsopoulos, I., Oberlander, J., and Karkaletsis, V.
2007. Source authoring for multilingual generation of
personalised object descriptions. Natural Language
Engineering, 13(3): 191-233.
Bechhofer, S., Yesilada, Y., Stevens, R., Jupp, S., and
Horan, B. 2008. Using Ontologies and Vocabularies
for Dynamic Linking. Internet Computing. IEEE
12(3): 32-39.
Bellandi, A., Furletti, B., Grossi, V., and Romei, A. 2007.
Ontology-driven association rule extraction: A case
study. In: Contexts and Ontologies Representation and
Reasoning, pp. 10-19.
Bizer, C., Heese, R., Mochol, M., Oldakowski, R.,
Tolksdorf, R., and Eckstein, R. 2005. The impact of
Semantic Web technologies on job recruitment
processes. In Proc 7th Intl Conf Wirtschaftsinformatik,
pp. 1367-1383.
Bizer, C., Lehmann, J., Kobilarov, G., Auer, S., Becker, C.,
Cyganiak, R., and Hellmann, S. 2009. DBpedia - A
crystallization point for the Web of Data. Web
Semantics: Science, Services and Agents on the World
Wide Web 7(3): 154-165.
Bleier, A., Zapilko, B., Thamm, M., and Mutschke, P.
2011. Using SKOS to integrate social networking sites
with scholarly information portals. SDoW2011 Social
Data on the Web, 830.
Breslin, J., O’Sullivan, D., Passant, A., and Vasiliu, L.
2010. Semantic Web computing in industry.
Computers in Industry, 61: 729-741.
Cai, M., Zhang, W. Y., and Zhang, K. 2011. ManuHub: a
semantic web system for ontology-based service
management in distributed manufacturing environ-
ments. IEEE Trans. on Sys & Humans, 41: 574-582.
Dong, H., Hussain, F. K., and Chang, E. 2013. Semantic
Web Service matchmakers: state of the art and
challenges. Concurrency and Computation: Practice
and Experience, 25: 961-988.
Dzbor, M., Motta, E., and Domingue, J. 2007. Magpie:
Experiences in supporting Semantic Web browsing,
Web Semantics: Science, Services and Agents on the
World Wide Web, 5(3): 204-222.
Fard, K. B, Nilashi, M., Rahmani, M., and Ibrahim, O.
2013. Recommender System Based on Semantic
Similarity. Intl Journal of Electrical and Computer
Engineering, 3: 751-761.
Guo, W. and Kraines S.B. 2008a. Explicit scientific
knowledge comparison based on semantic description
matching. Annual meeting of the ASIST 2008,
Columbus, Ohio.
Guo, W. and Kraines S.B. 2008b. Mining Common
Semantic Patterns from Descriptions of Failure
Knowledge, the 6th International Workshop on
Mining and Learning with Graphs, MLG2008,
Helsinki, Finland, July 4 - 5, 2008.
Guo, W. and Kraines S.B. 2010. Mining Relationship
Associations from Knowledge about Failures using
Ontology and Inference, In: P. Perner (Ed.): ICDM
2010, LNAI 6171, pp. 617-631.
Kraines, S. B. Guo, W., Kemper, B., and Nakamura, Y.
2006. EKOSS: A Knowledge-User Centered
Approach to Knowledge Sharing, Discovery, and
Integration on the Semantic Web. In: I. Cruz et al.
(Eds.), LNCS Vol.4273, ISWC 2006 pp. 833-846.
Kraines, S. B. and Guo, W.2009. Using human authored
Description Logics ABoxes as concept models for
Natural Language Generation, Annual Meeting of the
ASIST 2009, Vancouver, British Columbia, Canada.
Kraines, S. B. and Guo, W. 2011. A system for ontology-
based sharing of expert knowledge in sustainability
science. Data Science Journal, 9: 107-123.
Li, L. and Horrocks, I. 2004. A software framework for
matchmaking based on semantic web technology. Intl
Journal of Electronic Commerce, 8: 39-60.
McDowell, L., Etzioni, O., Gribble, S. D., Halevy, A.,
Levy, H., Pentney, W., and Vlasseva, S. 2003.
Mangrove: Enticing ordinary people onto the semantic
web via instant gratification. In Semantic Web-ISWC
2003, pp. 754-770.
Oldakowski, R. and Bizar, C. 2005. SemMF: A Frame-
work for Calculating Semantic Similarity of Objects
Represented as RDF Graphs. In: 4th Int. Semantic
Web Conference.
Pan, J., Cheng, C.-P.J., Lau, G.T., and Law, K.H. 2008.
Utilizing statistical semantic similarity techniques for
ontology mapping, Tsinghua Sci & Tech, 13:217-222.
Resnik, P. 1997. Semantic Similarity in a Taxonomy.
Journal of Artificial Intelligence Research, 11: 95-130.
Wang, X., Ni, Z., and Cao, H. 2007. Research on
Association Rules Mining Based-On Ontology in E-
Commerce. Intl Conf on Wireless Communications,
Networking and Mobile Computing, pp. 3549-3552.
Won, D., Song, B. M., and McLeod, D. 2006. An
approach to clustering marketing data. In: Proc 2nd
Intl Advanced Database Conference.
Zhong, J., Zhu, H., Li, J., and Yu, Y. 2002. Conceptual
Graph Matching for Semantic Search. Proc 10th Intl
Conf on Conceptual Structures. pp. 92-196.
CanSKOSOntologiesImprovetheAccuracyofMeasuringSemanticSimilarityofPurchaseOrders?
255
