
Altering the Granularity of Neutrality in a Multi-layered Genetic
Algorithm
Seamus Hill and Colm O’Riordan
College of Engineering and Informatics, National University of Ireland Galway, Galway, Ireland
Keywords:
Genetic Algorithms, Neutrality, Operators, Mutation, Diversity.
Abstract:
By adopting a basic interpretation of the biological processes of transcription and translation, the multi-
layered GA (MGA) introduces a genotype-phenotype mapping for a haploid genotype, which allows the gran-
ularity of the representation to be tuned. The paper examines the impact of altering the level of neutrality
through changes in the granularity of the representation and compares the performance of a standard GA
(SGA) to that of a number of multi-layered GAs, each with a different level of neutrality, over both static and
changing environments. Initial results indicate that it appears advantageous to include a multi-layered, biolog-
ically motivated genotype-phenotype encoding over more difficult landscapes. The paper also introduces an
interpretation of missense mutation, which operates within the genotype-phenotype map (GP-map). Results
also suggest that this mutation strategy can assist in tracking the optimum over various landscapes
1 INTRODUCTION
In standard GAs (SGA) variation is applied solely
to genetic structures and not to phenotypic structures
and each phenotype is represented by a distinct geno-
type. However, in nature we find a layered mapping
between the genotype and the phenotype and that one
phenotype can be represented by a number of differ-
ent genotypes. Also, in nature, although most varia-
tion happens at the DNA level, mutation can also oc-
cur at the RNA level. By introducing a many-to-one
GP-map into a GA you can represent these phenom-
ena. Furthermore, this map introduces a level of neu-
trality into the representation.
The paper examines the impact of varying the
level of neutrality by altering the granularity of the
representation and examining to see whether or not,
there are benefits associated with the inclusion of
variation within the layers of the GP-map. Variation
within the layers of the GP-map is achieved through
an implementation of a form of variation operator
found in biology, known as missense mutation. In
biology, a point mutation that changes a codon that
normally specifies a particular amino acid into one
that codes for a different amino acid is known as a
missense mutation. In a simplified summary of the
biological process the pathway from DNA to a pro-
tein includes a transcription stage, which maps DNA
to RNA and a translation stage which maps RNA to
proteins. Our intention is to include traditional varia-
tion operators (crossover/mutation) at the DNA level
and to incorporate an interpretation of missense mu-
tation at the RNA level. The motivation is to develop
a robust GA which includes a tunable GP-map and re-
sists premature convergence by incorporating redun-
dancy through the GP-map, while allowing the use
of a haploid binary representation. The contribution
comes firstly, from examining the impact of varying
the level of neutrality in the representation and sec-
ondly, from the analysis of a mutation strategy which
operates withing the GP-map.
The paper is organised as follows: Section 2
briefly examines previous research, Section 3 outlines
the workings of the multi-layered GA (MGA). Sec-
tion 4 gives an overview of the experiments, while
Section 5 describes the results and finally, Section 6,
discusses the conclusions.
2 BACKGROUND
A population’s ability to survive in various environ-
mental conditions often requires a level of diversity
to be maintained within the population. As a GA’s
search involves a mapping between the genotype and
the phenotype, with a SGA, diversity is quickly elim-
inated from the population through its selection pol-
icy and low mutation rates. Generally, two strate-
215
Hill S. and O’Riordan C..
Altering the Granularity of Neutrality in a Multi-layered Genetic Algorithm.
DOI: 10.5220/0005072302150222
In Proceedings of the International Conference on Evolutionary Computation Theory and Applications (ECTA-2014), pages 215-222
ISBN: 978-989-758-052-9
Copyright
c
2014 SCITEPRESS (Science and Technology Publications, Lda.)
gies are used to modify a SGA in order to improve
it’s adaptiveness in a changing landscape (Grefen-
stette and Cobb, 1993): introduce increased memory
to store responses for a environmental changes or use
a method to increase diversity within the population
i.e. increase mutation (Grefenstette and Cobb, 1993).
However, by implicitly introducing neutrality into the
GP-map, the level of diversity within the population
can be maintained and can assist in tracking the opti-
mum over a number of different landscapes (Hill and
O’Riordan, 2011).
Deception is often used in testing GAs and implies
that the search strategy can be misled (Whitley, 1991).
As noted in (Morrison and DeJong, 2002), diversity
is critical for GAs, particularly when the landscape is
evolving as recombining a homogeneous population
will not enable the GA to locate the new optimum.
Hamming difference is used as a measure of diver-
sity both for the genotypic and phenotypic diversity.
In this paper we use a 30-bit and a 90-bit One Max
max problem to examine the performance of the GAs
over static landscapes and to examine how the GAs
perform over a changing landscape we use a three-
bit problem, introduced by (Whitley, 1991), which we
expand into a thirty-bit problem, as outlined in (Gold-
berg et al., 1990).
The MGA introduces a tunable multi-layered GP-
map, which allows a haploid GA to exhibit, some of
the characteristics normally associated with a diploid
i.e. a mechanism for allowing alleles or combinations
of alleles which proved useful in previous generations
(Goldberg and Smith, 1987) and thus maintaining a
form of long term memory, without the need to de-
velop a dominance scheme. The MGA population
consists of a population of haploid individuals, which
allows for the use of traditional crossover and muta-
tion variation operators on the genotype. This differs
from the approach used by diploid GAs (DGAs) i.e.
(Yang, 2006), where each individual has two chro-
mosomes and crossover is divided into two steps and
mutation is viewed as being neutral. Another differ-
ence between the MGA mapping and that of a DGA,
is that in the DGA, a phenotype allele is made up from
a single genotype allele which is expressed. In the
MGA a single phenotype allele is made from the car-
dinality incorporated in the genotype i.e. in this pa-
per 4-bits, 6-bits or 8-bits. Although the MGA’s GP-
map is non-deterministic, the approach differs from
that of real-coded binary representation, which incor-
porate a gene-strength adjustment mechanism (Kuba-
lik, 2005). Real-coded binary representations can
use standard crossover operators, but mutation is im-
plicit due to the gene-strength adjustment mechanism
(Kubalik, 2005).
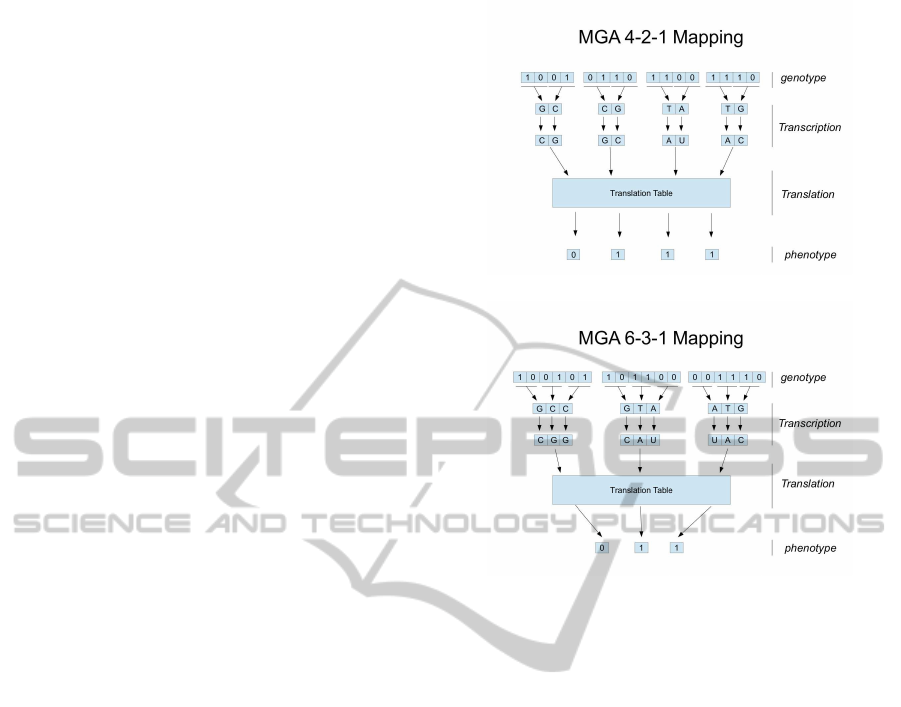
Figure 1: 4-2-1 MGA Representation Mapping.
Figure 2: 6-3-1 MGA Representation Mapping.
3 MULTI-LAYERED GA (MGA)
The transcription phase of the MGA maps, in two
steps, the binary genotype to a string of characters
taken from a four letter alphabet A,C, G and T. The
mapping is carried out as follows 00 → A; 01 → C;
10 → G and 11 → T. Once the initial mapping is
complete, variation takes place amongst the charac-
ters, which may be viewed as a unique form of in-
version. The mappings for this stage are A → U;
C → G; G → C and T → A. Following transcription,
the translation phase takes place. Upon initialisation,
the MGA creates a translation table, using characters
taken from a four letter alphabet A,C,G and U, based
on the granularity of the neutrality selected by the
user. T and U are used for biological plausibility and
are interchangable. In this paper we tune the MGA
to use three different representations and examine the
impact of altering the granularity: a 4-bit MGA rep-
resentation; a 6-bit MGA representation and an 8-bit
MGA representation. The size of the translation ta-
ble is determined by the representation chosen. For a
4-bit MGA representation, a translation table of 2
4
is
created; with a 6-bit MGA representation a 2
6
trans-
lation table is needed and with an 8-bit MGA repre-
sentation a 2
8
translation table is required. The size
of the translation table represents the granularity of
ECTA2014-InternationalConferenceonEvolutionaryComputationTheoryandApplications
216
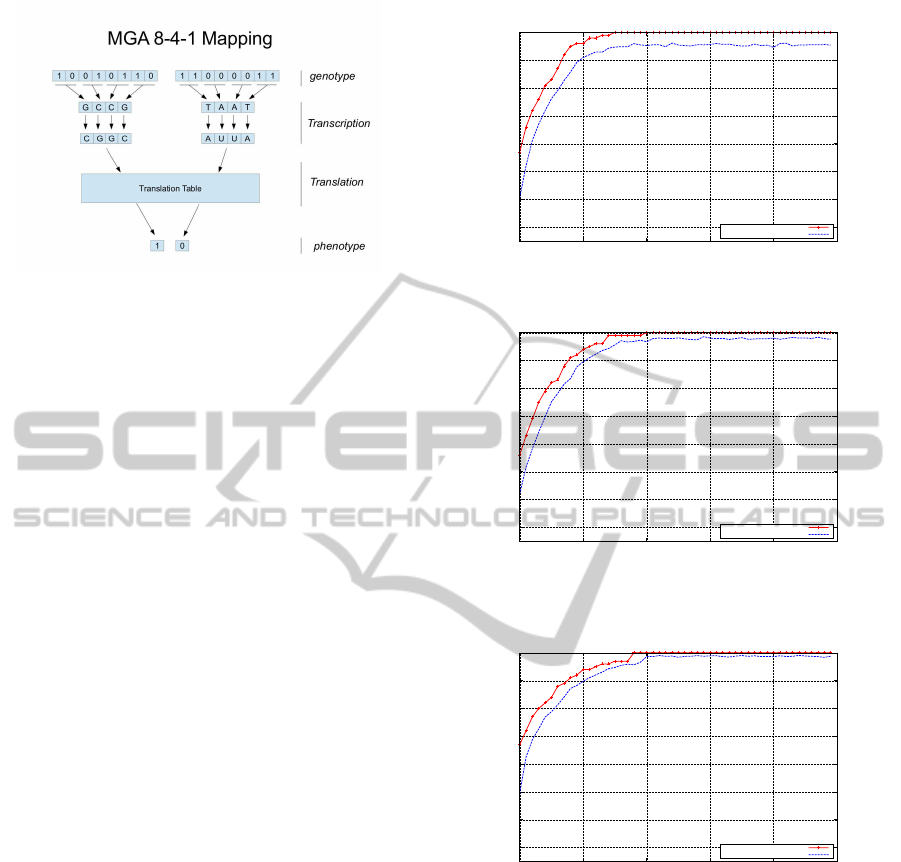
Figure 3: 8-4-1 MGA Representation Mapping.
neutrality which exists within the representation. A
4-bit MGA representation requires 4 bits for each in-
dividual element of the phenotype, which we refer to
as a phene; a 6-bit MGA representation requires 6 bits
for each phene and an 8-bit representation requires 8
bits for each phene. A form of neighbourhood equiv-
alence is used in the translation phase, to map a pre-
defined number of characters to a given phene, in this
paper either a 0 or a 1. Figures 1, 2 and 3 represent
a 4-bit MGA representation, a 6-bit MGA represen-
tation and an 8-bit MGA representation respectively.
For a more detailed explanation of the MGA see (Hill
and O’Riordan, 2011). Missense mutation takes place
between the transcription and translation phases. This
form of mutation flips a character form the four letter
alphabet A,C, G and U, i.e. A can be flipped to either
C, G or U etc.
4 EXPERIMENTS
Experiments were carried out over both a One Max
problem static landscape and a deceptive changing
landscape. As we intend to examine the relationship
between altering the granularity of the MGA repre-
sentation (which determines the level of neutrality)
and problem difficulty, experiments are carried out
over increasingly difficult landscapes. The One Max
problem experiments include 30-bit and 90-bit prob-
lems, while the deceptive changing landscape exper-
iments use a ten 3-bit fully deceptive changing land-
scape and a more difficult thirty 3-bit fully deceptive
changing landscape. The parameters for the experi-
ments are as follows: one-point crossover is used at
a rate of 0.7, single-point mutation is used at a rate
of 1/l, where l is the length of the chromosome and
missense mutation is at a rate of 5/r where r is the
length of the RNA string. The population consisted
of 200 individuals, with the experiment results being
averaged over 10 runs.
16
18
20
22
24
26
28
30
0 10 20 30 40 50
Fitness
Generations
30-bit One Max - Online/Offline Performance Analysis - SGA Representation
Off-line Performance
On-line Performance
Figure 4: SGA - 30-Bit One Max Static Landscape.
16
18
20
22
24
26
28
30
0 10 20 30 40 50
Fitness
Generations
30-bit One Max - Online/Offline Performance Analysis - 4-Bit MGA Representation
Off-line Performance
On-line Performance
Figure 5: MGA 4-2-1 Representation 30-Bit One Max
Static Landscape.
16
18
20
22
24
26
28
30
0 10 20 30 40 50
Fitness
Generations
30-bit One Max - Online/Offline Performance Analysis - 6-Bit MGA Representation
Off-line Performance
On-line Performance
Figure 6: MGA 6-3-1 Representation 30-Bit One Max
Static Landscape.
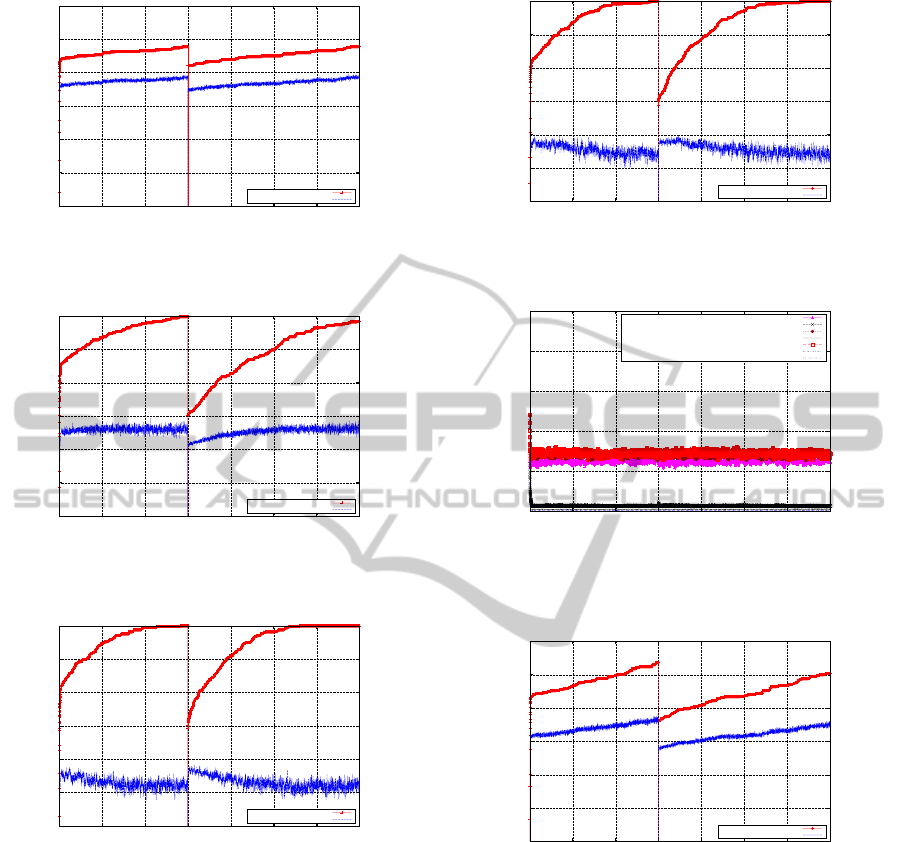
5 RESULTS
5.1 30-bit One Max Problem
Figures 4, 5, 6 and 7 compare the average-best (off-
line) and the average (on-line) performance of an
SGA against a number of different MGA represen-
tations over a 30-bit One Max problem. Overall, al-
though there is little difference in the performance of
the SGA against that of the variously tuned MGAs,
with the SGA performing marginally better in the off-
line results and marginally worse in the on-line per-
AlteringtheGranularityofNeutralityinaMulti-layeredGeneticAlgorithm
217
formance. Of the three MGA representations, the
6 − 3 − 1 representation produces a relatively simi-
lar off-line performance to the SGA, but returns a
marginallt better on-line performance.
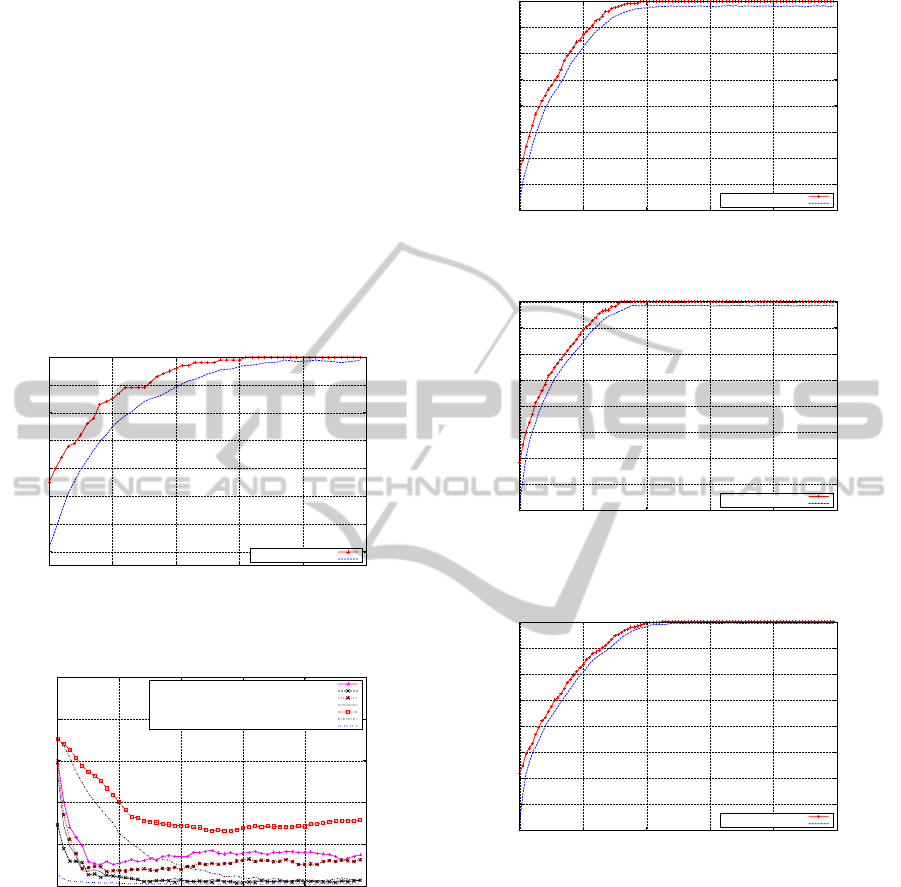
Figure 8 compares the levelof diversity in the pop-
ulation between the SGA and the MGA representa-
tions. The SGA phenotypic diversity is similar to that
of the MGA, however there is a significant difference
between the genotypic diversity of the MGA repre-
sentations with that of the SGA. The above results
indicate that although there is little difference in the
off-line results of the various GA’s, the MGA’s on-
line performances are marginally better than those of
the SGA, this may be a result of a greater level geno-
typic diversity associated with the MGA.
16
18
20
22
24
26
28
30
0 10 20 30 40 50
Fitness
Generations
30-bit One Max - Online/Offline Performance Analysis - 8-Bit MGA Representation
Off-line Performance
On-line Performance
Figure 7: MGA 8-4-1 Representation 30-Bit One Max
Static Landscape.
0
0.02
0.04
0.06
0.08
0.1
0 10 20 30 40 50
Diversity
Generations
30-bit One Max Population Diversity Analysis
Multi-layered 4-2-1 GA - Genotype Diversity
Multi-layered 4-2-1 GA - Phenotype Diversity
Multi-layered 6-3-1 GA - Genotype Diversity
Multi-layered 6-3-1 GA - Phenotype Diversity
Multi-layered 8-4-1 GA - Genotype Diversity
Multi-layered 8-4-1 GA - Phenotype Diversity
SGA - Genotype/Phenotype Diversity
Figure 8: Diversity 30-Bit One Max SGA & MGA.
5.2 90-bit One Max Problem
As we increased the level of difficulty to a 90-bit One
Max problem (illustrated in Figures 9, 10, 11 and
12), the performance of both the SGA and the vari-
ous MGA’s are again quite similar in terms of off-line
performance. Although there may be a very marginal
improvement in the on-line performance of the MGA
over the SGA. Population diversity for the SGA and
MGA representations is shown in Figure 13. As with
diversity in the 30-bit One Max experiments, there is
little difference at the phenotypic level, which is what
50
55
60
65
70
75
80
85
90
0 20 40 60 80 100
Fitness
Generations
90-bit One Max - Online/Offline Performance Analysis - SGA
Off-line Performance
On-line Performance
Figure 9: SGA 90-Bit One Max Static Landscape.
50
55
60
65
70
75
80
85
90
0 20 40 60 80 100
Fitness
Generations
90-bit One Max - Online/Offline Performance Analysis - 4-Bit MGA Representation
Off-line Performance
On-line Performance
Figure 10: MGA 4-2-1 Representation 90-Bit One Max
Static Landscape.
50
55
60
65
70
75
80
85
90
0 20 40 60 80 100
Fitness
Generations
90-bit One Max - Online/Offline Performance Analysis - 6-Bit MGA Representation
Off-line Performance
On-line Performance
Figure 11: MGA 6-3-1 Representation 90-Bit One Max
Static Landscape.
we would expect, however there is a difference at the
genotypic level, with the MGA variations maintain-
ing a far higher level of diversity that that of the SGA,
which has converged.
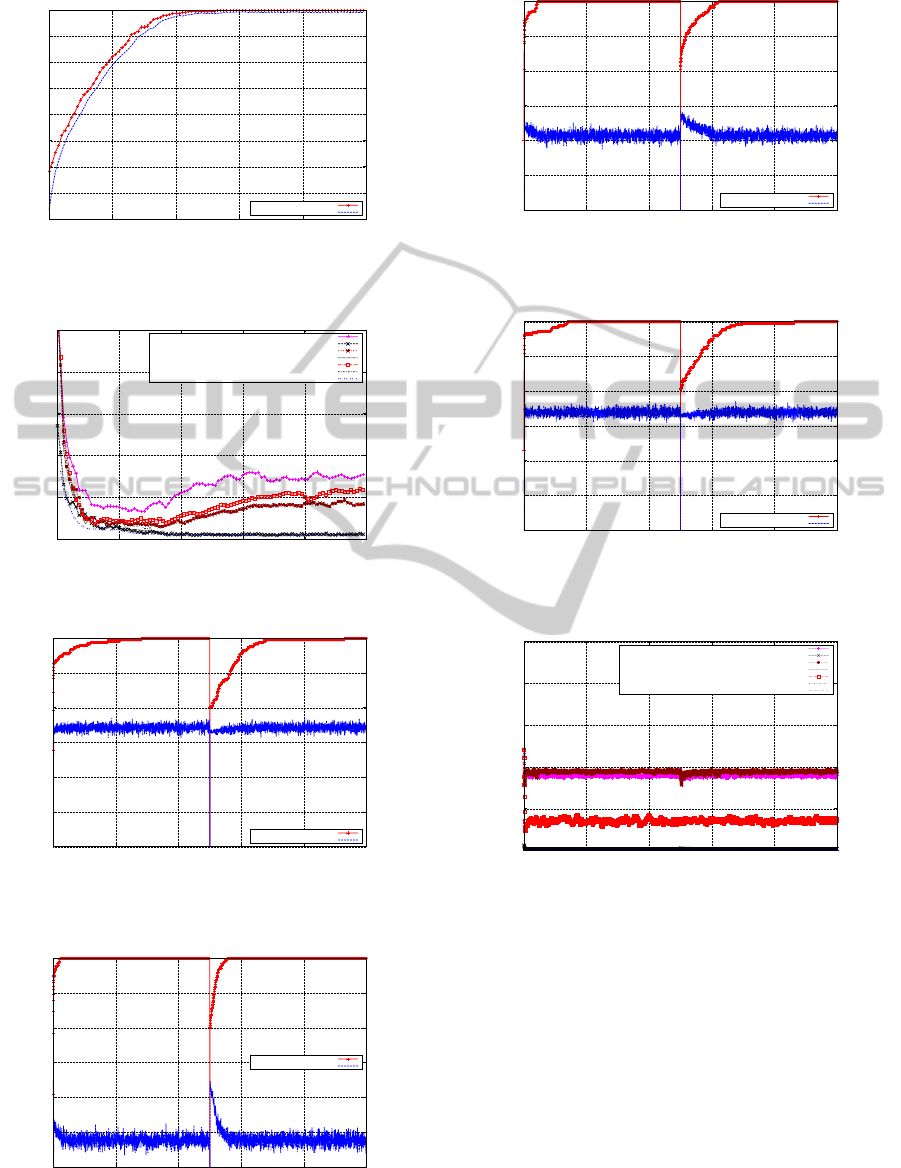
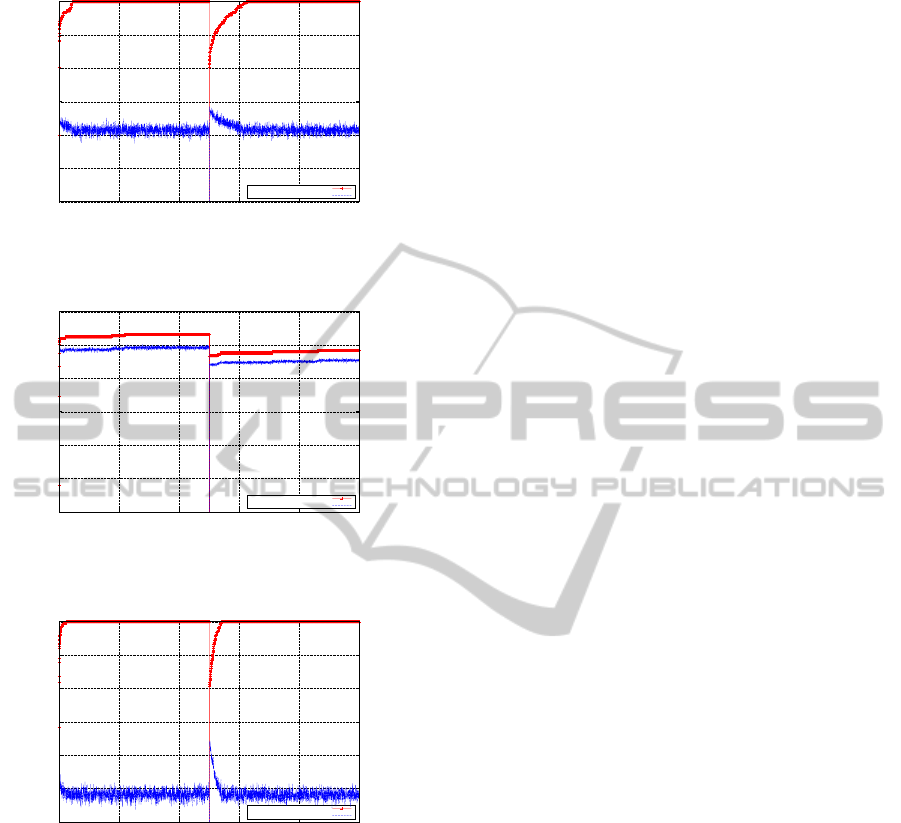
5.3 Ten 3-bit Fully Deceptive Changing
Landscape Problem
Figures 14, 15, 16 and 17 show the results of the SGA
and the various MGA representations. As the problem
landscape is comparatively easy, both the SGA and
the various MGA representations, found the global
optimum before and after the landscape changed, il-
ECTA2014-InternationalConferenceonEvolutionaryComputationTheoryandApplications
218
50
55
60
65
70
75
80
85
90
0 20 40 60 80 100
Fitness
Generations
90-bit One Max - Online/Offline Performance Analysis - 8-Bit MGA Representation
Off-line Performance
On-line Performance
Figure 12: MGA 8-4-1 Representation 90-Bit One Max
Static Landscape.
0
0.02
0.04
0.06
0.08
0.1
0 20 40 60 80 100
Diversity
Generations
90-bit One Max Population Diversity Analysis
Multi-layered 4-2-1 GA - Genotype Diversity
Multi-layered 4-2-1 GA - Phenotype Diversity
Multi-layered 6-3-1 GA - Genotype Diversity
Multi-layered 6-3-1 GA - Phenotype Diversity
Multi-layered 8-4-1 GA - Genotype Diversity
Multi-layered 8-4-1 GA - Phenotype Diversity
SGA - Genotype/Phenotype Diversity
Figure 13: Diversity 90-Bit One Max SGA & MGA.
240
250
260
270
280
290
300
0 1000 2000 3000 4000 5000
Fitness
Generations
Ten 3-bit Deceptive Changing Environment - Online/Offline Performance Analysis - SGA
Off-line Performance
On-line Performance
Figure 14: SGA - Ten 3-Bit Fully Deceptive Changing
Landscape.
240
250
260
270
280
290
300
0 1000 2000 3000 4000 5000
Fitness
Generations
Ten 3-bit Deceptive Changing Environment - Online/Offline Performance Analysis - 4-Bit MGA Representation
Off-line Performance
On-line Performance
Figure 15: 4-2-1 MGA Representation - Ten 3-Bit Fully
Deceptive Changing Landscape.
240
250
260
270
280
290
300
0 1000 2000 3000 4000 5000
Fitness
Generations
Ten 3-bit Deceptive Changing Environment - Online/Offline Performance Analysis - 6-bit MGA Representation
Off-line Performance
On-line Performance
Figure 16: 6-3-1 MGA Representation - Ten 3-Bit Fully
Deceptive Changing Landscape.
240
250
260
270
280
290
300
0 1000 2000 3000 4000 5000
Fitness
Generations
Ten 3-bit Deceptive Changing Environment - Online/Offline Performance Analysis - MGA
Off-line Performance
On-line Performance
Figure 17: 8-4-1 MGA Representation - Ten 3-Bit Fully
Deceptive Changing Landscape.
0
0.2
0.4
0.6
0.8
1
0 1000 2000 3000 4000 5000
Diversity
Generations
Ten 3-bit Deceptive Changing Environment - Population Diversity Analysis
Multi-layered 4-2-1 GA - Genotype Diversity
Multi-layered 4-2-1 GA - Phenotype Diversity
Multi-layered 6-3-1 GA - Genotype Diversity
Multi-layered 6-3-1 GA - Phenotype Diversity
Multi-layered 8-4-1 GA - Genotype Diversity
Multi-layered 8-4-1 GA - Phenotype Diversity
SGA - Genotype/Phenotype Diversity
Figure 18: Diversity Ten 3-bit Fully Deceptive Changing
Landscape Problem SGA & MGA.
lustrating that they both managed to adapt. However,
the results indicate that all of the MGA representa-
tions out performed the SGA is terms of locating the
global optimum earlier in the search. With the per-
formance improving as the level of granularity de-
creased. Examining the population diversity, we can
see in Figure 18 that there is a significant difference
between the SGA and MGA in relation to the main-
tenance of diversity within the population. Although
the phenotypic diversities are relatively similar, there
is a greater level of genotypic diversity maintained
in the MGA representations. Whats interesting here
is that the level of genotypic diversity maintained by
AlteringtheGranularityofNeutralityinaMulti-layeredGeneticAlgorithm
219
240
250
260
270
280
290
300
0 1000 2000 3000 4000 5000
Fitness
Generations
Ten 3-Bit Deceptive Changing Environment - Online/Offline - 6-bit MGA Representation - No Transcription
Off-line Performance
On-line Performance
Figure 19: 6-3-1 MGA Representation - Ten 3-Bit Decep-
tive Problem - No Transcription.
240
250
260
270
280
290
300
0 1000 2000 3000 4000 5000
Fitness
Generations
Ten 3-Bit Deceptive Changing Environment - Online/Offline - 6-bit MGA Representation - No Missense
Off-line Performance
On-line Performance
Figure 20: 6-3-1 MGA Representation - Ten 3-Bit Decep-
tive Problem - No Missense.
240
250
260
270
280
290
300
0 1000 2000 3000 4000 5000
Fitness
Generations
Ten-3 Bit Deceptive Changing Landscape - Online/Offline - Increased Mutation - SGA
Off-line Performance
On-line Performance
Figure 21: Ten 3-Bit Deceptive Problem - SGA - Increased
Mutation.
the 8-4-1 MGA representation was less than the MGA
variations, this may account for it’s relatively poorer
performance.
To develop an understanding of the impact of the
transcription phase on the MGA, we ran an experi-
ment using a 6-bit MGA representation without tran-
scription. The results in Figure 19 show that although
the search locates the global optimum, the perfor-
mance was similar to the results achieved using tran-
scription. However, this may indicate that the tran-
scription phase has a minor impact prior to the transla-
tion phase, but further experiments over more difficult
landscapes may assist in understanding the impact of
transcription.
Figure 20 shows the results of not including the
missense mutation operator. Even on the relatively
easy ten three-bit landscape, the 6-bit MGA repre-
sentation fails in its search for the global optimum,
indicating that the missense mutation strategy assists
in tracking the optimum over a changing landscape
and without it the search struggles to escape from a
deceptive attractor. To examine whether the results
found by using the multi-layered MGA can be repli-
cated by increasing the level of mutation in the SGA,
we ran another set of experiments where we increased
the level of mutation, as a method to increasing di-
versity (Grefenstette and Cobb, 1993), in the SGA to
2/l. The results shown in Figure 21 illustrate that in
comparison to Figure 14, the extra mutation has im-
proved the performance of the SGA. However, it is
worth noting that the off-line performance is lower,
which is a result of the increased level of mutation
and may prove problematic in a more challenging en-
vironment.
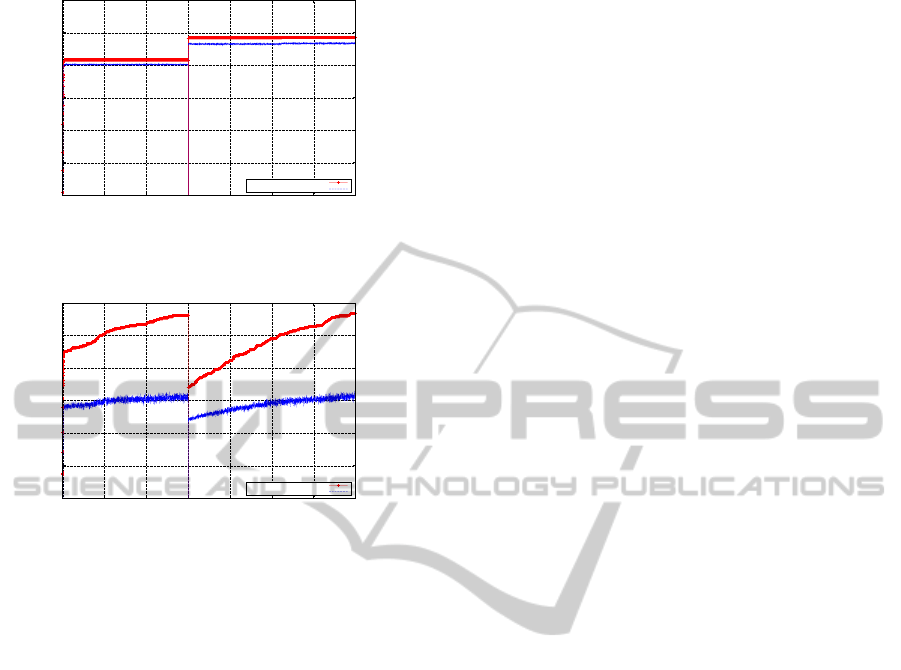
5.4 Thirty 3-bit Fully Deceptive
Changing Landscape Experiments
Over the more difficult fully deceptive landscape the
SGA attempts to locate the global optimum of 900,
but fails, both before and after the landscape changes,
see Figure 22. In contrast to this Figures 23, 24 and 25
show an improvedperformance from the MGA repre-
sentations and although the 6 − 3 − 1 and 8 − 4 − 1
representations were successful, both before and after
the landscape changed, the 4− 2− 1 MGA represen-
tationi, however,failed to recover sufficiently after the
landscape changed, indicating that the adaptive qual-
ity of the MGA may lessen as the level of granular-
ity in the representation decreases over more difficult
changing landscapes.
As with previous results the level of phenotypic
diversity maintained by the various GAs remains
quite similar (see Figure 26). However, the level of
genotypic diveristy maintained by the MGA represen-
tations is again greater that that of the SGA. Over this
deceptive changing landscape, the levels of genotypic
diversity maintained by the MGA representations are
quite similar to one another. This may explain their
relatively similar performances over the landscapes.
To understand the impact of transcription over a more
difficult landscape, we ran an experiment using a 6-bit
MGA representation, without the transcription phase,
illustrated in Figure 27. The results indicate that the
6− 3− 1 MGA representation fails to locate the global
optimum. This result differs from out previous exper-
iment, shown in Figure 19, suggesting over the more
difficult landscape the transcription phase assists in
ECTA2014-InternationalConferenceonEvolutionaryComputationTheoryandApplications
220
780
800
820
840
860
880
900
0 1000 2000 3000 4000 5000 6000 7000
Fitness
Generations
Thirty 3-bit Deceptive Changing Environment - Online/Offline Performance - SGA
Off-line Performance
On-line Performance
Figure 22: Thirty 3-Bit Fully Deceptive Changing Land-
scape SGA.
780
800
820
840
860
880
900
0 1000 2000 3000 4000 5000 6000 7000
Fitness
Generations
Thirty 3-bit Deceptive Changing Landscape - Online/Offline - 4-Bit MGA Representation
Off-line Performance
On-line Performance
Figure 23: Thirty 3-Bit Fully Deceptive Changing Land-
scape 4-2-1 MGA Representation.
780
800
820
840
860
880
900
0 1000 2000 3000 4000 5000 6000 7000
Fitness
Generations
Thirty 3-bit Deceptive Changing Landscape - Online/Offline - 6-bit MGA Representation
Off-line Performance
On-line Performance
Figure 24: Thirty 3-Bit Fully Deceptive Changing Land-
scape 6-3-1 MGA Representation.
the search strategy. One reason for this maybe that
the transcription phase provides a form of inversion,
which assists the search strategy over more difficult
changing landscape.
By removing missense mutation, we hope to de-
velop a better understanding of it’s impact over a
more difficult environment. Figure 28 shows that the
6− 3− 1 MGA representation fails to escape the de-
ceptive attractor throughout the search. In a similar
way to the results shown in Figure 20, there appears
to be too little variation, probably due to quite low
mutation rates, in the population.
In order to establish whether the SGA may im-
prove its performance with a higher level of diversity
780
800
820
840
860
880
900
0 1000 2000 3000 4000 5000 6000 7000
Fitness
Generations
Thirty 3-bit Deceptive Changing Environment - Online/Offline Performance - 8-bit MGA Representation
Off-line Performance
On-line Performance
Figure 25: Thirty 3-Bit Fully Deceptive Changing Land-
scape 8-4-1 MGA Representation.
0
0.2
0.4
0.6
0.8
1
0 1000 2000 3000 4000 5000 6000 7000
Diversity
Generations
Thirty 3-bit Deceptive Changing Environment - Population Diversity Analysis
Multi-layered 4-2-1 GA - Genotype Diversity
Multi-layered 4-2-1 GA - Phenotype Diversity
Multi-layered 6-3-1 GA - Genotype Diversity
Multi-layered 6-3-1 GA - Phenotype Diversity
Multi-layered 8-4-1 GA - Genotype Diversity
Multi-layered 8-4-1 GA - Phenotype Diversity
SGA - Genotype/Phenotype Diversity
Figure 26: Thirty 3-bit Fully Deceptive Changing Land-
scape Problem SGA & MGA Representation Population
Diversity.
780
800
820
840
860
880
900
0 1000 2000 3000 4000 5000 6000 7000
Fitness
Generations
Thirty 3-Bit Deceptive Changing Landscape - Online/Offline - 6-Bit MGA Representation No Transcription
Off-line Performance
On-line Performance
Figure 27: 6-3-1 MGA Representation - Thirty 3-Bit De-
ceptive Problem - No Transcription.
we increased the level of mutation. However, over the
more difficult landscape, the SGA fails to locate the
global optimum, shown in Figure 29. This appears to
indicate that even with a higher level of diversity as-
sociated with higher mutation, the search strategy of
the SGA fails over the given landscape.
5.5 Statistical Significance
A two-sided paired Wilcoxon signed rank test was
carried out on the results of each experiment and were
shown to be highly significant with a P − value of
p < 2.2e − 16 recorded for each of the experiments
illustrated in the paper.
AlteringtheGranularityofNeutralityinaMulti-layeredGeneticAlgorithm
221
780
800
820
840
860
880
900
0 1000 2000 3000 4000 5000 6000 7000
Fitness
Generations
Thirty 3-Bit Deceptive Changing Landscape - Online/Offline - 6-Bit MGA Representation - No Missense
Off-line Performance
On-line Performance
Figure 28: 6-3-1 MGA Representation - Thirty 3-Bit De-
ceptive Problem - No Missense.
780
800
820
840
860
880
900
0 1000 2000 3000 4000 5000 6000 7000
Fitness
Generations
Thirty-3 Bit Deceptive Changing Landscape - Online/Offline - Increased Mutation - SGA
Off-line Performance
On-line Performance
Figure 29: Thirty 3-Bit Deceptive Problem - SGA - In-
creased Mutation.
6 CONCLUSION
From the above experiments the results indicate that
overall the MGA appears robust over both static and
changing landscapes. By incorporating a tunable GP-
map, the MGA offers the ability to vary the gran-
ularity of the representation, which appears benefi-
cial over various landscapes and the performance of
the MGA varies slightly depending on the level of
granularity in the representation. Over the static One
Max landscapes, the MGAs off-line and on-line per-
formances were quite similar to those of the SGA
over both the easier 30-bit problem and the more dif-
ficult 90-bit problem. On reason for this is that the
problem, by its nature, is relatively easy for a GA to
solve. What is of interest is that the MGA, in terms
of robustness, performed as well as the SGA. How-
ever, over the deceptive changing landscape experi-
ments the MGA outperformed the SGA, both on-line
and off-line, particularly over the more difficult ten 3-
bit deceptive problem. In relation to the use of Tran-
scription, it appear from the results that the advan-
tage of this phase is not apparent over less difficult
landscapes, but once the level of difficulty increases,
as with the more difficult deceptive problem, Tran-
scription proved useful. one possible reason for this
is that the Transcription phase performs a form varia-
tion, quite similar to inversion.
The inclusion of a missense mutation operator,
which operated at the RNA level, results indicated
that it assisted in the search strategy, over both diffi-
cult and less difficult landscapes. To examine whether
this was a result of additional mutation, we carried
out experiments which increased the mutation rate
for the SGA and results indicated that over the more
challenging deceptive landscape additional mutations
failed to assist the search strategy. This we feel, indi-
cates that the use of missense mutation, which oper-
ates at levels within the GP-map may be beneficial.
To conclude, the inclusion of a biologically in-
spired tunable GP-map which allows the granular-
ity of the GP-map to be altered appears to assist in
searching various landscapes and further research into
the levels of diversity maintained and population dy-
namics by the various MGA representations is re-
quired to gain a greater understanding.
REFERENCES
Goldberg, D. E., Korb, B., and Deb, K. (1990). Messy
genetic algorithms: Motivation, analysis, and first re-
sults. Complex Systems, 3(5):493–530.
Goldberg, D. E. and Smith, R. E. (1987). Nonstationary
function optimization using genetic algorithm with
dominance and diploidy. In Proceedings of the 2nd
International Conf. on Genetic Algorithms on Ge-
netic Algorithms and Their Application, pages 59–68,
Hillsdale, NJ, USA. L. Erlbaum Associates Inc.
Grefenstette, J. J. and Cobb, H. G. (1993). Genetic algo-
rithms for tracking changing environments. In Proc.
of the 5th Int. Conf. on Genetic Algorithms and their
Applications, pages 523–530. Morgan Kaufmann.
Hill, S. and O’Riordan, C. (2011). Examining the use of a
non-trivial fixed genotype-phenotype mapping in ge-
netic algorithms to induce phenotypic variability over
deceptive uncertain landscapes. In Proceedings of the
2011 Congress of Evolutionary Computation (CEC
2011). New Orleans, USA.
Kubalik, J. (2005). Using genetic algorithms with real-
coded binary representation for solving non-stationary
problems. In Ribeiro, B., Albrecht, R. F., Dobnikar,
A., Pearson, D. W., and Steele, N., editors, Adaptive
and Natural Computing Algorithms, pages 222–225.
Springer Vienna.
Morrison, R. W. and DeJong, K. A. (2002). Measurement
of population diversity. In In 5th International Con-
ference EA, 2001, volume 2310 of Incs. Springer.
Whitley, L. D. (1991). Fundamental principles of deception
in genetic search. In Rawlins, G. J., editor, Founda-
tions of genetic algorithms, pages 221–241. Morgan
Kaufmann, San Mateo, CA.
Yang, S. (2006). On the design of diploid genetic algorithms
for problem optimization in dynamic environments.
In Evolutionary Computation, 2006. CEC 2006. IEEE
Congress on, pages 1362–1369.
ECTA2014-InternationalConferenceonEvolutionaryComputationTheoryandApplications
222
