
Partial Fingerprint Identification Through Correlation-based Approach
Omid Zanganeh, Nandita Bhattacharjee and Bala Srinivasan
Clayton School of Information Technology, Monash University, Clayton, Australia
Keywords:
Biometric, Partial Fingerprint, Identification, Authentication, Local Correlation Matching Technique.
Abstract:
Partial fingerprints are likely to be fragmentary or low quality, which mandates the development of accu-
rate fingerprint verification algorithms. Two fingerprints should be aligned properly, in order to measure the
similarity between them. Moreover, the common fingerprint recognition methods (minutiae-based) only use
the limited information that is available. This affects the reliability of the output of the fingerprint recogni-
tion system, especially when dealing with partial fingerprints. To overcome this drawback, in this research, a
region-based fingerprint recognition method is proposed in which the fingerprints are compared in a pixel-wise
manner by computing their correlation coefficient. Therefore, all the attributes of the fingerprint contribute
in the matching decision. Such a technique is promising to accurately recognise a partial fingerprint as well
as a full fingerprint compared to the minutiae-based fingerprint recognition methods which only concentrate
on parts of the fingerprint. The proposed method is based on simple but effective metrics that has been de-
fined to compute local similarities which is then combined into a global score and then used to make the
match/non-match decision. Extensive experiments over FVC2002 data set has proven the superiority of our
method compared to the other well-known techniques reported in literature.
1 INTRODUCTION
Fingerprint is an impression left by the friction
ridges of a person’s fingertip. It is one of the most
well-known biometrics due to its uniqueness and
consistency. Although the fingerprint uniqueness is
accepted based on a manual inspection (by experts),
its consistency has been proven by morphogenesis of
friction ridge skin (Pankanti et al., 2002). Tradition-
ally, fingerprint had been widely used and associated
with criminal investigation, but now it has become
more popular in other areas such as civil application
(access control, financial security, etc.) as well
(Vaidehi et al., 2010). Although a lot of effort has
been put in the past 30 years to end up with a reliable
automated system, we are still far from the good.
A number of factors which cause bottlenecks
towards achieving desired system performance are:
lack of reliable feature extraction algorithms, diffi-
culty in accurately aligning the fingerprints and also
in defining a reliable similarity measurement between
fingerprints (Vaidehi et al., 2010). In addition,
fingerprint individuality is empirically accepted, but
fingerprint recognition is a difficult task, mainly
due to the large intra-class (a.k.a. within-finger)
variation and large inter-class (a.k.a. between-finger)
similarity in fingerprints. Intra-class variation occurs
when fingerprints are slightly different each time
they are captured. So different impressions of the
same finger are not identical; likewise, inter-class
similarity refers to quite similar fingerprint impres-
sions which are from different fingers (Maltoni et al.,
2009). Intra-class variation is mainly caused due to
partial overlap, non-linear distortion, sensor noise
(Nandakumar and Jain, 2004; Parziale, 2008; Labati
et al., 2014), and intentionally altering the fingerprint
(Yoon et al., 2012). Non-linear distortion introduced
during fingerprint sensing is certainly one of the
most critical intra-class variability (Maltoni et al.,
2009). It is produced by non-orthogonal pressure of
the finger against the fingerprint scanner. The act
of sensing maps the 3-dimensional shape of a finger
onto the 2-dimensional surface of the sensor results
in non-linear distortion in successive acquisitions of
the same finger due to skin elasticity (Maltoni et al.,
2009). Presence of noise in the fingerprint images
could be due to the dirty fingers which also contribute
to the intra-class variations (Nandakumar and Jain,
2004). Intentionally altering the fingerprint is usually
done by criminals to hide their identity (Soweon
et al., 2012).
Researchers proposed numerous fingerprint
matching techniques which can be coarsely cate-
gorised into three major groups (Maltoni et al., 2009;
275
Zanganeh O., Bhattacharjee N. and Srinivasan B..
Partial Fingerprint Identification Through Correlation-Based Approach.
DOI: 10.5220/0005045302750284
In Proceedings of the 11th International Conference on Security and Cryptography (SECRYPT-2014), pages 275-284
ISBN: 978-989-758-045-1
Copyright
c
2014 SCITEPRESS (Science and Technology Publications, Lda.)

Donida Labati and Scotti, 2011): Minutiae-Based
( i.e. (Kovacs-Vajna, 2000; Tico and Kuosmanen,
2003; Chen et al., 2005; Liu et al., 2005; Gao et al.,
2011)), Non-Minutiae-Based (i.e. (Sha et al., 2003;
Yang et al., 2007; Lumini and Nanni, 2006; Qader
et al., 2007)), and Correlation-Based (i.e. (Lindoso
et al., 2007; Karna et al., 2008)). Also, researchers
proposed hybrid matchers which make use of more
than one of the above-mentioned approaches ( i.e.
(Nandakumar and Jain, 2004; Ross et al., 2002;
Benhammadi et al., 2007)). All the fingerprint
matching methods can be roughly categorised into
the mentioned groups based on the features they
extract from the fingerprints. Fingerprint features can
also be categorized into three major levels (Maltoni
et al., 2009; Donida Labati and Scotti, 2011; Yager
and Amin, 2004). Level-1 features (general patterns)
are the macro information on the fingerprint such as
ridge flow and ridge orientation. The level-1 features
are mostly used to categorize the fingerprints into
specified classes or pattern type (loop, arch, tented
arch, etc.). Level-2 features are the minutiae, such
as ridge bifurcations and endings. Level-3 features
include all dimensional attributes of the ridge such
as ridge width, shape, pores, incipient ridges, breaks,
creases, scars, and other permanent details (Jain
et al., 2007).
Regarding fingerprint features, it should be noted
that some features could be highly-discriminative
but are very sensitive to the quality of the images.
Usually, minutiae features have these types of prop-
erties(Maltoni et al., 2009; Pankanti et al., 2002).
Minutiae are defined as the points that a ridge ends
or disjoints, therefore, minutiae extraction in low
quality images will lead to detecting false minutiae
due to the unclear ridges and valleys (Yager and
Amin, 2004). Although extracting the minutiae from
grey-scale image instead of skeleton image compen-
sate for detecting false and spurious minutiae (Yager
and Amin, 2004), designing a foolproof minutiae
extractor to reliably detect these features is still
an issue. Another disadvantage of Minutiae-based
approaches is that they only use limited available
information on the fingerprint. Pankati et al. claimed
that extracted information in minutiae-based methods
is limited, and algorithm developers should explore
the use of non-minutiae based information as well
(Pankanti et al., 2002). This problem becomes more
serious when dealing with partial fingerprints since
some of the remaining useful information is not used
by minutiae-based methods. Typically, in a small
area of a fingerprint, only 4-5 minutiae may exist
and in that case, minutiae-based methods will not
work satisfactorily due to limitation in providing
fingerprint discriminative information (Maltoni et al.,
2009).
On the other hand, correlation-based methods
directly use the grey-level information from the
fingerprint image (Nandakumar and Jain, 2004;
Vaidehi et al., 2010; Lindoso et al., 2007). These
methods take into account all dimensional attributes
of a fingerprint which include micro characteristics
such as minutiae, macro characteristics such as ref-
erence points, and also ridge shape, ridge thickness,
etc. A grey-level fingerprint image contains richer
and more discriminatory information than only the
minutiae location. Furthermore, in correlation-based
methods false/missed minutiae do not decrease the
matching performance and even no hard decision
needs to be made on the searching for minutiae
pairs. Correlation-based methods are also capable
of dealing with low quality images. Although
Correlation-based methods have a higher reliability,
their main drawback is their high computational
cost (Nandakumar and Jain, 2004; Vaidehi et al.,
2010; Lindoso et al., 2007). To overcome this issue
different strategies have been proposed. One of these
strategies is to use an appropriate region selection
for comparison purposes (Lindoso et al., 2007).
Moreover, the computation required to compute
cross-correlation can also be achieved in Fourier
domain (Douglas A., 2010; Lindoso et al., 2007).
Finally, computing correlation of the local regions of
the images can be performed in parallel.
To improve the performance of correlation al-
gorithms, Karna et al. proposed a method based on
normalized cross-correlation (Karna et al., 2008).
Their method involves extracting the common region
between two fingerprints (as one single region) and
computing the correlation of the common region. The
highest correlation coefficient value is considered as
the degree of similarity between two fingerprints.
The main limitation of this method is the alignment
algorithm. This process is done manually by select-
ing points of interest from the template and query
fingerprints. By so doing, the accuracy of aligning
the fingerprints improves significantly. However,
such an alignment strategy is not practical in AFIS
(Automated Fingerprint Identification System) which
requires processing large number of images. In
addition, accurately aligning the fingerprints can
significantly improve the system performance. An-
other drawback of this method relates to dealing with
non-linear distortion. If the similarity measurement
is not applied locally, the matching result will suffer
from non-linear deformation.
Nandakumar and Jain proposed a hybrid method
of minutiae and correlation (Nandakumar and Jain,
SECRYPT2014-InternationalConferenceonSecurityandCryptography
276
2004). Their method is based on computing the
correlation of small region around minutiae points
and takes the average of the correlation values as the
final similarity degree of two fingerprints. Although
their approach can sufficiently deal with non-linear
distortion, it suffers from being dependent on the
minutiae points. The two main problems of minutiae-
based methods (working on limited information and
detecting spurious/false minutiae) also prevents this
method from providing better result. Nandakumar
and Jain also stated that ”the grey-level information of
the pixels around the minutiae point contains richer
information about the local region than attributes of
the minutiae points”.
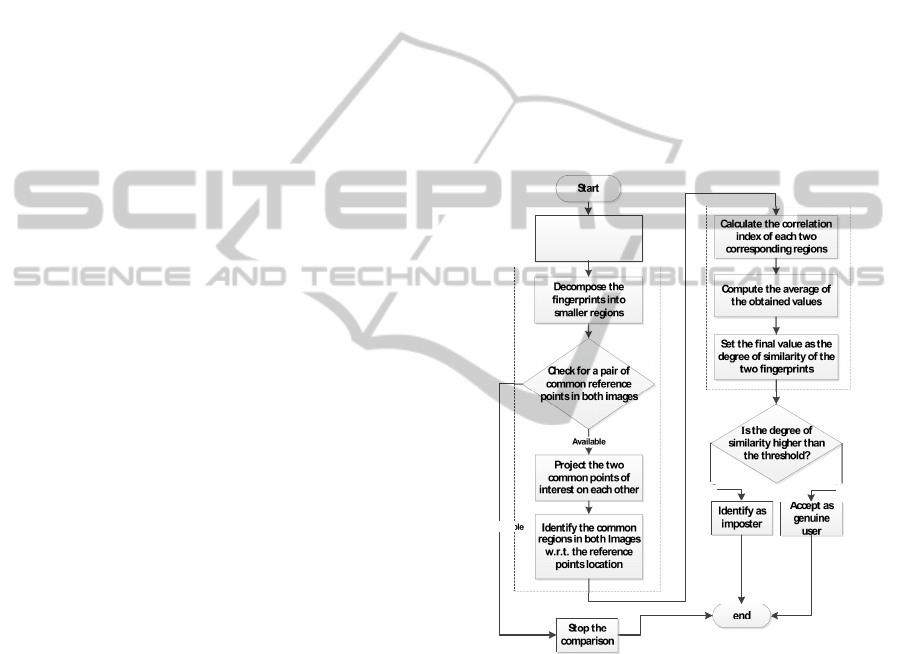
2 PROPOSED METHOD
The proposed correlation-based method consists of
the following major steps: fingerprint alignment,
common region extraction, and computing the degree
of similarity. As in other methods, the fingerprints are
enhanced and segmented as the preliminary steps of
the proposed method.
In a pixel-wise comparison of the images, the cor-
responding regions in two images need to be com-
pared. In order to compute the correlation of the same
regions, the translation difference can be taken care of
by applying the sliding window technique. Therefore
the images only need to be rotationally aligned. Rota-
tional alignment of two fingerprints refers to rotating
the fingerprints so they become as identical as possi-
ble in the orientation. In partial prints, there may be
a small overlap between the two fingerprints, hence
a suitable strategy needs to be performed to align
them. In section 2.1, the alignment method is dis-
cussed which also addresses the alignment issues in
Karna et al.’s method (Karna et al., 2008).
After alignment step, in order to extract the com-
mon regions between two fingerprints, first they are
decomposed into smaller regions. Then, by project-
ing the common singular points of the two finger-
prints, the regions which are located at the same lo-
cation with respect to these points, are identified as
the common regions (section 2.2).
After identifying the common regions between the
two images, similarity of two fingerprints is measured
(section 2.3). As discussed, there may be a small
overlap between two partial fingerprints. Thus, in or-
der to utilise all the available information, correlation
of the overlapped regions is computed. Correlation
of each small regions in query image is computed
with respect to the corresponding one in registered
image. Dividing the fingerprints into smaller regions
and computing the similarity of the fingerprints lo-
cally will minimize the effect of the non-linear dis-
tortion (depending on choosing a reasonable size of
the regions). A large size region cannot properly han-
dle the non-linear deformation. On the contrary, cor-
relation of a small size regions are more affected by
the small distorted parts of that region (compared to
large size regions). Apart from these points, region
size should be small enough to cover most of the fin-
gerprint information close to the borders. By comput-
ing the local similarities, all the attributes contained
in the fingerprint is utilised. To obtain the final simi-
larity score of two fingerprints (global similarity), the
local similarities are averaged. The Block diagram
of the proposed method is presented in Figure 1. All
the steps is described in detail in the following sub-
sections.
Align the two
Fingerprints
Common Region Extraction
NO
Yes
Not Availab
Computing Similarity Degree
A t
Figure 1: Block diagram of the proposed matching method.
2.1 Fingerprint Alignment
One of the intra-class variations is the rotation dif-
ference in two fingerprints. In our proposed method a
pixel to pixel comparison of both images is computed,
therefore even a slight rotation difference between the
two images, could result in an inaccurate matching
decision. In other words, an accurate alignment lead
to reducing false rejection of the genuine users in the
system.
The previously developed fingerprint alignment
methods, including minutia-based and non-minutia
feature based ones, are not completely suitable for
partial fingerprints. One issue of applying these meth-
PartialFingerprintIdentificationThroughCorrelation-basedApproach
277

ods to partial prints is that the required features could
be very few on the fragments. Accordingly, they will
either lead to incorrect alignment or not being appli-
cable for partial fingerprints (Zhao et al., 2010). For
instance, Khalili et al. have investigated on using fin-
gerprint reference points to rotationally align the fin-
gerprints (Khalil et al., 2009). However, it is likely
that reference points are not available in partial fin-
gerprints. Therefore, it is critical to align the partial
fingerprints only based on the available features.
This issue in partial fingerprint alignment can be
reasonably overcome by using the remaining infor-
mation in the fragment. In addition, since the shape
of the partial fingerprint is not fixed, the fingerprints
must be aligned adaptively to the partial print shape.
In alignment step, a new approach to align the fin-
gerprints based on the correlation of fingerprints (us-
ing the micro features, refer to section 2.1.1) and their
singular points (using macro features, refer to section
2.1.2) is applied. The resulting algorithm is not only
simple and intuitive, but is also robust and accurate.
2.1.1 Alignment based on Fingerprint Micro
Features
As discussed in section 1, the region-based compar-
ison include much richer information than minutiae-
features for matching while being more reliable with
respect to the image quality. The same discussion is
applicable for the features to use to align the finger-
prints.
The process starts with cropping a region from the
query fingerprint. The size of the cropped region can
vary depending on the size of the valid fingerprint re-
gions. In addition to the size of the region, it can be
cropped from different part of the query fingerprint.
These two properties make this strategy suitable for
partial fingerprints alignment. For each of the cropped
regions, the correlation of the cropped region and the
registered fingerprint is computed for different rota-
tion angles. The rotation angle which gives the high-
est correlation value, is used to rotationally align the
two fingerprints.
By aligning the fingerprints in this way, partial fin-
gerprints can be aligned even though there is no sin-
gular point available. In addition, the fingerprints are
accurately aligned since the finger skin elasticity is
handled and the effect of distorted regions on the fin-
gerprint is ignored, due to the point that different re-
gions (with different sizes) can be cropped from the
query fingerprint. The result of aligning by this strat-
egy is shown in Figure 2. Although this strategy is
accurate, it is not efficient in terms of computation
cost. Each cropped region is rotated by -35 to +35
degree till the rotation difference is found. In order
to increase the efficiency, the singular points position
(if available) on the fingerprint is used as the second
strategy.
Figure 2: A pair of impression of the same finger being
aligned based on computing the correlation of their ridge
structure.
2.1.2 Alignment based on Fingerprint Macro
Features
The fingerprints are generally 2-dimensional images
which could be rotationally aligned if two identical
points can be located in both images. Singular points
(if available) could be used to align the fingerprints
efficiently based on this theory. In this study, the lo-
cations of singular points are detected based on the
method proposed by Wang et al. (Wang et al., 2011).
The ideal situation in intra-class cases is that the
location of any singular point in one image should
be identical to the location of corresponding singular
point in the other image. For instance, the difference
in the Euclidean distance between core and delta point
in two intra-class fingerprints ”A”, and ”B”, should be
very small. If so, the idea of using the singular point
location for alignment is promising. Considering the
four types of singular points in a fingerprint (upside
core, downside core, right delta, and left delta), there
are six combinations of them. Figure 3 shows the plot
of subtracting the Euclidean distance between singu-
lar points of intra-class and inter-class fingerprints.
The experiment is conducted on the public data set
FVC2002 DB1. As shown, generally the subtraction
between the Euclidean distance of the two pairs of
singular points locations in intra cases is much lower
than those in inter-cases (desired). On the other hand,
in some intra-cases, this value is more than the ones
in inter-cases due to the intra-class variation (unde-
sired). In this case, aligning the fingerprints based on
the position of reference points will not be accurate,
but it still could be used for a coarse alignment (to
take advantage of the efficiency of this strategy).
Assume two pairs of the same reference points
exist in both fingerprints. To align them based on
their position and angle with respect to x-axis, the
query image is rotated till the gradient of the two
common reference points are identical.If C
R
(x
1
, y
1
)
and D
R
(x
2
, y
2
) are core and delta points respec-
tively in registered fingerprint, likewise C
Q
(x
′
1
, y
′
1
)
and D
Q
(x
′
2
, y
′
2
) are core and delta points respectively
SECRYPT2014-InternationalConferenceonSecurityandCryptography
278
0 50 100 150 200 250 300 350 400 450 500
0
100
200
300
Ucore & Dcore
Intra Comparisons
Inter Comparisons
0 50 100 150 200 250 300 350 400 450 500
0
100
200
300
Ucore & Ldelta
Intra Comparisons
Inter Comparisons
0 50 100 150 200 250 300 350 400 450
0
100
200
300
Ucore & Rdelta
Intra Comparisons
Inter Comparisons
0 10 20 30 40 50 60
0
100
200
300
Dcore & Ldelta
Intra Comparisons
Inter Comparisons
0 10 20 30 40 50 60 70 80
0
100
200
300
Dcore & Rdelta
Intra Comparisons
Inter Comparisons
0 5 10 15 20 25 30 35
0
100
200
300
Ldelta & Rdelta
Intra Comparisons
Figure 3: y-axis indicates the difference between the Eu-
clidean distance between each pair of singular points in in-
tra and inter class fingerprints (in pixels), x-axis indicates
a comparison in inter/intra. Ucore = upside core, Dcore =
downside core, Ldelta = left delta, and Rdelta = right delta.
in query fingerprint, the angle between (C
R
, D
R
), and
(C
Q
, D
Q
), (θ
1
and θ
2
respectively) is computed as fol-
lows:
θ
1
= tan
−1
(
y
2
− y
1
x
2
− x
1
), θ
2
= tan
−1
(
y
′
2
− y
′
1
x
′
2
− x
′
1
) (1)
angle = θ
2
− θ
1
(2)
Eq. 2 indicates the angle that query fingerprint
must be rotated in order to be aligned with the regis-
tered fingerprint.
Figure 4 illustrates an example of aligning the fin-
gerprints based on the above process. Figures 4(a)
and 4(b) show the registered and query fingerprints
respectively, which are different impressions of the
same finger. To align the query fingerprint with the
registered one, the query fingerprint should be rotated
clockwise. The red and green circles depict the lo-
cation of up-core and delta respectively on both of
the fingerprints. According to the position of the core
and delta points on registered image and by using Eq.
1, θ
1
= +111
◦
and likewise θ
2
= +116
◦
. Then the
angle (Eq. 2) is −5
◦
which means the query image
should be rotated by 5
◦
(clockwise) to be aligned with
registered image (Figure 4(c)). In this case, the sin-
gular point detection method correctly identified the
position of the singularity, but due to the intra-class
variation, core and delta points changed their posi-
tion in two different impressions. In these cases us-
ing the position of the singular points will not result
in an accurate alignment. However, the fingerprints
were coarsely aligned which significantly improves
the alignment efficiency in total.
(a) Registered image. (b) Query image.
θ
1
= +111, θ
2
= +116, angle = θ
1
− θ
2
= −5
(c) Query image ro-
tated by −5
◦
(d) Query image ro-
tated by −35
◦
Figure 4: Aligning the query fingerprint (b) with respect
to registered fingerprint (a), in (c) only fist strategy used to
align the fingerprints, in (d) alignment is done by combining
first and second strategy
2.1.3 Alignment by Hybrid of Micro and Macro
Features
Considering these two strategies, combing the two
alignment strategies results in taking advantage of
accurately aligning by using micro features and ef-
ficiently aligning by using macro features. Figure
5 shows the ROC plot of the discussed alignment
method. Each curve shows the False Reject Rate
(FRR) versus False Accept Rate (FAR) (refer to (Cap-
pelli et al., 2006) for FAR and FRR explanation) for
different degree of rotation used in second strategy.
The red curve shows the system performance when
rotation angle is set to zero which is equivalent to only
applying the second alignment strategy (coarse align-
ment). As depicted, by increasing the rotation angle
(in first strategy), the Equal Error Rate, EER (where
FAR = FRR, (Cappelli et al., 2006)) decreases.
Furthermore, the ROC curves associated with the
rotation angles of 0 and 5 shows significantly higher
FAR and FRR compared to the ROC curves associ-
ated with the rotation angles 10, 15, 25, 35, and 45.
As mentioned in (Maio et al., 2002), the maximum
rotation difference between any two samples in this
dataset is a maximum of 35
◦
. This will lead us to the
PartialFingerprintIdentificationThroughCorrelation-basedApproach
279
1 2 3 4 5 6
0
1
2
3
4
5
6
False Accept Rate (FAR)
False Reject Rate (FRR)
Rotation Angle = 0
Rotation Angle = 5
Rotation Angle = 10
Rotation Angle = 15
Rotation Angle = 25
Rotation Angle = 35
Rotation Angle = 45
Figure 5: ROC of the proposed method by using different
rotation angles in second alignment strategy.
Figure 6: Block diagram of the proposed alignment method.
optimal rotation degree that can result in lowest FAR
and FRR. Considering that at this point fingerprints
are coarsely aligned, there is not much difference be-
tween the curves for rotation angles of 15, 25, 35, and
45. This can be concluded that the rotation angle 15 is
the optimal degree of rotation needed for this dataset.
Block diagram of the proposed method for alignment
is presented in Figure 6.
There is one more step needs to be performed af-
ter fingerprints are aligned to make sure the same re-
gions are compared between two fingerprints. In next
section, how the common regions between two finger-
prints are extracted is discussed.
2.2 Common Region Extraction
Local matching techniques are proposed to overcome
the problems such as lack of robustness with re-
spect to the non-linear distortion in global match-
ing techniques (Cappelli et al., 2010). In order to
locally match the fingerprints, they are decomposed
into smaller regions. The main reasons that the local
matching techniques perform better than the global
ones are:
• Their capability in handling the non-linear distor-
tion of the fingerprints (refer to section 1 for non-
linear distortion definition).
• The effect of the distorted regions on the final sim-
ilarity degree is reduced by dividing the images
into smaller regions (refer to section 2.3).
With regard to the size of the smaller regions, in
computing the correlation of two images, there is a
trade-off between size of the region and sensitivity to
distortion. If the selected region size is too small it
will not capture enough image information and will
be too sensitive to the distortion. This may result in
miscalculating the correlation of that region. On the
other hand, if the region size is too large, it becomes
less sensitive to the distortion (desired) but also less
sensitive to the actual variations of the fingerprints
(not desired). Considering the resolution of the finger-
prints in the dataset, it is observed that the minimum
region size required for any feature to be extracted is
50 × 50 pixels (refer to section 3). Moreover, this size
is also used to extract the common regions between
the two fingerprints.
In order to extract the common regions, at least
one common reference point needs to be located on
both fingerprint. The query fingerprint is projected
on to the registered fingerprint by aligning their com-
mon reference points. Subsequently, the overlapping
regions are identified to be the common regions be-
tween the two fingerprints.
2.3 Computing Degree of Similarity
Due to the small overlap in partial fingerprint match-
ing, a similarity measure that can reflect all the distin-
guishing characteristic of a fingerprint is essential. As
discussed in section 1, correlation coefficient of two
fingerprints reflects all the available features. There-
fore, the similarity of two fingerprints is computed in
terms of their correlation coefficient. In addition, as
discussed in section 1, the fingerprints could suffer
from the distortion. The distortion on a fingerprint
may not be uniformly distributed and different regions
may have different image quality levels. Thus, com-
puting the similarity of the fingerprints locally (small
regions extracted in section 2.2) reduces the effect of
the distorted regions. In next section, the details of
computing the local similarities and why it tolerates
the effect of distorted regions on similarity degree of
the fingerprints is discussed followed by computing
SECRYPT2014-InternationalConferenceonSecurityandCryptography
280

the global (final) similarity degree through consoli-
dating the local similarities for comparison.
2.3.1 Local and Global Degree of Similarity
Conventionally, in correlation-based methods, the
whole fingerprints were considered as one big single-
region. Accordingly, the degree of similarity was
computed based upon the correlation of the two
single-regions. In order to lower the effect of distorted
regions on fingerprints, the similarity of two finger-
prints is computed locally (in small-region level) and
then the average value of local similarities is consid-
ered as the final similarity score between the two fin-
gerprints. Computing the similarities of each pair of
small-regions individually and then averaging them
to obtain the global similarity is a robust and reliable
technique for fingerprint matching. The reason is that
the final similarity degree could be computed by giv-
ing the same contribution to each of the local simi-
larities and by so doing, the distorted regions is taken
into account as one value (local similarity) and it is
not affecting the similarity of other regions. Hence,
in our method, first the Normalized Cross Correla-
tion (NCC) of each two corresponding regions is com-
puted as local similarities. The NCC of 2-dimensional
images f and t is calculated as (aka Pearson’s r corre-
lation) (Yoo and Han, 2009):
NCC =
1
n
∑
x,y
( f (x, y) −
¯
f )(t(x, y) −
¯
t)
σ
f
σ
t
, (3)
where
¯
f and
¯
t are the mean and σ
f
and σ
t
are the
standard deviation of the images f and t respectively
and n is the number of pixels of the images.
Common regions between registered and query
fingerprint are not always detected completely accu-
rately due to the following two reasons. First: as men-
tioned in section 2.2, extracting common regions is
based on the position of the common reference point.
However, the reference points are not always pre-
cisely located. Therefore, the detected common re-
gions based on the location of these points are also
not always precisely located. Second: even if the ref-
erence points are located precisely, it is still very chal-
lenging to precisely locate the corresponding regions
due to the intra-class variation and non-linear distor-
tion. Therefore, the corresponding region on regis-
tered fingerprint needs to be chosen greater than the
one in query image to compensate for the small errors
in computing the exact location of the corresponding
regions.
After the local similarities are computed, a partic-
ular value (as global score) needs to be obtained from
the local similarities to indicate their overall degree
of similarity (Cappelli et al., 2010). In our method, to
obtain a degree of similarity between the two finger-
prints (global score/similarity), the local similarities
are averaged. It should be mentioned that computing
the similarity of fingerprints in such a way reasonably
handles the intra-class variation and inter-class sim-
ilarity, however to get the best out of this method it
still could be improved. One promising technique to
add to the current method is measuring the quality of
small regions and compute the local similarities only
based on the good quality regions. This is part of our
future wok which is explained more in section 4.
3 EXPERIMENTAL RESULT
An experiment is performed on DB1 of the public
dataset FVC 2002 (Fingerprint Verification Compe-
tition) which contains 800 fingerprints from 100 dif-
ferent fingers (8 impressions per finger). As discussed
in (Maio et al., 2002), for the data set FVC2002 DB1,
the participants that volunteered to provide their fin-
gerprints, were asked to intentionally change the ori-
entation of their finger on the scanner when scan-
ning different impressions (to make the different im-
pressions vary rotationally). In addition, no effort
was made to control the image quality and the sen-
sor plates were not systematically cleaned and high
quality images were removed from the dataset. There-
fore, due to rotation and displacement of the finger
when scanning, there is often only a partial overlap
between different impressions of the same finger and
hence, the images in the data set include low qual-
ity and partial fingerprints as well. As discussed in
previous sections, no matter how partial the finger-
prints are, they can be aligned, their common regions
are extracted (as long as a common reference point is
available), and their local and global similarities are
computed. The proposed method is designed in such
a way to fulfil the requirements of partial fingerprint
matching as well as complete fingerprint matching.
Regarding the time cost of the proposed method,
the matching process of two fingerprints takes about
1.5 minutes on a computer with 3.1 GHz CPU and
8 GB RAM. This time has a direct relationship with
how partial a fingerprint is. The smaller the avail-
able valid regions are, the less time is required for
matching process. Considering the size of the dataset,
and the time cost of the proposed method, the com-
parisons were conducted on Monash University High
Performance Computing Cluster.
Table 1 indicates the result of the proposed
method on the FVC2002 data set (in terms of the met-
PartialFingerprintIdentificationThroughCorrelation-basedApproach
281

Table 2: Comparison of the proposed method with previous works in terms of EER(%) value on dataset FVC2002 DB1. The
methods are roughly categorised into the three major groups of fingerprint approaches.
Category Method EER (%)
(Kovacs-Vajna, 2000) 4.3
(Tico and Kuosmanen, 2003) 4.0
Minutiae (Chen et al., 2005) 4.6
(Liu et al., 2005) 4.3
(Gao et al., 2011) 3.5
(Sha et al., 2003) 6.23
Non-Minutaie (Yang et al., 2007) 3.64
(Lumini and Nanni, 2006) 4.2
(Qader et al., 2007) 7.13
Hybrid (Benhammadi et al., 2007) 4.2
Single-Region Conventional Method 7.1
Multiple-Region with
region size: 50 × 50 pixels Proposed Method 2.32
Table 1: The result of the proposed method in terms of EER
(%) value on data set FVC 2002 DB1 by using different
region size. The last column shows the threshold used to
compute the EER.
Proposed Correlation-Based Method EER (%)
Region Size = 100 × 100 4.37
Region Size = 90 × 90 3.27
Region Size = 80 × 80 2.92
Region Size = 70 × 70 2.58
Region Size = 60 × 60 2.35
Region Size = 50 × 50 2.32
Region Size = 40 × 40 2.40
Region Size = 30 × 30 2.48
Region Size = 20 × 20 2.79
ric Equal Error Rate, EER) where the fingerprints are
decomposed to different region sizes in order to ex-
tract their common regions (section 2.2) and compute
their similarity degree (section 2.3). As shown in this
table, the smaller the region size is, the more accu-
rate the system performance will be. It is empirically
observed that the region size 50 × 50 is the optimum
region size for this data set which is required to ex-
tract the available features in a fingerprint.
Table 2 illustrates the comparison of our method
with previous works in terms of EER value. Our
method produces the lowest EER of 2.32%. The main
advantage of our method compared to the others is
using all the available dimensional attributes of the
fingerprint. That includes all the three level of fea-
tures mentioned in section 1. In addition, many meth-
ods are proposed to extract the level-3 features of the
fingerprint, but extracting the level-3 features such as
pores from low resolution fingerprints is very chal-
lenging. On the other hand, our proposed method is
able to take into account all the possible distinguish-
ing information in the fingerprint, regardless of the
image quality (not very dependent on few particular
features).
To demonstrate the effectiveness of the proposed
multiple-region based method, its result is com-
pared with the single-region correlation (conventional
correlation-based method). It was observed that aver-
aging method improved the EER from 7.1% to 2.32
% with respect to the single-region correlation-based.
This improvement is achieved due to the robustness
of the proposed method in reasonably handling the
non-linear distortion and lowering the effect of the
distorted regions in the fingerprint images (refer to
section 2.3 for details).
Cappelli et al. (Cappelli et al., 2010) stated that lo-
cal minutiae matching techniques can be categorised
into two family of nearest neighbour-based and fixed
radius-based. Methods in nearest neighbour-based
family (i.e. Gao et al.’s approach (Gao et al., 2011))
the k closest minutiae to a central minutiae are defined
as the neighbours of the central one. These methods
lead to a fixed-length descriptor that can be matched
efficiently. Gao et al.’s method uses the nearest neigh-
bour structure information to match the points which
carries on global matching at the end. In addition,
their method is invariant to rotation and translation
which saves the effort needed to align the finger-
prints.These are the main advantages of Gao et al.’s
method which lead to the lowest EER in the table.
On the other hand, further to the issues which Gao et
al.’s method suffer from as a minutiae-based method
(refer to section 1), their method is not able to con-
sider the effect of non-linear distortion of fingerprint
images. Also nearest neighbour-based methods are
not very tolerant to missing and spurious minutiae as
the objective in these methods is to find the k nearest
minutiae points (Cappelli et al., 2010).
SECRYPT2014-InternationalConferenceonSecurityandCryptography
282

The best EER in non-minutiae category belongs
to Yang et. al’s (Yang et al., 2007) method. Yang et
al.’s method is based on extracting invariant moments
of the fingerprint. Invariant moments were first intro-
duced by Hu (Ming-Kuei, 1962). Hu proved that his
seven moments are invariant to RTS (rotation, trans-
lation, and scaling). These moments are widely used
in pattern recognition. Yang et al. applied these mo-
ments in fingerprint matching. Although their method
is invariant to RTS and is efficient in terms of compu-
tation, there are some limitations in their work. First
problem is that they only make use of a small region
of the fingerprint (around reference points) while the
rest of the information remains unused. Second prob-
lem is that they used 75% of the dataset as training
set, while all the dataset (including the training set) is
used to evaluate their method (as test set). This sig-
nificantly affects the performance of the system and
lead to a lower EER compared to evaluating the sys-
tem only on the test set.
4 CONCLUSION AND FUTURE
WORK
In this paper, we proposed a new method to mea-
sure the similarity of the fingerprints based on corre-
lation coefficient. The method is composed of three
main steps: alignment, common region extraction,
and computing the final degree of similarity. Regard-
ing to the alignment, pros and cons of the two strate-
gies discussed which lead to combining them together
to end up with an accurate and efficient method. The
common region extraction was obtained by dividing
the images into smaller regions, and projecting them
on each other with respect to their common reference
points. The most important step that had a great ef-
fect on the EER, is measuring the degree of similarity
between two fingerprints. Based on the correlation
coefficient, a new methodology to improve the accu-
racy for reliable fingerprint recognition proposed with
especial interest in partial fingerprints. To this end,
computing the similarity degree was decomposed in
two sub-steps. First, the two images were divided
into smaller regions, and the correlation of the cor-
responding regions were computed (as local similar-
ities). Thereafter, the mean value of the local simi-
larities is calculated as the final degree of similarity.
It was observed that computing local similarities and
assigning their average as a final degree of similarity
result in a higher recognition accuracy compared to
its conventional single region calculation. As a con-
sequence, the EER is enhanced by almost 3 times as
compared to a single region correlation. This proves
the effectiveness of including an appropriate averag-
ing method in the recognition algorithm. Regarding
other available studies, our result gives a 33.7% im-
provement over the previous works.
Regarding our future work, as mentioned in sec-
tion 2.3, measuring the quality of the small regions
and processing only the good quality ones is a promis-
ing step to add to the current method. By so doing,
inter and intra cases are more discriminated. Two in-
tra fingerprints are supposed to have a high correla-
tion in every region and vice versa for inter finger-
prints. However, one of the main reasons that intra
fingerprints result in low similarity is that some parts
of the fingerprint are distorted. Therefore, identifying
the low quality regions and ignoring the correlation of
those regions will help to increase the similarity of in-
tra cases. On the other hand, this strategy will not sig-
nificantly affect the similarity degree of inter-cases.
The low similarity in inter cases is the result of the
difference between the ridges and valleys structure of
the two fingerprints and not only the quality. In other
words, the similarity on inter-cases will increase but
not as much as it does for intra-cases.
ACKNOWLEDGEMENT
The authors would like to thank Li Wang (Wang et al.,
2011) and Sharat Chikkerur (Chikkerur et al., 2007)
for providing us with the source code. This research
was supported in part by the Monash e-Research Cen-
tre and eSolutions-Research Support Services through
the use of the Monash Campus HPC Cluster.
REFERENCES
Benhammadi, F., Amirouche, M. N., Hentous, H.,
Bey Beghdad, K., and Aissani, M. (2007). Finger-
print matching from minutiae texture maps. Pattern
Recognition, 40(1):189–197.
Cappelli, R., Ferrara, M., and Maltoni, D. (2010). Minu-
tia cylinder-code: A new representation and matching
technique for fingerprint recognition. IEEE Transac-
tions on Pattern Analysis and Machine Intelligence,
32(12):2128–2141.
Cappelli, R., Maio, D., Maltoni, D., Wayman, J. L., and
Jain, A. K. (2006). Performance evaluation of finger-
print verification systems. IEEE Transactions on Pat-
tern Analysis and Machine Intelligence, 28(1):3–18.
Chen, Y., Dass, S. C., and Jain, A. (2005). Fingerprint
Quality Indices for Predicting Authentication Perfor-
mance, pages 160–170. Lecture Notes in Computer
Science. Springer.
PartialFingerprintIdentificationThroughCorrelation-basedApproach
283

Chikkerur, S., Cartwright, A. N., and Govindaraju, V.
(2007). Fingerprint enhancement using stft analysis.
Pattern Recognition, 40(1):198–211.
Donida Labati, R. and Scotti, F. (2011). Fingerprint. In van
Tilborg, H. and Jajodia, S., editors, Encyclopedia of
Cryptography and Security, pages 460–465. Springer
US.
Douglas A., L. (2010). The discrete fourier transform, part
6: Cross-correlation. Journal of Object Technology,
9(2):17–22.
Gao, Z., You, X., Zhou, L., and Zeng, W. (2011). A
novel matching technique for fingerprint recognition
by graphical structures. In International Confer-
ence on Wavelet Analysis and Pattern Recognition
(ICWAPR), pages 77–82.
Jain, A. K., Yi, C., and Demirkus, M. (2007). Pores
and ridges: High-resolution fingerprint matching us-
ing level 3 features. IEEE Transactions on Pattern
Analysis and Machine Intelligence, 29(1):15–27.
Karna, D. K., Agarwal, S., and Nikam, S. (2008). Normal-
ized cross-correlation based fingerprint matching. In
Fifth International Conference on Computer Graph-
ics, Imaging and Visualisation, CGIV, pages 229–232.
IEEE.
Khalil, M. S., Muhammad, D., Khan, M. K., and AL-
Nuzaili, Q. (2009). Fingerprint verification using fin-
gerprint texture. In IEEE International Symposium
on Signal Processing and Information Technology (IS-
SPIT), pages 591–594.
Kovacs-Vajna, Z. M. (2000). A fingerprint verification sys-
tem based on triangular matching and dynamic time
warping. IEEE Transactions on Pattern Analysis and
Machine Intelligence, 22(11):1266–1276.
Labati, R. D., Genovese, A., Piuri, V., and Scotti, F. (2014).
Touchless fingerprint biometrics: a survey on 2d and
3d technologies. Journal of Internet Technology,
15(3):325–332. 1607-9264.
Lindoso, A., Entrena, L., Liu-Jimenez, J., and Millan, E. S.
(2007). Increasing security with correlation-based fin-
gerprint matching. In 41st Annual IEEE International
Carnahan Conference on Security Technology, pages
37–43.
Liu, N., Yin, Y., and Zhang, H. (2005). A fingerprint match-
ing algorithm based on delaunay triangulation net. In
The Fifth International Conference on Computer and
Information Technology, CIT, pages 591–595. IEEE.
Lumini, A. and Nanni, L. (2006). Two-class fingerprint
matcher. Pattern Recognition, 39(4):714–716.
Maio, D., Maltoni, D., Cappelli, R., Wayman, J., and Jain,
A. (2002). Fvc2002: Second fingerprint verification
competition. In 16th International Conference on Pat-
tern Recognition, volume 3, pages 811–814.
Maltoni, D., Maio, D., Jain, A., and Prabhakar, S. (2009).
Handbook of Fingerprint Recognition. Springer, New
York, 2nd edition.
Ming-Kuei, H. (1962). Visual pattern recognition by mo-
ment invariants. IRE Transactions on Information
Theory, 8(2):179–187.
Nandakumar, K. and Jain, A. K. (2004). Local correlation-
based fingerprint matching. In Indian Conference on
Computer Vision, Graphics and Image Processing,
pages 503–508.
Pankanti, S., Prabhakar, S., and Jain, A. K. (2002). On
the individuality of fingerprints. IEEE Transac-
tions on Pattern Analysis and Machine Intelligence,
24(8):1010–1025.
Parziale, G. (2008). Touchless fingerprinting technology.
In Ratha, N. and Govindaraju, V., editors, Advances
in Biometrics, pages 25–48. Springer London.
Qader, H. A., Ramli, A. R., and Al-Haddad, S. (2007). Fin-
gerprint recognition using zernike moments. The In-
ternational Arab Journal of Information Technology,
4(4):372–376.
Ross, A., Jain, A., and Reisman, J. (2002). A hybrid fin-
gerprint matcher. In 16th International Conference on
Pattern Recognition, volume 3, pages 795–798 vol.3.
Sha, L., Zhao, F., and Tang, X. (2003). Improved finger-
code for filterbank-based fingerprint matching. In In-
ternational Conference on Image Processing, ICIP,
volume 2, pages II–895. IEEE.
Soweon, Y., Jianjiang, F., and Jain, A. K. (2012). Altered
fingerprints: Analysis and detection. IEEE Transac-
tions on Pattern Analysis and Machine Intelligence,
34(3):451–464.
Tico, M. and Kuosmanen, P. (2003). Fingerprint matching
using an orientation-based minutia descriptor. IEEE
Transactions on Pattern Analysis and Machine Intel-
ligence, 25(8):1009–1014.
Vaidehi, V., Naresh, B. N. T., Ponsamuel, M. A., Praveen,
K. S., Velmurugan, S., Balamurali, and Chandra, G.
(2010). Fingerprint identification using cross correla-
tion of field orientation. In Second International Con-
ference on Advanced Computing, ICoAC, pages 66–
69.
Wang, L., Bhattacharjee, N., and Srinivasan, B. (2011).
A novel technique for singular point detection based
on poincar
´
e index. In 9th International Conference
on Advances in Mobile Computing and Multimedia,
pages 12–18. ACM.
Yager, N. and Amin, A. (2004). Fingerprint verification
based on minutiae features: a review. Pattern Analysis
and Applications, 7(1):94–113.
Yang, J., Shin, J., and Park, D. (2007). Fingerprint Match-
ing Using Invariant Moment Features, volume 4456
of Lecture Notes in Computer Science, pages 1029–
1038. Springer Berlin / Heidelberg.
Yoo, J.-C. and Han, T. H. (2009). Fast normalized cross-
correlation. Circuits, Systems and Signal Processing,
28(6):819–843.
Yoon, S., Zhao, Q., and Jain, A. K. (2012). On matching
altered fingerprints. In 5th IAPR International Con-
ference on Biometrics, ICB, pages 222–229. IEEE.
Zhao, Q., Zhang, D., Zhang, L., and Luo, N. (2010). High
resolution partial fingerprint alignment using pore-
valley descriptors. Pattern Recognition, 43(3):1050–
1061.
SECRYPT2014-InternationalConferenceonSecurityandCryptography
284
