
Towards Student Success Prediction
Hana Bydžovská
1
and Michal Brandejs
2
1,2
CVT and
2
KD Lab Faculty of Informatics, Masaryk University, Brno, Czech Republic
Keywords: Recommender System, Social Network Analysis, Data Mining, Prediction, University Information System.
Abstract: University information systems offer a vast amount of data which potentially contains additional hidden
information and relations. Such knowledge can be used to improve the teaching and facilitate the
educational process. In this paper, we introduce methods based on a data mining approach and a social
network analysis to predict student grade performance. We focus on cases in which we can predict student
success or failure with high accuracy. Machine learning algorithms can be employed with the average
accuracy of 81.4%. We have defined rules based on grade averages of students and their friends that
achieved the precision of 97% and the recall of 53%. We have also used rules based on study-related data
where the best two achieved the precision of 96% and the recall was nearly 35%. The derived knowledge
can be successfully utilized as a basis for a course enrollment recommender system.
1 INTRODUCTION
Educational systems are focused on providing a high
educational standard. Learning analytics is used to
enhance the teaching and the learning. One of the
most important issues often solved in educational
environment is finding what influences student
performance.
We are interested in designing a course
enrollment recommender system (Jannach et al.,
2011) that will help students with selecting courses
to enroll in. For such recommender system, it is
crucial not to recommend difficult courses for
particular students. The student can fail to meet the
minimum requirements and subsequently to
discontinue the study.
It is equally important to advise students on
mandatory courses that usually cause problems. The
task is to identify such courses precisely. Initially,
we intend to properly define the similarity between
students based on their achievements as the course
difficulty can be estimated from the results of
similar students enrolled in earlier.
Our novel approach utilizes not only student-
related data but also structured data inferred from
social behavior of students. In (Bydžovská et al.,
2014), we have confirmed that the impact of social
ties among students on their study results is really
not negligible.
The aim of the proposed method is to predict the
success or failure of students in the selected courses.
The preliminary work was published in (Bydžovská
et al., 2014). In comparison to it, this follow-up
work contains the description of new social feature
extraction and their usage to improve results.
Association rules and decision trees algorithms are
used for a subgroup discovery. The experiment is
also performed on a representative data sample that
provides interesting observations.
In the following section, we give an overview of
related work. In Section 3, we describe the course
enrollment recommender system. The data used in
our experiments is introduced in Section 4. In
Section 5, we describe the experiments and the next
section brings results. The discussion of results can
be found in Section 7. The summary and directions
for future work can be found in the last section.
2 RELATED WORK
Exploring student potential is an interesting task in
the educational environment. Researches explore
what influences students and what can be done to
help them to improve their achievements.
A typical way for discovering regularity in data
is using data mining techniques (Peña-Ayala, 2014)
suitable for exploring a vast amount of data. It
162
Bydžovská H. and Brandejs M..
Towards Student Success Prediction.
DOI: 10.5220/0005041701620169
In Proceedings of the International Conference on Knowledge Discovery and Information Retrieval (KDIR-2014), pages 162-169
ISBN: 978-989-758-048-2
Copyright
c
2014 SCITEPRESS (Science and Technology Publications, Lda.)
allows us to build predictive models by defining
valid and exact rules.
Researchers mostly examine study-related data
stored in university information systems which
contain for example grades, gender, field of study, or
age. However, exploring the influence of social ties
to students’ performance is an attractive topic.
Authors in (Poldin at al., 2014) obtain data about
students’ friendships from questionnaires. They
prove that such data can improve predictions of
student failure. Unlike (Poldin et al., 2014) whose
research depends on answers from questionnaires,
we use data obtained from an information system
that can be computed from user requests, e.g. the
publication co-authoring, statistics about e-mail
conversation, or files uploaded into someone else's
depository.
Sometimes researches are faced with unbalanced
classes. This problem often encountered when
analyzing educational data, also mentioned in
(Thammasiri et al., 2014). Using some over-
sampling techniques could overcome this problem.
Authors improve classification accuracy using
SMOTE, an algorithm that generates new examples
by interpolating among existing minority examples.
Authors in (Vialardi et al., 2009) aim at selecting
courses for students in order to obtain good exam
results. Difficulties of courses are compared with
student potentials. Both variables are computed from
grades. The work extension can be found in
(Vialardi et al., 2010) where the analysis is based on
the profile similarity.
We further extend the method from (Vialardi et
al., 2009) by addition of social data. In this way we
are able to compare students' data together with the
information about their friends. Therefore, we can
increase the prediction accuracy.
3 RECOMMENDER SYSTEM
DESCRIPTION
Students are interested in information resources and
learning tasks that could improve their skills and
knowledge. Therefore the recommender system
should monitor their duties and show them either an
easy or an interesting way to graduate.
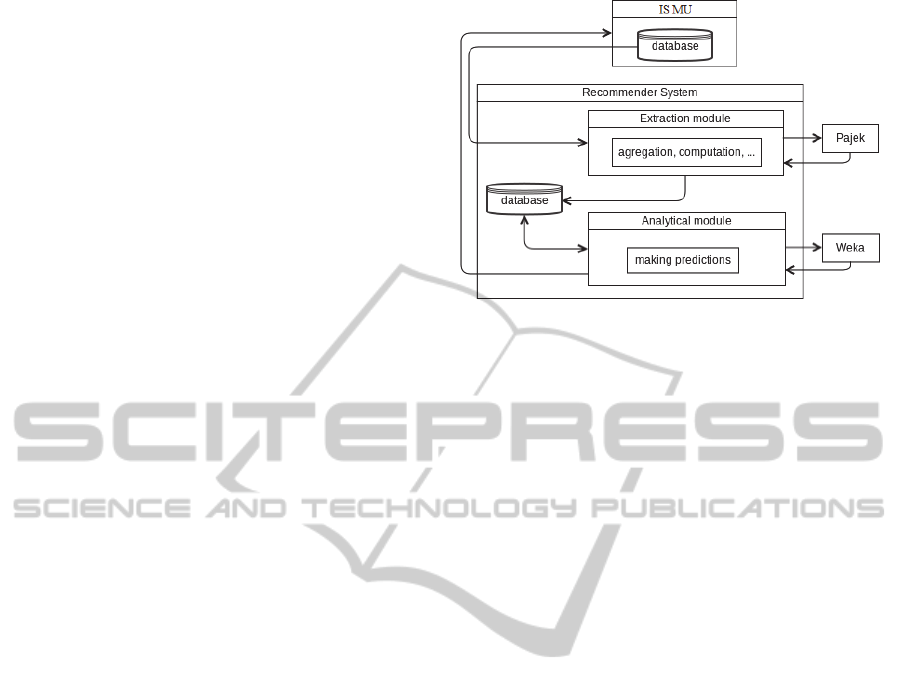
The current version of the system contains two
modules: an extraction module and an analytical
module. Figure 1 presents the data flow between the
university information system, the recommender
system and external tools such as Weka and Pajek.
Figure 1: Data flow.
3.1 Motivation
The results of exploration can be used for a warning
against too difficult courses in which students are
enrolled in. When courses are mandatory, the
canceling the enrollment is not possible but the
knowledge is useful for students and they should
study hard. When courses are selective or optional,
students can revise their choices. They can select
other courses recommended by the system. The
system will recommend courses with respect to
students' potentials and interests. A short explanation
of the selection will be available for students to be
able to verify the recommendations.
Another possibility is using the prediction of
student success or failure to identify the best
students or weak students for the faculty
management. The best students represent candidates
for tutoring, scholarships or grants. Weak students
usually need help to be able to graduate successfully
and heads of faculty can encourage them for
example by providing the best students for tutoring
them. It can be also useful to assist teachers to be
able to organize students into seminar groups. On
the other hand it can be tricky when teachers make
conclusions based only on this information.
3.2 Extraction Module
The Information System of Masaryk University (IS
MU) is a complex system used to support not only
education at Masaryk University. Today, it serves
many purposes and its functionality involves
managing study-related records. The database of IS
MU contains many types of data, e.g. students’
grades, exams, electronic questionnaires, course
enrollments, discussion groups, shopping center,
TowardsStudentSuccessPrediction
163

games, calendar, e-learning materials, publications,
course management, etc. Furthermore, the system
keeps the whole history of user requests.
The recommender system has its own database in
order not to influence the functioning of the
production system. The data we expect to define
student characteristics is periodically imported to its
database. The extraction module performs data pre-
processing and provides time-consuming
computations for study-related data.
The extraction module also manages social
behavior data, converts it into the format suitable for
Pajek (Nooy et al., 2011) which is a well-known tool
for social network analysis. Pajek reads the data and
creates sociograms where the nodes represent people
we are interested in and ties represent relations
between them. From such sociograms we can
compute social attributes defining the importance of
a person in the network. The extraction module also
prepares batch files in the format for Pajek in order
to launch the computations automatically. The
resulting social attributes are also stored into the
recommender system database to be ready for the
next processing.
3.3 Analytical Module
The data prepared by the extraction module is
further processed in the analytical module. This
module makes use of feature selection algorithms to
extract relevant features. It obtains also basic
statistics about the features, and it is able to run
machine learning algorithms from Weka (Witten et
al., 2011).
The analytical module will be finally composed
of two methods. The first one will provide finding
interesting courses for each student and the second
one will provide an estimation of the probability of
passing the course.
The current version of the module contains three
techniques described in this paper in Section 5 that
lead to the realization of the second goal. Firstly, we
use machine learning algorithms for mining
historical data. The second approach is based on
comparing student potential (student’s average
grade) with course difficulty (average grade
computed from all grades of students enrolled in a
course). The last method discovers student
subgroups for which the prediction can be more
accurate. The obtained accuracy is always compared
with the corresponding baseline, i.e. the case when
all instances of the data are classified into the
majority class.
The detailed description of these techniques can
be found in Section 5, the results are in Section 6
and the discussion of interesting effects is situated in
Section 7.
4 DATA
As it has been already mentioned, the data is
obtained by the extraction module from IS MU.
4.1 Student Characteristics
Each student can be described by a set of attributes
that precisely characterize student's qualities,
potentials and interests. We use three types of data:
the study-related data, the social behavior data and
the data about previously passed courses. Some of
these attributes were published in the previous work
(Bydžovská et al., 2014) in Section 5. The most
useful of them were: average of grades, weighted
average of grades, number of credits to gain, gained
credits and ratio between the last two attributes,
programme and field of study, closeness centrality,
degree, and weighted degree and betweenness
centrality (computed from the network formed by
students enrolled in the investigated course and all
their friends).
4.1.1 New Study-Related Attributes
In this section we present additional attributes
generated for the follow-up experiments introduced
in this paper. We add the following attributes:
average number of enrolled/gained credits in a
term,
difference of previous attributes and 30 credits
(recommended study workload per term),
number of successful finished studies at the
faculty/university,
number of failed courses per term,
number of courses previously failed that have
to be passed in the future,
number of successfully passed repeated
courses,
information about successfully/unsuccessfully
utilized retakes (the second attempts to pass an
exam),
information if a course is mandatory, selective
or optional for particular students with respect
to their year of admission and field of study,
number of times, when a teacher of an
investigated course taught a particular student.
KDIR2014-InternationalConferenceonKnowledgeDiscoveryandInformationRetrieval
164
4.1.2 New Social Behavior Attributes
Values defining relations between people already
exist in IS MU and they are successfully used for
personal search (Kasprzak et al., 2010). The value of
the relation can be in the interval of [100, 200] and
represents the measure of communication inside the
system between two people. The higher the number,
the stronger is the tie between the two people.
We used these values in the preliminary work
(Bydžovská et al., 2014) to create a sociogram
where students enrolled in the investigated course
and all their friends were included. This approach
had limitations: the sociogram was only a small part
of the global network and all friends of students
were included but not all of them really influenced
corresponding students (with weak ties).
To overcome these limitations we process data
about all people communicating in the information
system in this work. To favor explicitly expressed
friendships in IS MU, we add such relations to the
sociogram with the value of 300 (the strongest tie).
We also calculate different variants where rules
influence which ties are included in the sociogram.
We generate two types of a sociogram. The first
one contains data only about students of the Faculty
of Informatics (people who have an active study or
have finished a study in the last two years at the
faculty). The second one contains students, teachers
(people who taught in the previous years at the
faculty), academics and faculty staff.
For both sociogram types we build variants with
the following reductions of ties between people:
all ties,
ties stronger than the third of all
communication values,
ties stronger than the median of all
communication values,
ties stronger than the value 150,
ties that were explicitly expressed (value 300).
For these 10 sociogram variants we extract the
following social features: degree, weighted degree,
centrality, betweenness. We also compute grade
averages of all neighbors.
We also extract the following information from
IS MU:
the strongest tie with a teacher of the
investigated course,
course marked as favorite,
course attendance disclosure,
course seminar group disclosure,
course examination date disclosure,
application for the study disclosure.
4.1.3 Previously Passed Courses
The subset of courses is selected for each
investigated course with respect to the rule that
almost 20 students are enrolled in the course. This
helps to reduce the number of courses and to select
only reliable ones. We added these attributes to
datasets to find out if there is a correlation between
these courses and the investigated course.
4.2 Used Data
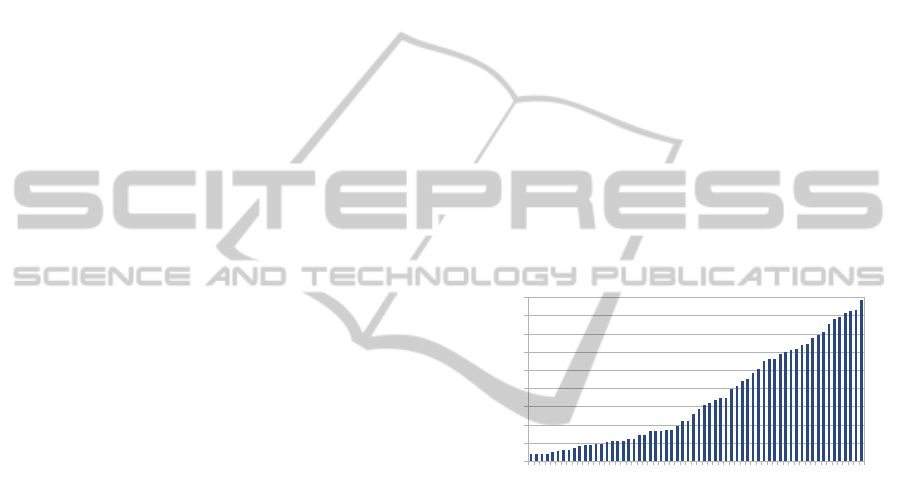
We took 62 courses offered at the Masaryk
University for bachelor and master programmes. We
selected courses where many students were enrolled
in. The experiment comprised of 7457 enrolled
students in the years 2010-2012 and their 148750
grades. Figure 2 shows the course enrollment
statistics. The most students are enrolled in the
mandatory courses for bachelor programmes. The
largest course in the data set is Mathematics I with
1767 students.
0
200
400
600
800
1000
1200
1400
1600
1800
Course
Number of enrolled students
Figure 2: Course enrollment statistics.
5 STUDENT SUCCESS
PREDICTION
The aim is to precisely predict student success or
failure in the investigated course based on the
analysis of the historical data. Approaches using
machine learning algorithms and subgroup discovery
based on comparing grade averages, association
rules and decision trees are presented in this section.
5.1 Prediction using Machine Learning
Algorithms
5.1.1 Data Sets
We extracted six datasets for each course for
machine learning processing as follows:
study-related data (SR),
TowardsStudentSuccessPrediction
165

social behavior data (SB),
study-related and social behavior data (SS),
study-related data enriched with data about
passed courses (SRC),
social behavior data enriched with data about
passed courses (SBC),
study-related and social behavior data and data
about passed courses (ALL).
5.1.2 Used ML Algorithms
We utilized different machine learning algorithms
implemented in Weka (Witten et al., 2011), namely
naive Bayes (NB), support vector machines (SMO),
instance based learning (IB1), classification rules
(PART), one rule (OneR) and decision trees (J48),
Random Forests, and also ensemble learning
methods, namely AdaBoost and Bagging. AdaBoost
algorithm achieved the best results in the
combination with Decision Stump and Bagging with
SMO or REPTree.
5.2 Subgroup Discovery
We aim at finding subgroups of students for which
the prediction could be more accurate than using ML
algorithms.
5.2.1 Grade Averages
The technique was inspired by Vialardi et al.
(Vialardi et al., 2009 and 2010). The method was
based on the comparison of the course difficulty and
values defining student potentials. The course
difficulty was defined as the average grade of all
students enrolled in the investigated course.
We have already made a similar experiment in
(Bydžovská et al., 2014) when we created an
ensemble learner from 3 classifiers (weighted
average of student grades, their friends’ weighted
average grades and weighted average grades of their
friends that attended the investigated course with the
corresponding student). The results were satisfactory
only for 4 of 5 investigated courses. That was the
reason why we extended our research with new
social attributes. As it was mentioned in Section
4.1.2, we computed average grades for each student
from all or selected student's neighbors from all
variants of sociograms. These values were able to
define the student potential.
When the student's potential was lower than the
course difficulty, it meant that the student or his or
her friends had better study results than students
attended the investigated course in the past. In this
situation we predicted success otherwise we did not
give any prediction.
5.2.2 Association Rules
For subgroup discovery (Lavrač et al., 2002; 2006)
we combined the technique of finding interesting
subsets of attribute values (by means of
discretization for continuous attributes and by
building subsets of values for categorical attributes)
with two learning algorithms—decision trees (J48)
and class association rules (Liu, 1998).
We created one data set for all investigated
courses and all students from the training set
(students enrolled in courses in 2010 and 2011) and
we found interesting rules that could be applied to
the test set (students enrolled in courses in 2012)
with high accuracy. This approach allowed us to find
general rules for the prediction of student success or
failure regardless of the specific course. It depended
only on student's study achievements. We also
explored decision trees and association rules based
on the Apriori algorithm for all courses in order to
improve the results for the corresponding subgroup
of courses.
6 RESULTS
Our goal was to precisely predict student success or
failure in the investigated courses. The most
important task was revealing such courses and such
students for which the prediction could be highly
confident.
6.1 Prediction using Machine Learning
Algorithms
Many experiments mentioned in Section 2 mined
study-related attributes for prediction. We enriched
data sets with social behavior data and data about
previously passed courses. We used 10-fold cross
validation. The prediction accuracy was 81.4% in
average.
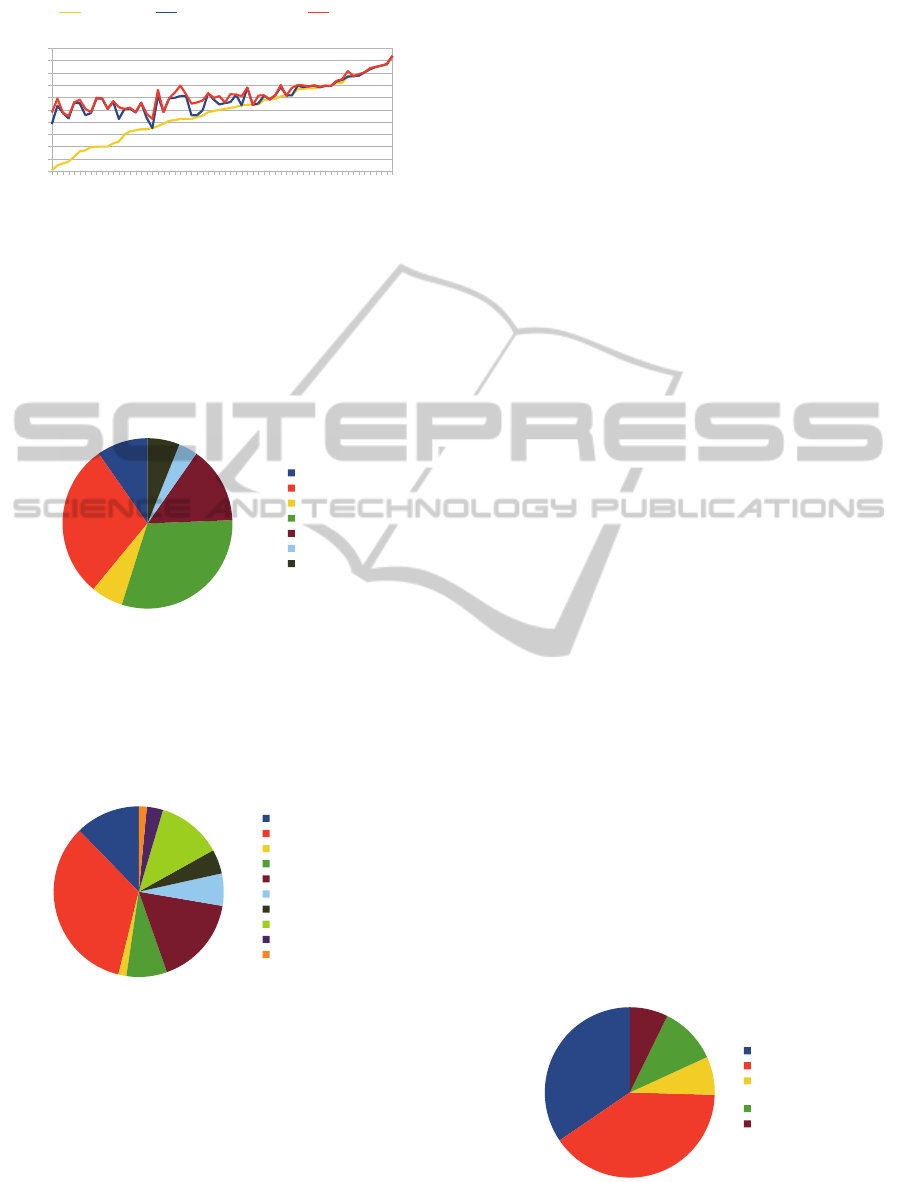
Figure 3 presents the contribution of additional
data on the investigated courses. In comparison with
baseline, the accuracy was improved by 8% in
average. In comparison with study-related data, the
accuracy was improved by 2% in average. The
maximal improvement in accuracy was 27% in
comparison with baseline and more than 5% with
using only study-related data.
KDIR2014-InternationalConferenceonKnowledgeDiscoveryandInformationRetrieval
166
50
55
60
65
70
75
80
85
90
95
100
Baseline Study-related data Best
Course
Accurac
y
Figure 3: Additional data contribution.
The distribution of best results of mining
different datasets (defined in Section 5.1.1) is
presented in Figure 4. The best results were often
obtained on study-related and social behavior data
(25 courses) and only on study-related data (24
courses). We did not improve accuracy for 8
courses.
Baseline
SR
SB
SS
SRC
SBC
ALL
Figure 4: Best data sets.
The distribution of best ML algorithms (defined
in Section 5.1.2) is presented in Figure 5. The most
accurate algorithms were SMO (22 courses),
Bagging (11 courses), and Random Forests (8
courses).
Baseline
SMO
PART
AdaBoostM1
Bagging
J48
OneR
RandomForests
NaiveBayes
IB1
Figure 5: Best ML algorithms.
We also tested the data split to the training data
(students enrolled in courses in 2010 and 2011) and
the test data (students enrolled in courses in 2012).
Based on the training data, we defined three rules to
obtain course subgroup for which predictions using
machine learning algorithms were reliable:
We were not capable of making prediction in
courses where conditions were changing
(different teacher, different students’
evaluation). The difference between success
rate of the test set and the training set was
more than 11.5%.
For courses with more than 81% successful
students in the training set, the prediction is
not suitable. In comparison with baseline the
improvements were only about 1% in average
while the average accuracy for these courses
was almost 87% in the test set.
If the course in the training set had success rate
lower than 61.5%, the algorithms improved
prediction by more than 16% in average but
the final accuracy was still lower than 80% in
the test set which was not good enough.
6.2 Subgroup Discovery
6.2.1 Grade Averages
We constructed 10 variants of the sociogram
described in 4.1.2 to be able to compare the
influence of different people to a student.
For all student averages (student's own, friends
or schoolmates with unlimited/limited ties) we
computed the precision and the recall. We were
interested in the highest precision. We observed that
the most frequently selected attributes for the
comparison with course difficulties were the
following:
student weighted average grade,
student average grade,
weighted average of explicitly expressed
schoolmates,
weighted average of schoolmates with ties
higher than 150,
weighted average of explicitly expressed
friendship,
weighted average of friends with ties higher
than 150.
Figure 6 represents the distribution of the best
results of the ties. We improved the results for more
than one fourth of all courses.
Weighted average
Average
Explicitly expressed
friendship
Ties >= 150
Rest
Figure 6: Importance of size of ties.
TowardsStudentSuccessPrediction
167
This indicates that the student potential
calculated from closer friend ties was more accurate
than when all ties were considered.
The second observation was that this technique
did not meet the expectations for courses with the
baseline lower than 60%. These courses were very
difficult and the student's or the student friends'
knowledge might not be sufficient.
For all other courses the average precision
reached 92.86%. On the other hand, these classifiers'
recall reached only 53%.
6.2.2 Association Rules
Based on the previous findings a rule with a high
accuracy for subgroups of students was found. The
weighted average grade and average grade were the
most frequently selected as the beneficial attributes
defining the student potential. Because we calculated
the weighted average grade from all grades
regardless of studies, it was lower than if only the
particular study was considered because students
always had to pass difficult courses in the first years
of bachelor studies. The first defined rule:
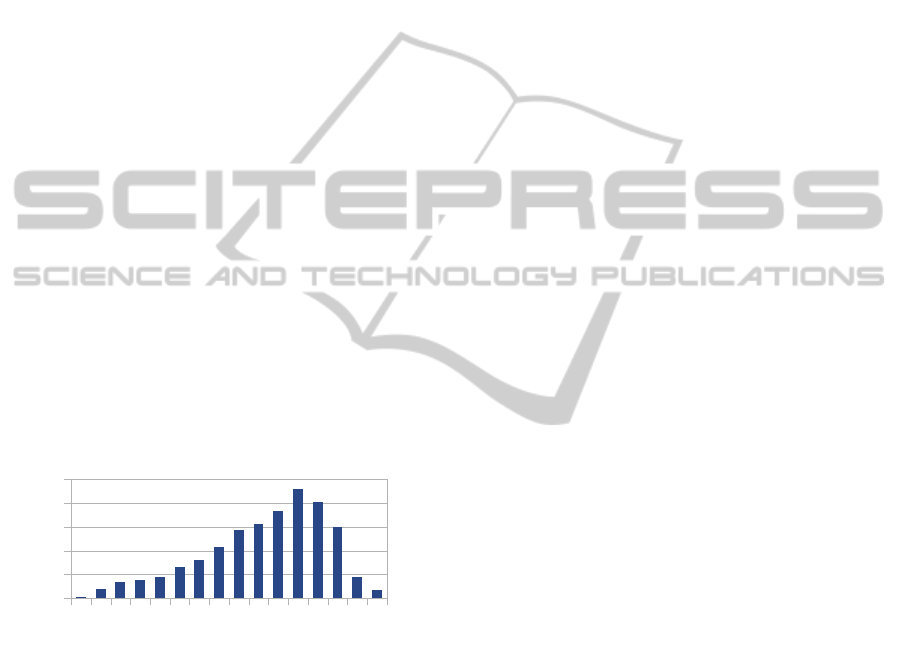
weighted average grade ≤ 2.4 → success.
The distribution of students' weighted average
grades can be seen in Figure 7. Grade 1 was the best
grade, grade 4 was the worst. The precision for this
rule was 96% and recall 24.86%.
1 1.4 1.8 2.2 2.6 3 3.4 3.8 4
0
100
200
300
400
500
Weighted average grade
Number of students
Figure 7: Weighted average grade distribution.
We also wanted to fill the gap for improvements
of very successful courses. The second defined rule:
weighted average grade ≤ 3 AND ratio of
gained credits to credits to gain > 0.8 AND
courses with success rate > 80% → success.
When we considered the whole data set, the
precision for this rule was 96.85% and the recall
23.78%. When we omitted students' success
predicted by the first rule, the precision for this rule
was 94.8% and recall 11%.
When we used both rules in sequence, the
precision is slightly higher than 96% and the recall is
almost 35%.
7 DISCUSSION
The best fitting data set for machine learning
algorithms was study-related and social behavior
data together. The next observation was that there
were no noticeable improvements when we added
data about previously passed courses into the former
data sets except for five courses which will be
objects of our future interests. Based on the results
published in Bydžovká et al., 2014, we suppose that
these attributes have a stronger influence for
improving good/bad/failure prediction or the exact
grade prediction than for success/failure prediction
based on the previous experiments.
We explored many different rules with high
precision but they had small recall. For example:
weighted average grade ≤ 3 AND successfully
finished studies at the university ≥ 2 AND
mandatory course for the specific field of
study = 'AP' → success (Precision: 97.2%,
Recall: 6.92%),
successfully finished studies at the faculty ≥ 2
AND repeating the course → success
(Precision: 97.8, Recall: 0.8%).
However, the next step will be to apply such
precise rules in sequence. We can get more accurate
prediction and improve the global recall.
If we concerned a particular course, there were
plenty of rules explored for the specific course, for
example
IA008: schoolmates attended the same course
in the past AND an average grade < 2.5 AND
a tie > 150 to a student → success (Precision:
93.75%, Recall: 7.8%).
This rule could not be applied for all courses
because of the low precision.
The next step will be finding subgroups of
courses for which such rules are suitable.
8 CONCLUSION AND FUTURE
WORK
The main contribution of this work is the
presentation of different approaches for student
success or failure prediction. The paper brings
KDIR2014-InternationalConferenceonKnowledgeDiscoveryandInformationRetrieval
168

results and discusses advantages and disadvantages
of these methods.
Machine learning algorithms can be successfully
employed with the presented data set with the
average accuracy 81.4%.
We also split the data to the training and the test
set to identify courses for which ML cannot be
successfully applied to courses with more than 81%
or less than 61.5% successful students in the training
set. The results in the test set were also not so
convincing when there was a significant difference
between the training set and the test set.
On the other hand, we can apply the following
discovered rule for easier courses. All students with
the weighted average grade ≤ 3 and the ratio of
gained credits to credits to gain > 0.8 are successful.
This fills the gap.
We also defined rules based on the grade
averages of students and their friends. One
conclusion was that the prediction was more
accurate when only close friends were considered.
This approach offered the precision about 97% but
decreased the recall to 53%.
In the future work, we intend to find the
appropriate balance of using these methods and to
combine precise association rules to get the most
accurate predictions with a reliable recall. The
courses evinced the relations with other courses will
be explored. We also intend to enrich the data with
temporal features that can improve the current
results.
These predictions will constitute a part of the
course enrollment recommender system which will
help students to select courses and warn them
against difficult courses they have to pass.
ACKNOWLEDGEMENTS
We thank Lubomír Popelínský, colleagues of
Knowledge Discovery Lab, and also all colleagues
of IS MU development team for their assistance.
This work has been partially supported by Faculty of
Informatics, Masaryk University.
REFERENCES
Bydžovská, H. and Popelínský L. 2014. Course
Recommendation from Social Data. Proceedings of
the 6
th
International Conference on Computer
Supported Education, Volume 1, pp. 268-275.
Bydžovská, H. and Popelínský L. 2014 II. The Influence
of Social Data on Student Success Prediction.
Proceedings of the 18
th
International Database
Engineering & Applications Symposium, pp. 374-375.
Jannach, D. and Zanker, M. and Felfernig, A. and
Friedrich, G. 2011. Recommender Systems An
Introduction, Cambridge University Press.
Kasprzak, J. and Brandejs, M. and Čuhel, M. and Obšívač,
T. 2010. Access rights in enterprise full-text search. In
Proceedings of the 12
th
International Conference on
Enterprise Information Systems, Volume 1, pp. 32–39.
Lavrač, N. and Železný, F. and Flach, P. A. 2002. RSD:
Relational Subgroup Discovery through First-Order
Feature Construction. In 12th International
Conference on Inductive Logic Programming, pp.
149-165.
Lavrač, N and Kavšek, B. 2006. APRIORI-SD: Adapting
Association Rule Learning to Subgroup Discovery.
Applied Artificial Intelligence, pp. 543-583.
Liu, B. and Hsu, W. and Ma, H. 1998 Integrating
classification and association rule mining. Proceedings
of the 4th international conference on Knowledge
Discovery and Data mining KDD'98, page 80-86.
AAAI Press.
Nooy, W. and Mrvar, A. and Batagelj, V. 2011.
Exploratory Social Network Analysis with Pajek.
Structural Analysis in the Social Sciences. Cambridge
University Press.
Poldin, O. and Valeeva D. and Yudkevich M. 2014.
Friendship and study assistance ties of university
students. In WP BRP Series: Sociology / SOC, pages
1-17.
Peña-Ayala, A. 2014. Educational data mining: A survey
and a data mining-based analysis of recent works. In
Expert Systems with Applications , pp. 1432–1462.
Thammasiri, D. and Delen, D. and Meesad, P. and Kasap
N. 2014. A critical assessment of imbalanced class
distribution problem: The case of predicting freshmen
student attrition. In Expert Systems with Applications
41, pp. 321–330.
Vialardi, C. and Agapito, J. and Shafti, L. and Ortigosa, A.
2009. Recommendation in higher education using data
mining techniques. In T. Barnes, M. Desmarais, C.
Romero, and S. Ventura (eds.), Proceedings of the 2nd
International Conference on Educational Data Mining
(EDM’09), pages 191–199.
Vialardi, C. and Chue, J. and Barrientos, A. and Victoria,
D. and Estrella, J. and Ortigosa, A. and Peche, J. 2010.
A case-study: Data mining applied to student
enrollment. In Proceedings of Third Educational Data
Mining Conference, Pennsylvania, USA, pages 333–
335.
Witten, I. and Frank, E and Hall, M. 2011. Data Mining:
Practical Machine Learning Tools and Techniques,
3rd edition, Morgan Kaufmann Publishers.
TowardsStudentSuccessPrediction
169
