
Equalisation of Measured Optical MIMO Channels
Andr´e Sandmann, Andreas Ahrens and Steffen Lochmann
Hochschule Wismar, University of Technology, Business and Design, Philipp-M¨uller-Straße 14, 23966 Wismar, Germany
Keywords:
Multiple-Input Multiple-Output System, Optical Fibre Transmission, Multimode fiber (MMF), Signal
Deconvolution, Equalisation.
Abstract:
Within the last years multiple-input multiple-output (MIMO) transmission has reached a lot of attention in
the optical fibre community. Theoretically, the concept of MIMO is well understood. However, practical
implementations of optical components are in the focus of interest for further computer simulations. That’s
why in this contribution the specific impulse responses of the (2 × 2) MIMO channel, including a 1.4 km
multi-mode fibre and optical couplers at both ends, are measured for operating wavelengths of 1326 nm and
1576 nm. Since semiconductor diode lasers, capable of working at different wavelengths, are used for the
characterization of the underlying optical MIMO channel, inverse filtering is needed for obtaining the respec-
tive impulse responses. However, the process of inverse filtering also known as signal deconvolution is critical
in noisy environments. That’s why different approaches such as Wiener and parametric filtering are studied
with respect to different optimization criteria. Using these obtained impulse responses a baseband MIMO data
transmission is modelled. In order to create orthogonal channels enabling a successful transmission, a MIMO
zero forcing (ZF) equaliser is implemented and analysed. Our main results given as an open eye-diagram and
calculated bit-error rates show the successful implementation of the MIMO transmission system.
1 INTRODUCTION
Aiming at further increasing the fibre capacity in opti-
cal transmission systems the concept of MIMO, well
studied and wide-spread in radio transmission sys-
tems, has led to increased research activities in this
area (Singer et al., 2008; Winzer, 2012; Richardson
et al., 2013). Theoretical investigations have shown
that similar capacity increases are possible compared
to wireless systems (K¨uhn, 2006; Tse and Viswanath,
2005). The basis for this approach is the exploitation
of the different optical mode groups. However, the
practical implementation has to cope with many tech-
nological obstacles such as mode multiplexing and
management. This includes mode combining, mode
maintenance and mode splitting. In order to improve
existing simulation tools practical measurements are
needed. That’s why in this contribution a whole opti-
cal transmission testbed is characterized by its respec-
tive impulse responses obtained by high-bandwidth
measurements.
In order to describe the optical MIMO testbed at
different operating wavelengths semiconductor laser
diodes with a pulse width of 25 ps are used. Since
the used picosecond laser generator doesn’t guaran-
tee a fully flat frequency spectrum in the region of
interest, inverse filtering has to be applied to obtain
the MIMO impulse responses. However, the process
of inverse filtering also known as signal deconvolu-
tion is critical in noisy environments. That’s why dif-
ferent approaches such as Wiener and parametric fil-
tering are studied with respect to different optimiza-
tion criteria such as the mean square error (MSE)
and the imaginary error parameter introduced by Gans
(Gans, 1986). Using the measured impulse responses
a MIMO baseband transmission system can be con-
structed. In order to exploit the full potential of the
MIMO system, properly selected signal processing
strategies haveto be applied. The focus of this work is
on the whole testbed functionality including the signal
processing needed to separate the data streams. Based
on computer simulations the end-to-end functionality
of the whole testbed is demonstrated and appropriate
quality criteria such as the eye-diagram and the the
bit-error rate (BER) are calculated.
The novelty of this paper is given by the proven
testbed functionality, which includes the whole
electro-optical path with the essential optical MIMO
components of mode combining and splitting. The
next logical step is the implementation of the MIMO
37
Sandmann A., Ahrens A. and Lochmann S..
Equalisation of Measured Optical MIMO Channels.
DOI: 10.5220/0005019600370044
In Proceedings of the 5th International Conference on Optical Communication Systems (OPTICS-2014), pages 37-44
ISBN: 978-989-758-044-4
Copyright
c
2014 SCITEPRESS (Science and Technology Publications, Lda.)
receiver modules such as automatic clock recovery,
frame synchronisation, channel estimation and equal-
isation as demonstrated in (K¨ohnke et al., 2014).
The remaining part of the paper is structured as
follows: In section 2 the optical MIMO testbed and
its corresponding system model are introduced. The
further processing of the measured impulse responses,
which is carried out by inverse filtering, is described
in section 3. The obtained results are given in Section
4. Finally, Section 5 shows our concluding remarks.
2 OPTICAL MIMO SYSTEM
MODEL
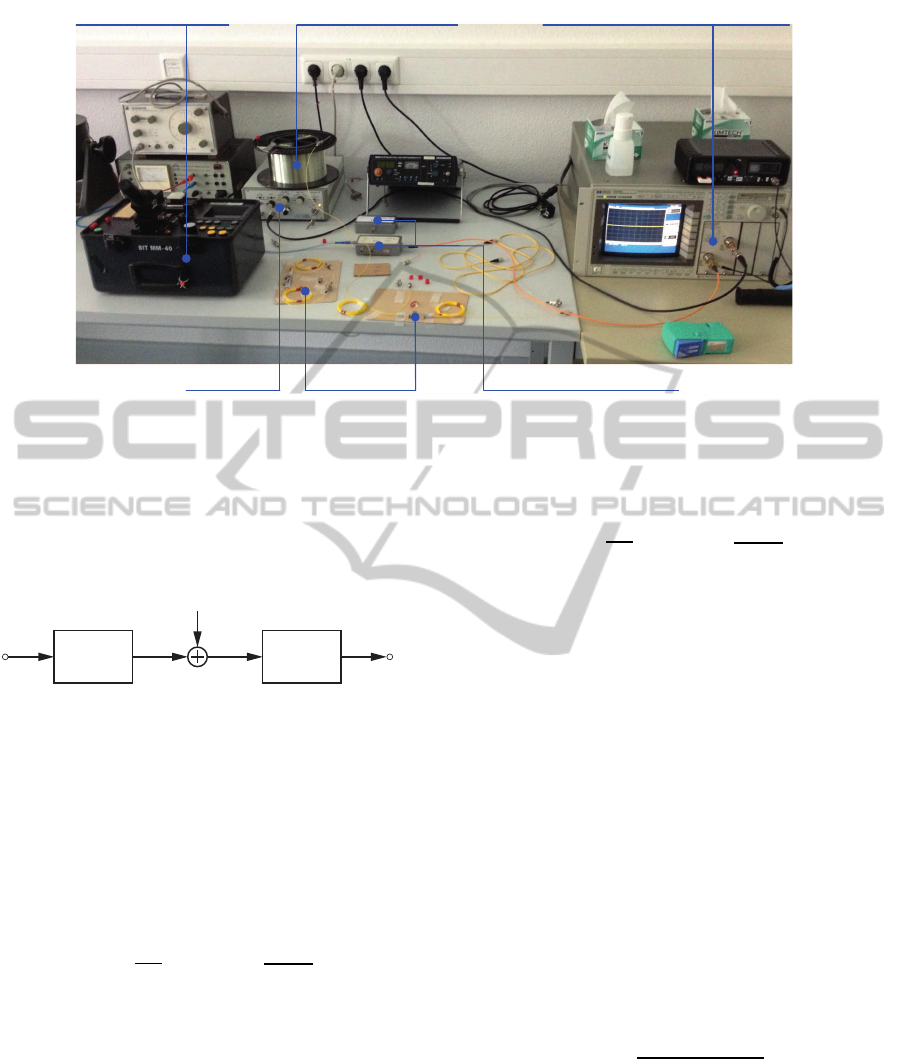
An optical MIMO system can be formed by feeding
different sources of light into the fibre, which activate
different optical mode groups. This can be carried out
by using centric and eccentric light launching condi-
tions and subsequent combining of the activated dif-
ferent mode groups with a fusion coupler as show in
Fig. 1 (Ahrens and Lochmann, 2013; Sandmann et al.,
2014).
(low order mode path)
(high order mode path)
1
2
3
Figure 1: Transmitter side fusion coupler for launching dif-
ferent sources of light into the MMF.
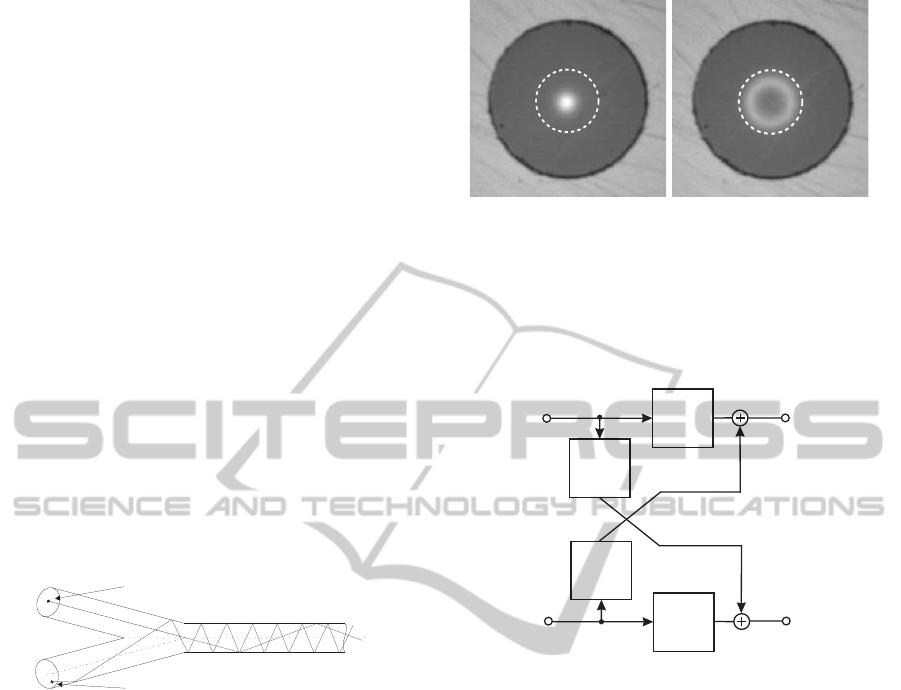
The different sources of light lead to different
power distribution patterns at the fibre end depending
on the transmitter side light launch conditions. Fig. 2
highlights the measured mean power distribution pat-
tern at the end of a 1.4 km multi-mode fibre. At the
end of the MMF transmission line a similar fusion
coupler is used for splitting the different mode groups.
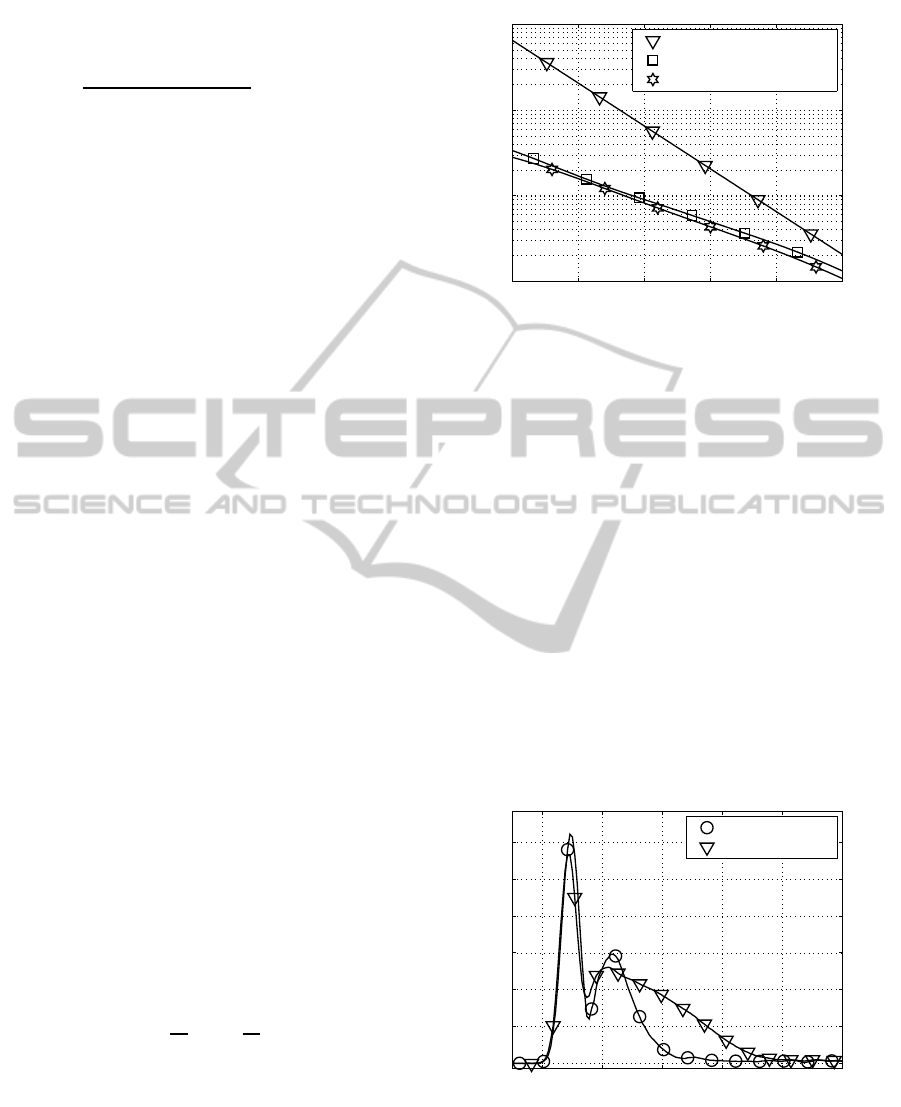
The measurement setup depicted in Fig. 3 shows
the testbed with the utilized devices for measuring
the system properties of the optical MIMO channel
in form of its specific impulse responses needed for
modelling the MIMO data transmission.
A picosecond laser unit is chosen for generating
the 25 ps input pulse. This input pulse is used to
measure separately the different single-input single-
output (SISO) channels within the MIMO system.
Since the used picosecond laser unit doesn’t guar-
antee a fully flat frequency spectrum in the region
of interest, the captured signals have to be decon-
volved. The obtained impulse responses are forming
the base for modelling the MIMO transmission sys-
Figure 2: Measured mean power distribution pattern when
using the fusion coupler at the transmitter side (left: cen-
tric mode excitation; right: eccentric mode excitation); the
dotted line represents the 50µm core size.
tem. Fig. 4 highlights the resulting electrical MIMO
system model.
u
s 1
(t)
u
s 2
(t)
u
k 1
(t)
u
k 2
(t)
g
11
(t)
g
21
(t)
g
12
(t)
g
22
(t)
Figure 4: Electrical MIMO system model (example: n = 2)
3 MEASUREMENT CAMPAIGN
AND SIGNAL
DECONVOLUTION
Since the process of signal deconvolution is critical in
noisy environments, different filtering processes such
as Wiener and parametric filtering are studied in order
to guarantee a high quality of the deconvolution pro-
cess defined by the mean square error (MSE) and the
imaginary error parameter introduced by Gans (Gans,
1986).
A linear time-invariant system is defined uniquely
by its impulse response, or its Fourier transform as
the corresponding transfer function. For the determi-
nation of the impulse response g
k
(t) (see also Fig. 5)
an appropriate formed input signal u
1
(t) is needed.
Unfortunately, an ideal Dirac delta pulse with a fre-
quency independent transfer function is practically
not viable. In real systems adequate impulses com-
pared to the Dirac delta pulse must be used. For
the determination of the impulse response in optical
transmission systems impulses as specified in (Ahrens
OPTICS2014-InternationalConferenceonOpticalCommunicationSystems
38
Light Launching Unit (splicer) 1.4 km multi-mode fibre channel Sampling Oscilloscope with MSM Photo Detector
Picosecond Laser Laser-diode ( ≈ 1.3 μm or 1.55 µm)Fusion Couplers
Figure 3: Measurement setup for determining the MIMO specific impulse responses.
et al., 2013) have proven to be useful. Addition-
ally, when analysing the characteristics of any prac-
tical system, the measured impulse u
3
(t) is affected
by noise. The resulting transmission system model is
depicted in Fig. 5. The measured impulse u
3
(t) can
u
1
(t)
u
4
(t)
g
k
(t)
n(t)
h(t)
u
2
(t) u
3
(t)
Figure 5: Transmission system model.
be decomposed into two parts, namely, the low-pass
filtered output signal u
2
(t) and the noise part n(t) re-
sulting in
u
3
(t) = u
1
(t) ∗ g
k
(t) + n(t) . (1)
In the absence of the noise term, i. e. n(t) = 0, the
system characteristic g
k
(t) can be easily obtained by
inverse filtering and is given as
g
k
(t)
c
s
G
k
( f) =
U
3
( f)
U
1
( f)
. (2)
Unfortunately, the measured impulse u
3
(t) is affected
by the noise term n(t), which is assumed the be white
and Gaussian distributed. Under these conditions in-
verse filtering is not working properly anymore. In
order to improve the quality of the signal deconvolu-
tion different filter functions h(t) are applied and the
filtered signal results in
u
4
(t) = u
1
(t) ∗ g
k
(t) ∗ h(t) + n(t) ∗ h(t) . (3)
This filter operation affects both the low-pass filtered
output signal u
2
(t) and the noise term n(t). With an
appropriate selected filter function the estimation of
the impulse response g
k
(t) yields to
ˆg
k
(t)
c
s
ˆ
G
k
( f) =
U
4
( f)
U
1
( f)
. (4)
Hereinafter, two different filter functions are stud-
ied to estimate the impulse response g
k
(t) based on
the measured impulse u
3
(t). Commonly, the mean
square error (MSE) between the impulse response
g
k
(t) and the estimated impulse response ˆg
k
(t) is cho-
sen as a quality indicator. It is expressed as
F
MSE
= E{[g
k
(t) − ˆg
k
(t)]
2
} −→ min. , (5)
where E{·} denotes the expectation functional.
Firstly, the Wiener filter h
w
(t) is investigated. It is
based on finding the optimal solution for minimizing
the MSE when comparing the signal u
2
(t) with the
filter output signal u
4
(t). It is calculated as
E{[u
2
(t) − u
3
(t) ∗ h
w
(t)]
2
} −→ min. , (6)
Assuming the signal u
2
(t) and the noise n(t) are un-
correlated, the Wiener filter transfer function results
in (Vaseghi, 2000, pp. 191-194)
H
w
( f) =
S
22
( f)
S
22
( f)+ S
nn
( f)
, (7)
where S
22
( f) is the power spectral density (PSD) of
the signal u
2
(t) and S
nn
( f) is the noise PSD of the
signal n(t).
A more simple filter choice when estimating the
impulse response g
k
(t) is represented by predefined
parametric filter functions. A possible transfer func-
tion presented in (Nahman and Guillaume, 1981) and
EqualisationofMeasuredOpticalMIMOChannels
39
studied more closely in (Sandmann et al., 2013) is
given by
H
R
( f) =
|U
1
( f)|
2
|U
1
( f)|
2
+ γ· |C( f)|
2
, γ ∈ R , (8)
with:
|C( f)|
2
= 6− 8cos(2πfT
a
) + 2cos(4πfT
a
) , (9)
where T
a
is the sampling period. The regularisation
function H
R
( f) is a low-pass filter with the parame-
ter γ influencing the sharpness of the filter and hence
determining the cutoff frequency. In order to appro-
priately select this parameter the MSE criterion (5)
can be applied for the optimisation. In practical mea-
surements the knowledge of the original impulse re-
sponse g
k
(t) is not given. Therefore, another criterion
is needed in order to properly select the γ-parameter
for practical measurements. A promising criterion
was introduced by Gans (Gans, 1986), where the root
mean square of the deconvolved imaginary part of
ˆg
k
(t) is used for finding the parameter of the regu-
larisation function. This optimisation criterion can be
expressed as
F
Gans
= E{[Im{ ˆg
k
(t,γ)}]
2
} −→ min. . (10)
Using this criterion multiple local minima can occur
and therefore another criterion described by Nahman
and Guillaume in (Nahman and Guillaume, 1981, pp.
22) should be taken into consideration when choos-
ing the γ value of the regularisation filter. This error
criterion is defined as the MSE between the measured
receive signal u
3
(t) and the simulated receive signal
u
1
(t) ∗ ˆg
k
(t,γ), where u
1
(t) is the measured input im-
pulse. It is described as follows
F
Error
(γ) = E{[u
3
(t) − u
1
(t) ∗ ˆg
k
(t,γ)]
2
} . (11)
In order to compare the quality of the estimated
impulse responses using the regularisation filter to the
quality achieved by the Wiener filter, the following
system is studied: The input impulse is a Dirac delta
pulse with u
1
(t) = U
s
T
s
δ(t), withU
s
= 1 V, T
s
= 1 ms
and T
s
/T
a
= 20. The chosen impulse response is
g
k
(t) =
1
T
s
rect
t
T
s
. (12)
In this case the filter output signal u
2
(t) is an rectan-
gular impulse with the amplitude U
s
. The deconvolu-
tion quality results are depicted in Fig. 6 as a function
of the signal-to-noise-ratio E
s
/N
0
with the parameter
E
s
defining the signal energy of u
2
(t) and the noise
power spectral density N
0
of the signal n(t).
When applying the regularisation filter H
R
( f) the
optimal γ values as well as the MSE are decreasing
25 30 35 40 45 50
10
2
10
3
10
4
10
5
10 · lg(E
s
/N
0
) (indB) →
F
MSE
→
without filtering
H
R
(f) with MSE Criterion
Wiener filter
Figure 6: Quality F
MSE
of the deconvolved impulse re-
sponses as a function of signal energy to noise power spec-
tral density using different filter functions.
with increasing E
s
/N
0
. Therein the parameter E
s
de-
scribes the average symbol energy und N
0
the power
spectral density of the white noise process n(t). The
achievable quality of the estimated impulse responses
using the regularisation filter together with the MSE
optimisation criterion comes close to the Wiener filter
results. The benefit of using a filter function is clearly
visible.
In order to determine the quality of the estimated
impulse responses, which are practically obtainable
using the Gans’ criterion (10), the following opti-
cal system configuration at a operating wavelength at
1576 nm is studied: The measured input impulse of
the picosecond laser is depicted in Fig. 7 for different
operating wavelengths with a pulse width of approxi-
mately 25 ps. The impulse response is now assumed
0 0.1 0.2 0.3 0.4 0.5
0
5
10
15
20
25
30
t (inns) →
u
1
(t) (inmV) →
λ = 1326 nm
λ = 1576 nm
Figure 7: Measured input impulses at different operating
wavelengths λ.
to be Gaussian
g
k
(t) = Ae
−π(t/T
s
)
2
, (13)
where T
s
= 0.8 ns and T
s
/T
a
= 200. The scaling fac-
tor A is chosen to maintain E
s
/T
s
= 1V
2
of the sig-
OPTICS2014-InternationalConferenceonOpticalCommunicationSystems
40
nal u
2
(t) and to ensure the unit s
−1
of the impulse
response. Fig. 8 shows the quality of the obtained
impulse responses using the two filter functions men-
tioned before. The regularisation filter is applied for
both optimisation criteria resulting in γ values de-
picted in Fig. 9. The γ values are also decreasing with
30 35 40 45 50
10
18
10
19
10
20
10
21
10 · lg(E
s
/N
0
) (indB) →
F
MSE
→
H
R
(f) with MSE Criterion
H
R
(f) with Gans Criterion
Wiener fil ter
Figure 8: Quality F
MSE
of the deconvolved impulse re-
sponses as a function of signal energy to noise power spec-
tral density using different filter functions.
30 35 40 45 50
10
−18
10
−17
10 · lg(E
s
/N
0
) (indB) →
γ →
γ
opt
(MSE Criterion)
γ
opt
(Gans Criterion)
Figure 9: Choice of optimal γ when filtering with H
R
( f)
minimizing the MSE and using the Gans criterion.
increasing E
s
/N
0
for both criteria. It should be noted,
that the γ values using the Gans’ criterion are lower
compared to the MSE criterion. This signifies that the
measured signal u
3
(t) is filtered less when applying
the filter using the Gans’ criterion in contrast to us-
ing the MSE criterion. As expected, the deconvolved
impulse responses using the Wiener filter are showing
the best quality of all applied filter functions closely
followed by the estimated impulse responses filtered
with the regularisation function using the MSE opti-
misation criterion. The quality of the estimated im-
pulse responses using the Gans’ criterion is still ac-
ceptable for a wide range of E
s
/N
0
values and pro-
vides a major improvement compared to the quality
without filtering. The obtained results show further
that the parametric regularisation filter function is a
good compromise compared to the Wiener filter with
its high complexity.
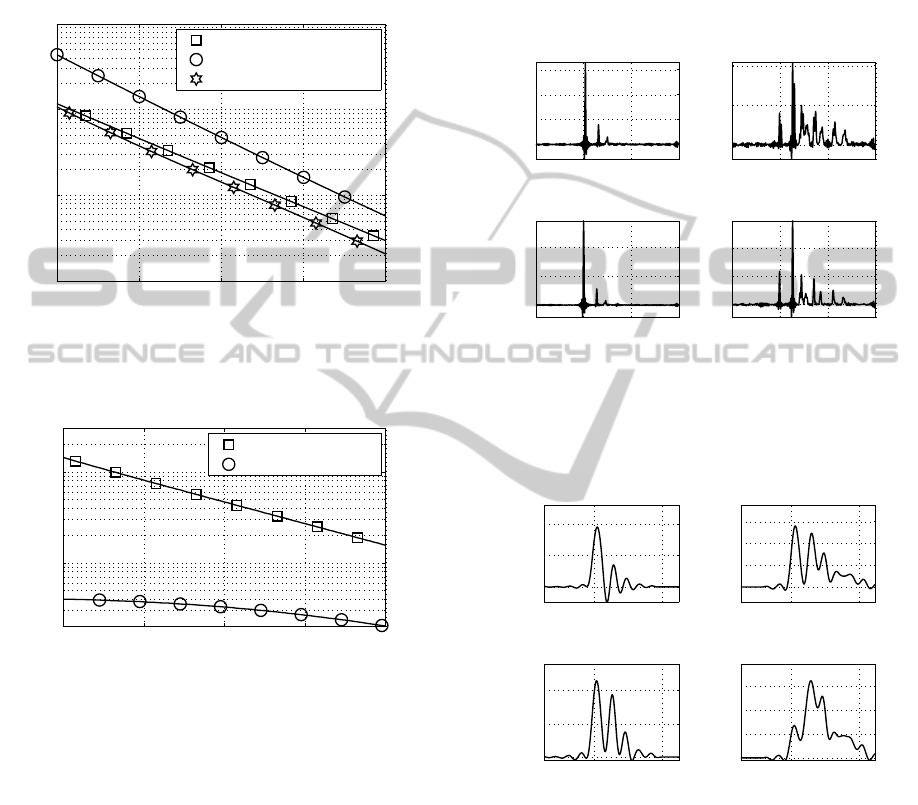
Applying the described deconvolution processing
to the (2 × 2) MIMO testbed, the obtained impulse
responses are depicted in Fig. 10-11. They are calcu-
lated by applying the regularisation filter in the decon-
volution process with γ values respecting the Gans’
and Error criterion. At an operating wavelength of
1 2 3 4
0
2
4
6
1 2 3 4
0
0.5
1
1 2 3 4
0
5
10
1 2 3 4
0
1
2
t (inns) →t (inns) →
t (inns) →t (inns) →
T
s
g
1 1
(t) →
T
s
g
1 2
(t) →
T
s
g
2 1
(t) →
T
s
g
2 2
(t) →
γ ≈ 1.20E − 10
γ ≈ 8.61E − 10
γ ≈ 1.43E − 10 γ ≈ 6.76E − 10
Figure 10: Deconvolved measured electrical MIMO im-
pulse responses with respect to the pulse frequency f
T
=
1/T
s
= 620 MHz at 1326 nm operating wavelength using
the regularisation filter function with γ values according to
the Gans’ criterion.
2 4
0.0
0.5
1.0
2 4
0
0.1
0.2
0.3
2 4
0
0.1
0.2
2 4
0
0.05
0.1
0.15
t (inns) →t (inns) →
t (inns) →t (inns) →
T
s
g
1 1
(t) →
T
s
g
1 2
(t) →
T
s
g
2 1
(t) →
T
s
g
2 2
(t) →
γ = 0.0146
γ = 0.0168
γ = 0.0174
γ = 0.0229
Figure 11: Deconvolved measured electrical MIMO im-
pulse responses with respect to the pulse frequency f
T
=
1/T
s
= 620 MHz at 1576 nm operating wavelength using
the regularisation filter function with γ values according to
the Gans’ criterion.
1326 nm the modal structure can be identified. Con-
sidering the 1576 nm results the additional influence
of the chromatic dispersion is clearly visible.
EqualisationofMeasuredOpticalMIMOChannels
41
4 MIMO EQUALISATION AND
SIMULATION RESULTS
In this section the MIMO baseband transmission sys-
tem is constructed as illustrated in Fig. 12. It uses
the deconvolved (2 × 2) MIMO specific impulse re-
sponses g
i, j
(t) (for i = 1, 2 and for j = 1,2) depicted
in Fig. 11 at 1576 nm operating wavelength. In
this baseband system model the transmitter forms a
rectangular pulse train and hence the transmit filter
g
s
(t) and the receive filter g
ef
(t) are considered to be
matched filters and are described in its non causal no-
tation with
g
s
(t) = g
ef
(t) =
1
T
s
rect
t
T
s
. (14)
The total transmit power is normalised to P
s
=
1V
2
and a symbol pulse frequency of f
T
= 1/T
s
=
620 MHz per data channel is used resulting in a total
bit rate of 1.24 Gb/s for both channels. Both transmit
signals u
s, j
(t) are launched onto the (2 × 2) MIMO
channel. The filtered receive signals u
e,i
(t) are sam-
pled with kT
s
, where k ∈ Z. The system can be sim-
plified by introducing the cumulativechannel impulse
response h
i, j
(t) and the filtered noise w
i
(t) expressed
as follows
h
i, j
(t) = g
s
(t) ∗ g
i, j
(t) ∗ g
ef
(t), h
i, j
(k) = h
i, j
(t)
kT
s
w
i
(t) = n
i
(t) ∗ g
ef
(t), w
i
(k) = w
i
(t)
kT
s
(15)
By utilising a data block transmission model (Raleigh
and Cioffi, 1998; Raleigh and Jones, 1999) a vectorial
notation can be applied as follows
c =
c[1] c[2] ··· c[K]
T
h
i, j
=
h
i, j
[1] h
i, j
[2] ·· · h
i, j
[L]
T
.
(16)
Using the convolution matrices H
i, j
the transmission
model can be described as
u
1
= H
11
· c
1
+ H
12
· c
2
+ w
1
u
2
= H
21
· c
1
+ H
22
· c
2
+ w
2
.
(17)
Written in matrix notation
u
1
u
2
=
H
11
H
12
H
21
H
22
·
c
1
c
2
+
w
1
w
2
. (18)
Simplifying this equation results in
u = H· c+ w , (19)
where the channel matrix H contains the ISI as well
as the crosstalk information. For obtaining the trans-
mitted symbols unaffected from the channel
F· H = I (20)
has to be fulfilled, where I is a identity matrix and
thus the equaliser matrix F can be obtained as follows
F = (H
H
H)
−1
H
H
. (21)
Hereinafter, the equaliser matrix F is applied to the
received data vector u
y = F· u
y = c+ F· w .
(22)
The benefit of applying this zero forcing (ZF)
equaliser is the orthogonalisation of the transmission
channels. Thus, the resulting equalised MIMO sys-
tem can be described by two independent single input
single output (SISO) channels. The disadvantage of
using the ZF equaliser is the weighting of the noise
term.
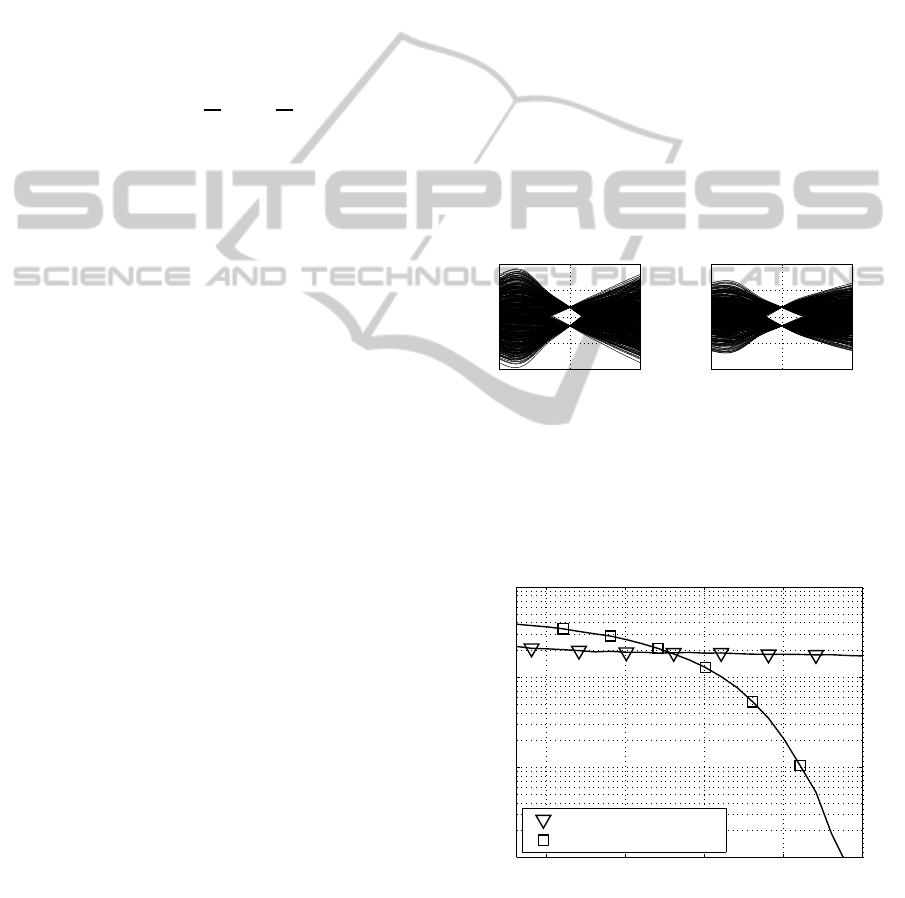
Eye diagrams of both received signals in the
MIMO system after equalisation are shown in Fig. 13.
Using the ZF equaliser both eyes are fully opened
−0.5 0 0.5
−4
−2
0
2
4
t/T
s
→
y
1
(t) (inV) →
−0.5 0 0.5
−4
−2
0
2
4
t/T
s
→
y
2
(t) (inV) →
Figure 13: Eye diagram patterns of both received signals
when applying zero forcing equalisation.
confirming its functionality. The MIMO bit-error rate
(BER) simulation results are depicted in Fig. 14 and
underline the functionality of the equaliser.
5 10 15 20 25
10
−3
10
−2
10
−1
10
0
P
BER
→
10 · lg(E
b
/N
0
) (indB) →
without equaliser
ZF equaliser
Figure 14: (2× 2) MIMO BER probability results with and
without applying the zero forcing equalising method using
the deconvolved MIMO impulse responses at 1576 nm op-
erating wavelength and transmitting with a bit rate of 1.24
Gb/s.
OPTICS2014-InternationalConferenceonOpticalCommunicationSystems
42

c
1
(k)
c
2
(k)
u
s1
(t)
u
s2
(t)
n
1
(t)
n
2
(t)
u
e1
(t)
u
e2
(t)
u
1
(k)
u
2
(k)
y
1
(k)
y
2
(k)
d
1
(k)
d
2
(k)
g
s
(t)
g
s
(t)
g
ef
(t)
g
ef
(t)
g
11
(t)
g
12
(t)
g
21
(t)
g
22
(t)
kT
s
kT
s
F
transmitter
MIMO − channel
receiver
Figure 12: (2× 2) MIMO baseband transmission system model with discrete zero forcing equaliser.
5 CONCLUSIONS
In this contribution a (2 × 2) optical MIMO commu-
nication system, consisting of a 1.4 km multi-mode
fibre and optical couplers attached to both ends, has
been analysed. The estimations of the MIMO spe-
cific impulse responses have been obtained for op-
erating wavelengths of 1576 nm and 1326 nm using
optimized signal deconvolution by applying the para-
metric regularisation filter. It has been shown that
the quality of the estimated impulse responses signifi-
cantly improvesand is comparable to Wiener filtering.
These estimated impulse responses have been used
for modelling a baseband MIMO data transmission
system. In order to receive the transmitted data unaf-
fected from the data send on the neighbouring channel
zero forcing equalisation has been investigated. The
successful implementation has been shown by the bit-
error curves as well as by the open eye-diagram.
ACKNOWLEDGEMENTS
This work has been funded by the German Ministry
of Education and Research (No. 03FH016PX3).
REFERENCES
Ahrens, A. and Lochmann, S. (2013). Optical Couplers in
Multimode MIMO Transmission Systems: Measure-
ment Results and Performance Analysis. In Interna-
tional Conference on Optical Communication Systems
(OPTICS), pages 398–403, Reykjavik (Iceland).
Ahrens, A., Schr¨oder, A., and Lochmann, S. (2013). Disper-
sion Analysis within a Measured 1,4 km MIMO Mul-
timode Channel. In International Conference on Op-
tical Communication Systems (OPTICS), pages 391–
397, Reykjavik (Island).
Gans, W. L. (1986). Calibration and Error Analysis of a
Picosecond Pulse Waveform Measurement System at
NBS. Proceedings of the IEEE, 74(1):86–90.
K¨ohnke, H., Schwinkendorf, R., Daase, S., Ahrens, A., and
Lochmann, S. (2014). Receiver Design for an Optical
MIMO Testbed. In International Conference on Opti-
cal Communication Systems (OPTICS), Vienna (Aus-
tria).
K¨uhn, V. (2006). Wireless Communications over MIMO
Channels – Applications to CDMA and Multiple An-
tenna Systems. Wiley, Chichester.
Nahman, N. S. and Guillaume, M. E. (1981). Deconvolution
of Time Domain Waveforms in the Presence of Noise.
National Bureau of Standards Technical Note 1047,
Boulder, Colorado 80303.
Raleigh, G. G. and Cioffi, J. M. (1998). Spatio-Temporal
Coding for Wireless Communication. IEEE Transac-
tions on Communications, 46(3):357–366.
Raleigh, G. G. and Jones, V. K. (1999). Multivariate
Modulation and Coding for Wireless Communication.
IEEE Journal on Selected Areas in Communications,
17(5):851–866.
Richardson, D. J., Fini, J., and Nelson, L. (2013). Space
Division Multiplexing in Optical Fibres. Nature Pho-
tonics, 7:354–362.
Sandmann, A., Ahrens, A., and Lochmann, S. (2013).
Signal Deconvolution of Measured Optical MIMO-
Channels. In XV International PhD Workshop OWD
2013, pages 278–283, Wisa, Poland.
Sandmann, A., Ahrens, A., and Lochmann, S. (2014). Ex-
perimental Description of Multimode MIMO Chan-
nels utilizing Optical Couplers. In 15. ITG-
Fachtagung Photonische Netze, Leipzig (Germany).
Singer, A. C., Shanbhag, N. R., and Bae, H.-M. (2008).
Electronic Dispersion Compensation– An Overwiew
of Optical Communications Systems. IEEE Signal
Processing Magazine, 25(6):110–130.
EqualisationofMeasuredOpticalMIMOChannels
43

Tse, D. and Viswanath, P. (2005). Fundamentals of Wireless
Communication. Cambridge, New York.
Vaseghi, S. (2000). Advanced Digital Signal Processing
and Noise Reduction, Second Edition. John Wiley &
Sons Ltd, Chichester.
Winzer, P. (2012). Optical Networking beyond WDM.
IEEE Photonics Journal, 4:647–651.
OPTICS2014-InternationalConferenceonOpticalCommunicationSystems
44
