A Study for Automatic Diagnosing System of Parkinson Disease
A Systematic Analysis of Parkinsonian Tremor by Accelerometer
Ichiro Fukumoto
Institute of Biological Engineering, Nagaoka University of Technology, Nagaoka city, Niigata, Japan
Keywords: Parkinson Disease, Physiological Diagnosis, Biofeedback, Accelero-Meter, Main Frequency.
Abstract: New objective diagnosing methods of Parkinson Disease is proposed with 3 D accelerometers. A
mathematical model based on the peripheral feedback theory is tested by computer simulation with good
coincident with the clinical data. We have found the main frequency of Parkinsonian tremor is about 4Hz in
arms comparing the one of physiological tremor (8Hz). Patients in L-Dopa treatment have been measured
by the system that corresponds well to a parameter F
gk
that indicates the fatigue of intrafusal muscle.
Biofeedback training by sound and visual parameters are also proved with good tremor improvement in its
main frequency and severity.
1 INTRODUCTION
The Parkinson’s disease (morbidity 0.1%) is
etiology unknown neurologic disease that makes
adults unable to work with three main symptoms
(tremor, rigidity, bradykinesia). The problem of the
diagnosis depends upon the neurologists’ subjective
decision. We have been trying to help non-specialist
using an automatic diagnosing unit with 3D
accelerometers.
2 TREMOR MEASUREMENT
The tremor measurement was executed on four
tremor patients as a preliminary experiment using an
accelerometer and the data was analyzed by FFT
(Fig.1). They have 2-4Kg weights in order to cause
their tremor.
Figure 1: Tremor measuring system.
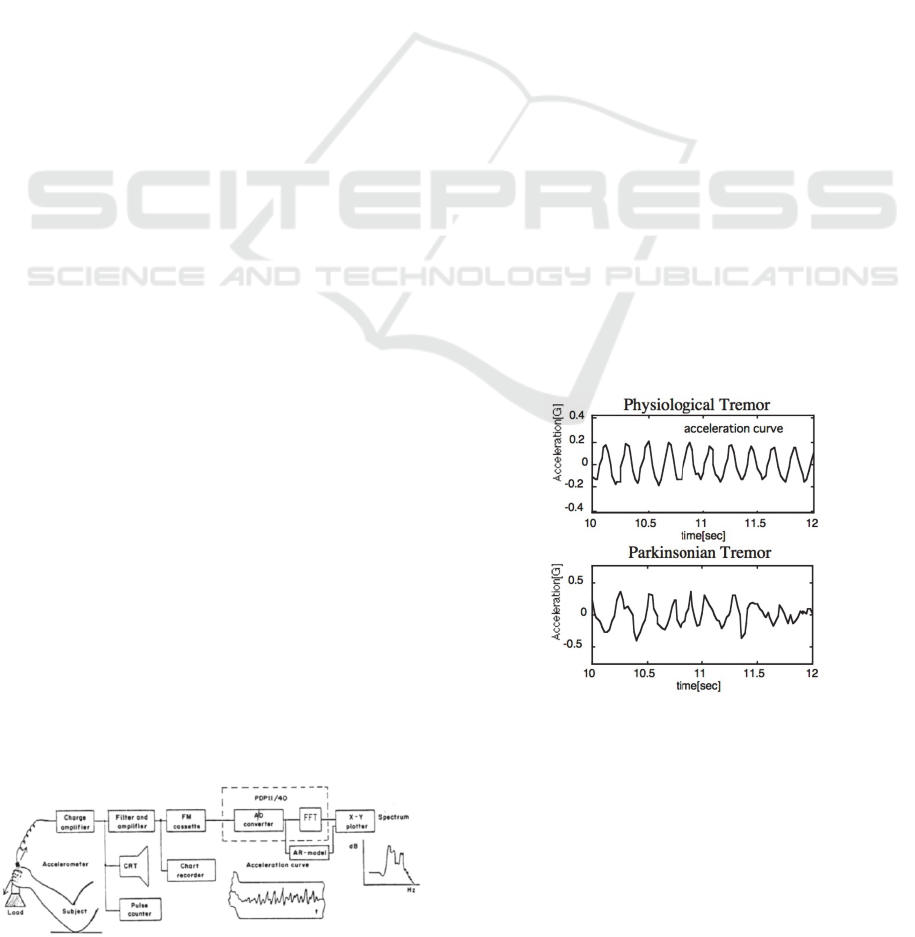
The obtained tremor graph is clearly
distinguished in two groups, namely Parkinson
tremor and Physiological tremor (Fig.2).
Figure 2: Parkinson tremor and Physiological tremor.
Measured tremor graph is analyzed by FFT
(Fig.3) and we have found that the main frequency
of Parkinson tremor is about 4Hz and the
physiological tremor is about 8Hz in arms. The
severity of tremor is classified in five levels from 0
(no tremor) to 4 (most severe) subjectively by a
tremor specialist. The two tremor groups are plotted
in one graph by the tremor severity level (Fig.4).
They can also be divided in two groups clearly and
Parkinson tremor has tendency of negative
correlation between the severity and the main
frequency.
164
Fukumoto I..
A Study for Automatic Diagnosing System of Parkinson Disease - A Systematic Analysis of Parkinsonian Tremor by Accelerometer.
DOI: 10.5220/0005016301640168
In Proceedings of the 11th International Conference on Informatics in Control, Automation and Robotics (ICINCO-2014), pages 164-168
ISBN: 978-989-758-039-0
Copyright
c
2014 SCITEPRESS (Science and Technology Publications, Lda.)
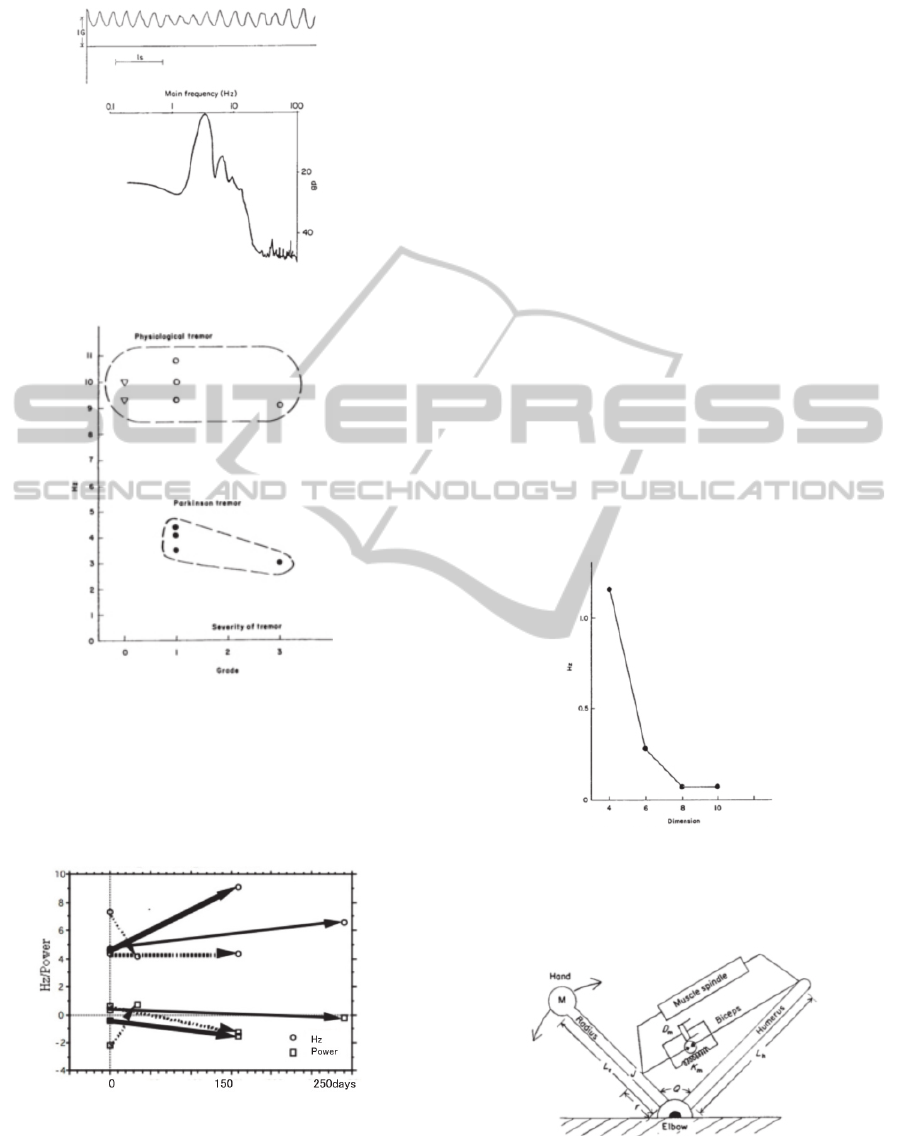
Figure 3: FFT analysis of tremor.
Figure 4: Correlation between tremor severity and main
frequency.
Six Parkinson patients in L-Dopa treatment are
examined using the measuring system. The tremor
power in the accelerometers’ output (mV) is plotted
in the same graph (Fig.5).
Figure 5: Tremor change by L-Dopa treatment.
Almost all patients except one show the
increased main frequency and the decreased tremor
power. The one patient has On-Off phenomenon
that means the failure in pharmacological treatment.
3 MODEL & SIMULATION
There are two hypotheses on the cause of Parkinson
tremor namely the central oscillation theory and the
peripheral feedback theory. The former thinks that
there are oscillators in bran stem that may activate
skeletal muscle to elicit tremor at certain determined
tremor frequencies. The latter insists that the tremor
may be caused by the feedback loop between the
skeletal muscle and the motor neuron in bone
marrow. The obtained data from our experiment
show that the main frequency can be changed by
medical treatment, which means the peripheral
feedback theory is more likely true.
But it is almost impossible to be certified
because human brain is too complicated and very
difficult to be analyzed anatomically. Computer
simulation on the mathematical model is another
way to prove the hypotheses.
Auto-regression analysis (AR) is executed in
order to get the number of independent parameters
on the Parkinson patients’ tremor (Fig.6). It shows
that eight independent parameters are enough to
describe the tremor producing system.
Figure 6: AR model analysis of Parkinson Tremor.
A mechanical oscillating model is constructed
for the human forearm tremor (Fig.7).
Figure 7: Forearm oscillation model.
The muscle spindle is also made using central
modifiable intra spindle muscle (Fig.8).
AStudyforAutomaticDiagnosingSystemofParkinsonDisease-ASystematicAnalysisofParkinsonianTremorby
Accelerometer
165
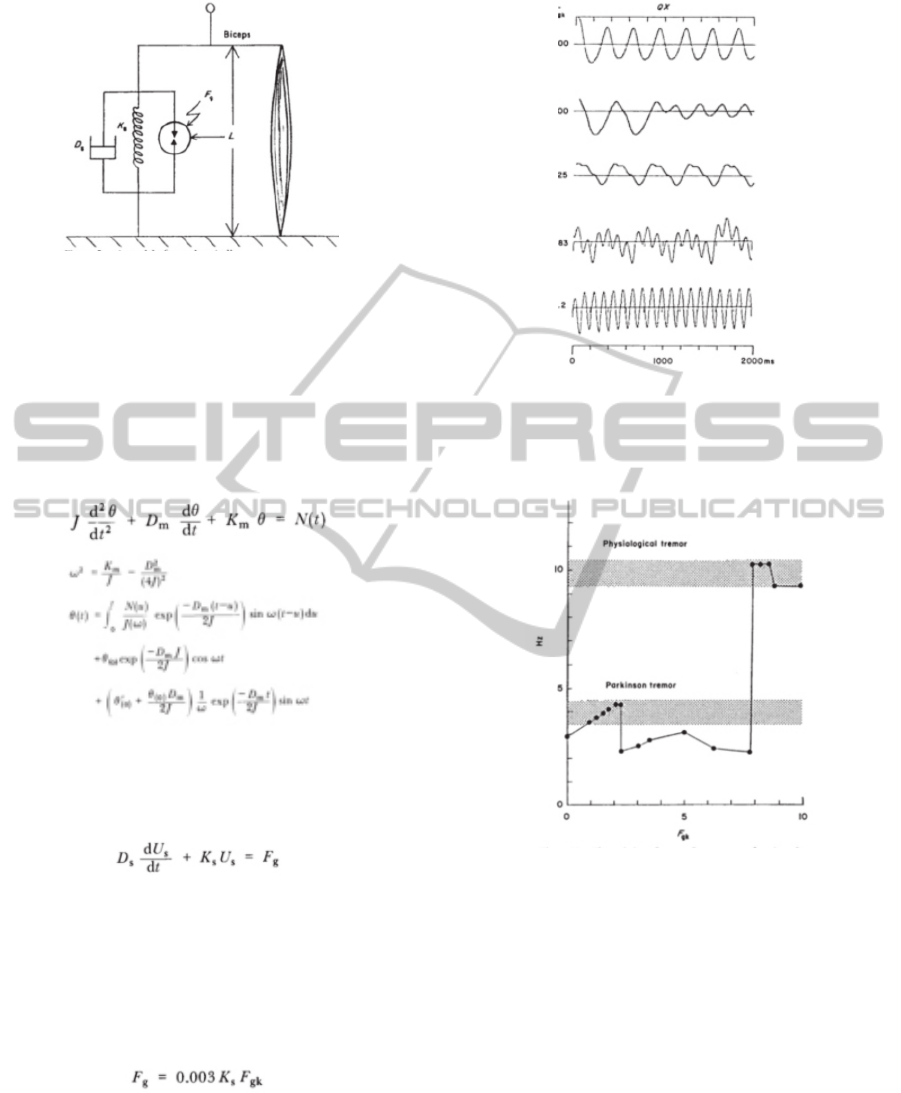
Figure 8: Intra muscle spindle model.
A mathematical formulation is described in
simple equations.
The rotation of the forearm due to the torque N(t)
is described by defining the inertia of the forearm J,
the elastic coefficient of the biceps Km, viscosity
coefficient Dm, the deviation of Q from the initial
angle Q
0
, θ, so that Q=Q
0
+ θgiving
Let the viscosity coefficient of the intrafusal
fiber be Ds and the mass of the intrafusal fiber be
negligible.
Using the elastic coefficient of the intrafusal
muscle fiber Ks, a non-dimensional effectively
coefficient appears including simulating effect by
gamma neuron F
gk,
the unit of which is the number
needed to stretch the intrafusal muscle fiber by half
its original length (c.a. 6mm).
F
gk
may
be thought to indicate the level of the
intrafusal muscle.
Computer simulation using the mathematical
model is executed by varying the F
gk
value (Fig.9).
Figure 9: A Simulation result varying F
gk.
Most remarkable result of the simulation may be
the sudden change of the main frequency by F
gk
(Fig.19).
Figure 10: Parkinson tremor suddenly changes to
Physiological tremor by F
gk
increasing.
The graph shows that the main frequency can
take only two state namely the Parkinson tremor
(4Hz) and Physiological tremor (8Hz) and it cannot
take the middle value. The fact corresponds well to
the clinical observation and our measured data.
Main frequency obtained from 50 Parkinson patients
are plotted against their The Hoehn and Yahr scale
(
□) (Fig.11).
Main frequencies calculated from corresponding
F
gk
value are also plotted in the graph (○). The two
plots vary simultaneously and the fact may support
the based hypothesis of peripheral feedback
oscillation.
ICINCO2014-11thInternationalConferenceonInformaticsinControl,AutomationandRobotics
166
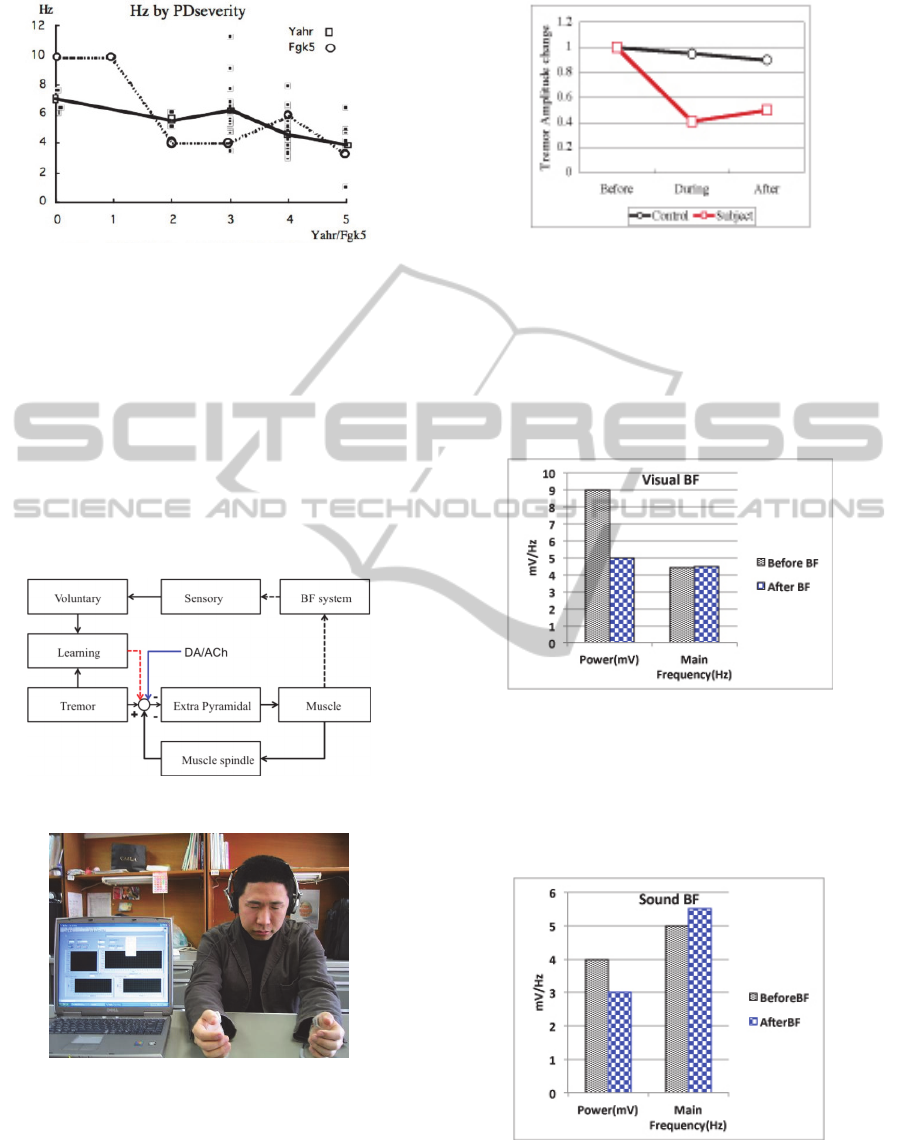
Figure 11: Yahr scale vs. Main frequency of Parkinson
patients.
4 BIOFEEDBACK TRINING
Medical treatment of Parkinson’s disease has several
shortcomings such as Wearing-Off or On-Off
phenomena as well as side effects of involuntary
movement. Biofeedback training is new non-
invasive treatment for psychological diseases. We
have applied the tremor measurement method to the
biofeedback training of Parkinson tremor.
Figure 12: Biofeedback system of Parkinson tremor.
Figure 13: Tremor biofeedback with accelerometer.
Biofeedback needs biological signal sensor and
feedback unit of the signal to patients. The feedback
signal is tremor curve in visual biofeedback and
modified pure sinusoidal tone in sound biofeedback.
The visual biofeedback is executed on three healthy
student (♀1♂2).
Figure 14: Visual biofeedback.
The subjects listen to the pure tone of which
loudness changes according to the tremor frequency
and they try to decrease the tone amplitude.
The tremor power (amplitude) decreases during and
after the biofeedback training (Fig.14). The main
frequency of tremor increases by the visual
biofeedback (Fig.15).
Figure 15: Tremor change by visual biofeedback.
Sound biofeedback uses pure sinusoidal tone
modified by tremor power as the feedback signal
instead of the tremor curve. The sound biofeedback
is executed on ten Parkinson patients ( ♂ 2 ♀ 8,
74.9±5.1years old).
Figure 16: Tremor change by sound biofeedback.
The training effect shows the decrease of tremor
power (p<0.05) and the increase of main frequency
(p<0.05) (Fig.16).
AStudyforAutomaticDiagnosingSystemofParkinsonDisease-ASystematicAnalysisofParkinsonianTremorby
Accelerometer
167
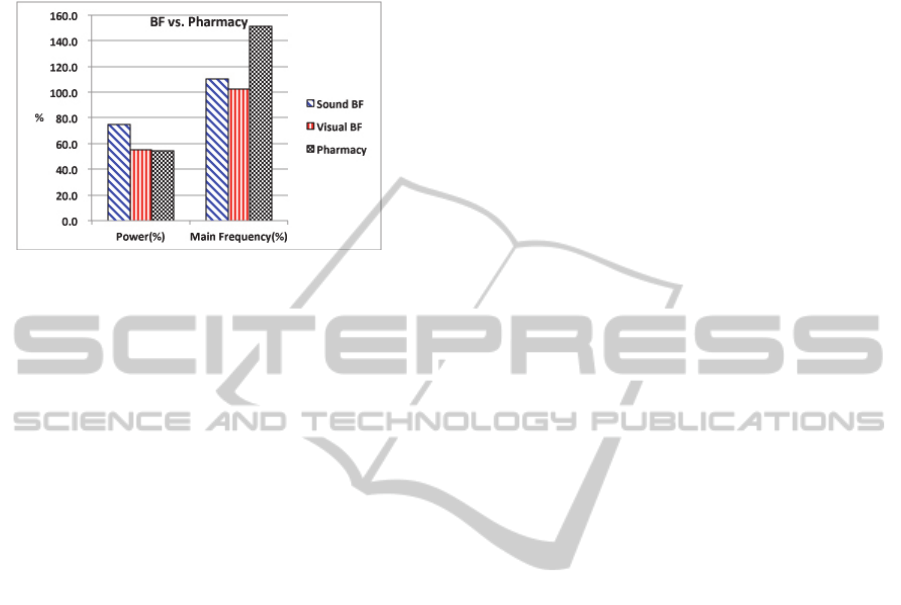
Both L-Dopa medical treatment and the two
biofeedback trainings show the same effect but the
medical is most effective (Fig.17).
Figure17: Comparison of three methods for the tremor
improvement.
5 CONCLUSIONS
Parkinson Disease can be measured and diagnosed
objectively with 3 D accelerometers. A
mathematical model based on the peripheral
feedback theory is tested by computer simulation
with good coincident with the clinical data. We
have found the main frequency of Parkinsonian
tremor is about 4Hz in arms. Using our method the
tremor improvement by biofeedback training is
objectively proved without any arbitral evaluation.
The result that the main frequency of tremor
increases and the tremor power decreases according
to the treatments corresponds well to clinical fact.
ACKNOWLEDGEMENTS
I would like to extend my sincere thanks to my
former students; Yoshinobu MATSUMOTO, Hisashi
UTIYAMA, Kiyoshi OKADA, Kenshi SUZUKI and
Takahiro YOSHII who have executed experiments
earnestly, as well as DR.Masato TAMURA &
Dr.Yasuhiro KAWASE who have assisted clinical
measurement in their hospitals
.
REFERENCES
Fukumoto, I., 1986. "Computer simulation of
Parkinsonian Tremor", J. Biomed. Eng., Vol.8, pp50-
55.
Fukumoto, I., 1994. "Computer simulations of human
tremors", Abstracts of the World Congress on Medical
Physics and Biomedical Engineering Part2 [653], Rio
de Janeiro, Brazil.8
Matsumoto, Y., Shindo, K., Sakakibara, M., Tamura, M.,
Fukumoto, I., 1996. "Study of the 8Hz Tremor
Frequency Related to Dopamine Level in Parkinsonian
Patients", IEEE.EMBS96, Final Program & Abstract
Book, Amsterdam, pp122
Utiyama, H., Fukumoto, I., 1999. “The basic studies of
biofeedback treatment systems for Parkinson's tremor,
dementia and visual accommodation disorders.
Proceedings of AAPB 13th Anniversary Annual
Meeting, P231, Vancouver
Okada, K., Hando, S., Teranishi, M., Matsumoto, Y.,
Fukumoto, I., 2001. “Analysis of pathological tremors
using the autoregression model", Frontiers
Med.Biol.Engng, Vol.11, No.3, pp221-235
Okada, K., Fukumoto, I., 2002. "A basic analysis of
pathological tremors using the autoregression model",
Proc. of Int. Cong. on Biological and Medical
Engineering, D3VA-1055, Singapore
Matsumoto, Y., Yoshii, T., Tamura, M., Fukumoto, I.,
2005. ”The change of diseased tumor acceleration
parameters under the photic feedback stimulation”,
Transactions of the Japanese Society for Medical and
Biological Engineering, Tsukuba, pp648, Apr25-27
Fukumoto, I., 2006. ”A Unified Model of the Alzheimer-
Dementia and Parkinsonian-Disease Based on the
Somatic Stimulation Effects”, WC2006 program book,
pp125-128, Seoul
Matsumoto, Y., 2009. Ichiro Fukumoto: ”Development of
pathological evaluating system of tremor disease by a
tablet PC and accelerometers”, EC2009, 07/09.14,
Munchen
ICINCO2014-11thInternationalConferenceonInformaticsinControl,AutomationandRobotics
168
