
Modeling and Simulation of Pyroprocessing Oxide Reduction
H. J. Lee, W. I. Ko, S. Y. Choi, S. K. Kim, H. S. Lee, H. S. Im,
J.M. Hur, E.Y. Choi, G. I. Park and I. T. Kim
Department of Nuclear Fuel Cycle System Development, Korea Atomic Energy Research Institute, 111,
Daekdaero 989beon-gil, Yuseong-gu, 305-353 Daejeon, Republic of Korea
Keywords: Pyroprocessing, Oxide Reduction, Dynamic Material Flow, Material Balance, Operation Model.
Abstract: Pyroprocessing operation modeling features complicated batch type operation, tangled material flow logic,
handling many numbers of unit processes. Discrete event system (DES) modeling was applied to build an
integrated operation model of which simulation showed that dynamic material flow was accomplished. In
the model simulation, the amount of material transported through upstream and downstream in a process
satisfied the mass balance equation for every batch operation. This study also analysed in detail an oxide
reduction process and showed that every stream’s material flow could be exactly tracked under DES
modeling environment.
1 INTRODUCTION
Material balance for a newly developed process is
mainly studied in a flowsheet (Piet et al., 2011).
However, this is nothing more than an accumulated
amount of material transported through in and out
streams during a specific period, in other words,
equilibrium material balance. Thus, dynamic
changes according to the batch operation cannot be
predicted in an equilibrium material flow. This study
began to build a dynamic material balance model
based on the previously developed pyroprocessing
flowsheet (Lee
a
et al., 2013). As a mid- and long-
term research, an integrated pyroprocessing
simulator (Lee
b
et al., 2013) is being developed at
the Korea Atomic Energy Research Institute
(KAERI) to cope with a review on the technical
feasibility, safeguards assessment, conceptual design
of facility, and economic feasibility evaluation. The
most fundamental thing in such a simulator
development is to establish the dynamic material
flow framework. Therefore, this study focused on
the operation modeling of pyroprocessing to
implement a dynamic material flow. As a case study,
oxide reduction was investigated in terms of a
dynamic material flow.
There are some recent interesting works similar
to this study, the US devoted to developing a spent
nuclear fuel (SNF) reprocessing plant level toolkit
named RPTk (Reprocessing Plant Toolkit)
(McCaskey et al., 2011). Japan developed an
analysis code (Okamura and Sato, 2002) for an
estimation of the material balance for the system
design of the pyrochemical reprocessing plants
consisting of batch processes. As a preliminary
study, Korea also developed DES based model to
implement simplified dynamic material flow for
pyroprocessing (Lee et al., 2011).
2 OXIDE REDUCTION
2.1 Pyroprocessing
As shown in Figure 1, pyroprocessing includes
many processes and complex recycling flows. It is
still developing technology, and is not matured. A
lot of effort has been placed into an investigation of
its principle. Since the current experimental study
focuses on unit process technology, not an integrated
process, it is difficult to predict the overall behavior
and mutual influence. However, modeling and
simulation can make it possible to see unforeseeable
results. Since pyroprocessing mostly consists of
dozens of batch-type processes, a discrete event
system is preferred to model this system if main
concerns are not the chemical reaction within one
batch operation.
Each box in Figure 1 indicates a grouped process
and the number of unit processes is actually more
than in Figure 1. The arrows represent a material
flow direction. Pyroprocessing produces not
685
Lee H., Ko W., Choi S., Kim S., Lee H., Im H., Hur J., Choi E., Park G. and Kim I..
Modeling and Simulation of Pyroprocessing Oxide Reduction.
DOI: 10.5220/0005009906850692
In Proceedings of the 4th International Conference on Simulation and Modeling Methodologies, Technologies and Applications (SIMULTECH-2014),
pages 685-692
ISBN: 978-989-758-038-3
Copyright
c
2014 SCITEPRESS (Science and Technology Publications, Lda.)
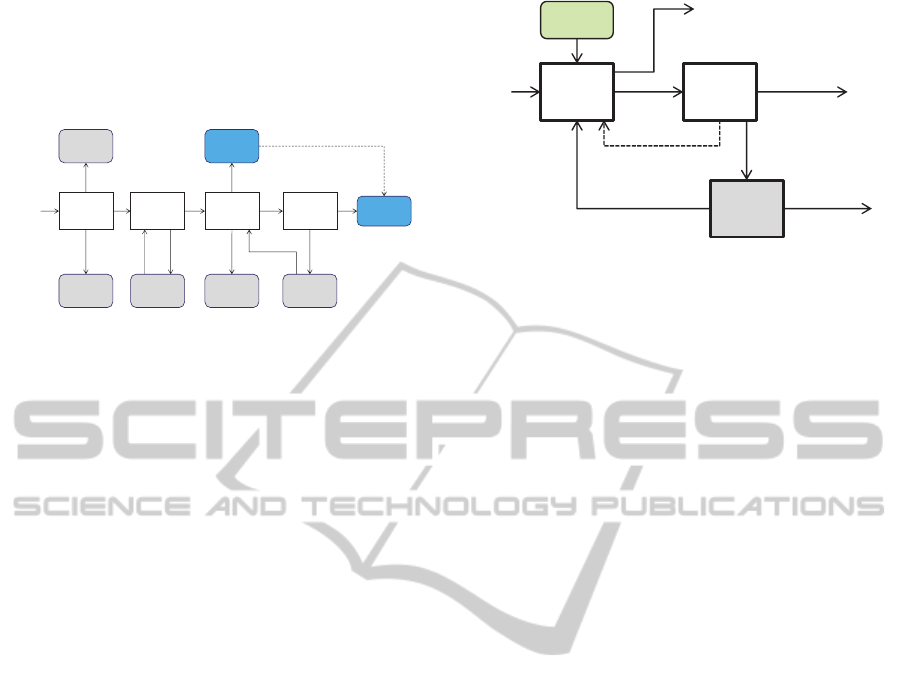
recyclable products from SNF but also wastes to be
disposed of. The final products of pyroprocessing
are a uranium (U) metal ingot and transuranic (TRU)
metal, and final wastes are the filter, metal, and
ceramic wastes.
Figure 1: Simplified pyroprocessing material flow diagram.
Pyroprocessing features complicated the batch
type operation, tangled material flow logic, and
numerous SNF elements to be tracked. Thus, the
material balance must be calculated whenever events
such as feed arrival and product departure occur.
Otherwise, a dynamic material flow cannot be
tracked. The basic understanding of the whole
process is well fulfilled by a flowsheet study, which
represents an equilibrium material balance at a
specific time.
2.2 Oxide Reduction
The oxide reduction process receives oxide SNF
feed material of porous pellet or fragment generated
from the headend process. The oxide SNF is
converted into metallic form in a LiCl molten salt
bath. During the electrolytic reduction process, the
oxide powder is reduced into a metal form, which
normally contains most of the transition elements,
all of the actinides and a certain fraction of rare earth
elements. The reduced metal is sent to cathode
processing to distill residual salt entrained in
reduced metal deposit and then transferred to the
next process, electro-refining. The remaining LiCl
salt in an electrolytic reduction bath after several
process operations contains most of the fission
products with a high heat load, such as Cs, Sr and Ba,
which are separated from the metallic powder. The
LiCl salt is sent to a LiCl salt purification process to
recycle it by separating LiCl residue concentrated
with Cs, Sr, and Ba from pure LiCl. Figure 2
illustrates three unit process and product streams
regarding oxide reduction.
Figure 2: Material flow diagram for oxide reduction.
3 MODELING
3.1 Operation Procedure
The pyroprocessing flowsheet study represents
equilibrium mass balance, i.e., accumulated amount
of material transported through in and out streams
during a specific period (one year is mostly used). It
does not provide detailed information regarding the
batch operation. Thus, the batch operation procedure
was investigated based on the process currently
under development. The electrolytic reduction (P2-1)
has 50kgHM/batch and 400kg-salt/batch. It receives
recovered salts after distillation in cathode
processing (P2-2) every other batch operation during
the 1
st
campaign (1
st
through 40
th
batch operations).
Since P2-1 at the 1
st
batch operation cannot receive
recovered salt from P2-2, the 3
rd
, 5
th
, … , 39
th
batch
operations are reasonably practicable to receive the
recovered salts. Process P2-1 does not receive any
salt from P2-2 during the 2
nd
campaign (41
st
through
80
th
batch operation) but receives fresh salt as much
as insufficient amount. It receives regenerated salts
for every other batch operation from the LiCl
purification process (W4-1) since the 3
rd
campaign,
i.e., the 81
st
batch operation. If the regenerated salt is
not enough to facilitate the process of P2-1, fresh
salt can be added. As the number of P2-1’s
campaign changes, the direction of material flow
changes in process P2-2, the recovered salts is
transferred to P2-1 during the 1
st
campaign but to
W4-1 since the 2
nd
campaign.
The above operation procedure is changed
according to the batch operation number.
Consequently, the amount of generated work in
process (WIP) and its direction of flow are affected
by the operation procedure. Such transient behavior
must be well described in a model in terms of the
inventory management, nuclear material
P1
Head‐end
P2
Oxide
Reduction
P3
Electro‐
Refining
P4
Electro‐
Winning
LiCl‐KCl
salt‐waste
treatment
Hullwaste
treatment
Offgas
treatment
LiCl salt
waste
treatment
Anode
sludge
treatment
Uingot
TRU+RE+U
SpentNuclear
Fuel(SNF)
P2‐1
Electrolytic
Reduction
P2‐2
Cathode
Processing
W4‐1
LiCl
Purification
FreshSalt
(LiCl,Li
2
O)
Reduced
metal
withsalt
RecoveredSalt
(1
st
campaign)
RegeneratedSalt
(from3
rd
campaign)
Reducedmetal
Pellet,
fragment
ConcentratedSalt
Offgas (O
2
)
SIMULTECH2014-4thInternationalConferenceonSimulationandModelingMethodologies,Technologiesand
Applications
686

accountancy, and productivity of the integrated
process.
3.2 Material Balance
Dynamic material balance describes the amount of
feed, hold-up, and product in any process for every
batch operation. If accumulating the amounts of
received and departed material for a specific period,
an exact equilibrium material balance can be
obtained. Because the above operation procedure is
difficult to implement, an equilibrium material
balance tends to simplify the complicated operation
to the averaged one, i.e., every batch operation is
assumed to be the same. However, if we can build
an exact model through appropriate tools or
methodologies to reflect such tangled operation
requirement, the assumed equilibrium material
balance obtained from a flowsheet study can be
replaced with an exact material balance in an exact
model.
For comparison between equilibrium and
dynamic material balance, it is assumed that the
oxide reduction treats 10tHM per year, which
corresponds to 200 batch operations of process P2-1.
An equilibrium mass balance in process P2-1 is
shown in Table 1.
Table 1: Equilibrium material balance in P2-1.
Material via
stream
type SNF
mass(kg)
Salt
(LiCl, Li
2
O)
new salt feed - 824
pellet/fragment feed 11,331 -
recovered salt feed 5 350
regenerated salt feed 6 1,146
Sum of inputs 11,341 2,320
cathode product product 9,997 1,935
O
2
product 1,331 -
Sum of outputs 11,328 1,935
remaining salt hold-up 13 385
Sum of hold-up 13 385
Since the equilibrium material balance shows
accumulated results over numerous batch operations,
the difference of each batch is ignored. Process P2-1
has a total of 4 inputs and 2 outputs. The sums of the
inputs and outputs are not the same because process
P2-1 can hold a small amount of SNF in its bath.
Therefore, the sum of inputs exactly matches the
sum of outputs and hold-up. We cannot predict from
equilibrium material balance any transient behavior
affected by operation procedure described in section
3.1. Tables 2 and 3 show dynamic SNF and salt
balances, respectively, obtained from a discrete
event system (DES) model of oxide reduction. It
shows different results from every batch operation:
amount of inputs, outputs, and hold-up in process
P2-1 for every batch operation. In Table 2, every
batch operation of P2-1 receives 50kgHM/batch
fragment or pellet from the previous process
excluding O
2
weight. The 2
nd
column in Table 2
represents the minimum weight of oxide form of a
fragment or pellet. Excluding oxide, only the SNF
element weight becomes 50kgHM/batch. The weight
of oxide form can be more than the sum of 50kg and
O
2 weight measured at the output stream because
reduction yield ratios are not 100% about all SNF
oxide elements. The reduction yield ratio is one of
the parameters that significantly influence the
material balance at the out stream.
Table 2: SNF material balance in P2-1.
batch #
inputs hold-up outputs
fragment/
pellet(kg)
recovered
salt(kg)
r
egenerate
d
salt(kg)
remaining
salt(kg)
cathode
product
(kg)
O2(kg)
1 56.67 - - 0.28 49.72 6.67
2 56.67 - - 0.5
4
49.73 6.67
3 56.59 0.02 - 0.83 49.74 6.59
4 56.67 - - 1.08 49.75 6.67
5 56.59 - - 1.33 49.75 6.59
6 56.67 - - 1.57 49.76 6.67
7 56.59 0.05 - 1.85 49.77 6.59
8 56.67 - - 2.08 49.77 6.67
9 56.59 0.08 - 2.38 49.78 6.59
…………………
41 56.59 - - 10.25 49.97 6.59
42 56.67 - - 10.27 49.98 6.67
43 56.59 - - 10.3
0
49.97 6.59
44 56.67 - - 10.32 49.98 6.67
45 56.59 - - 10.35 49.97 6.59
46 56.67 - - 10.37 49.98 6.67
47 56.59 - - 10.4
0
49.97 6.59
…………………
81 56.59 - 0.08 11.03 49.99 6.59
82 56.67 - - 11.0
4
50.00 6.67
83 56.59 - 0.08 11.13 49.99 6.59
84 56.67 - - 11.13 50.00 6.67
85 56.59 - 0.08 11.21 49.99 6.59
86 56.67 - - 11.22 50.00 6.67
87 56.67 - 0.08 11.3
0
49.99 6.67
…………………
194 56.67 - - 13.3
0
50.05 6.67
195 56.67 - 0.11 13.37 50.04 6.67
196 56.67 - - 13.32 50.05 6.67
197 56.67 - 0.12 13.39 50.04 6.67
198 56.67 - - 13.3
4
50.05 6.67
199 56.67 - 0.12 13.41 50.04 6.67
200 56.67 - - 13.36 50.05 6.67
tota
l
11,331.06 4.55 5.66 13.36 9,996.85 1,331.06
For example, actinide elements are almost
reduced to metal form such that 99.5% of those
oxides convert into metal form but lanthanide
elements are rarely reduced such that only 30% of
those oxides convert into metal form. Generally, the
overall reaction for oxide reduction of an arbitrary
ModelingandSimulationofPyroprocessingOxideReduction
687

metal oxide can be described as follows
(Phongikarron et al., 2011):
M
x
O
y
→ xM +
O
2
(g)
(1)
In the case of actinide, 99.5% of M
x
O
y
converts
into metal by electrolytic reduction but 0.5% of
M
x
O
y
still keeps its original form. Some elements (Se,
Rb, Cs, Sr, Ba, Eu, and Te) are dissolved and
transferred to a salt bath to become chloride forms.
Therefore, cathode product contains three types of
product forms: metal, oxide, and chloride form. The
chloride form is entrained in a cathode product along
with LiCl salt when the cathode product is
transferred to cathode processing P2-2. The 4
th
column represents only the element weight of
chloride form in salt. The 5
th
column in Table 2
represents the sum of the three types. The 3
rd
and 4
th
column indicate only element weights of chloride
forms contained in salt.
Table 3: Salt material balance in P2-1.
batch
#
inputs hold-up outputs
Fresh
salt(kg)
recovered
salt(kg)
regenerate
d salt(kg)
remaining
salt(kg)
cathode
product(kg)
O2(kg)
1 404.00 - - 394.06 9.94 -
2 - - - 384.13 9.93 -
3 - 19.67 - 393.88 9.92 -
4 - - - 383.96 9.92 -
5 - - - 374.06 9.91 -
6 - - - 364.15 9.90 -
7 - 19.64 - 373.90 9.89 -
8 - - - 364.01 9.89 -
9 - 19.61 - 373.74 9.88 -
… … … … … … …
41 42.26 - - 394.31 9.69 -
42 - - - 384.62 9.68 -
43 19.38 - - 394.31 9.69 -
44 - - - 384.63 9.68 -
45 19.37 - - 394.31 9.69 -
46 - - - 384.63 9.68 -
47 19.37 - - 394.31 9.69 -
… … … … … … …
81 0.17 - 19.17 394.33 9.67 -
82 - - - 384.66 9.67 -
83 0.17 - 19.17 394.33 9.67 -
84 - - - 384.67 9.66 -
85 0.17 - 19.16 394.33 9.67 -
86 - - - 384.67 9.66 -
87 0.17 - 19.16 394.33 9.67 -
… … … … … … …
194 - - - 384.77 9.61 -
195 0.17 - 19.06 394.38 9.62 -
196 - - - 384.77 9.61 -
197 0.17 - 19.06 394.38 9.62 -
198 - - - 384.77 9.61 -
199 0.17 - 19.06 394.38 9.62 -
200 - - - 384.77 9.61 -
total 824.24 349.83 1,146.07 384.77 1,935.37 -
Every unit process model must satisfy dynamic
material balance equation for every batch operation.
,
,
(2)
where is the number of inputs; the number of
outputs; the current number of batch operation;
,
the k-th input amount of mass transported through
the i-th upstream,
,
the k-th output amount of
mass transported through the i-th downstream;
hold-up until k-th batch.
When the equilibrium material balance equation
is considered instead of dynamic mass balance
equation, the equation (2) can be modified into:
,
,
(3)
where
,
is the k-th accumulated input amount of
mass transported through the i-th upstream so far;
,
the k-th accumulated output amount of mass
transported through the i-th downstream so far.
3.3 Operation Model
3.3.1 DES Modeling
The material flow of oxide reduction as shown in
Figure 2 was modeled as shown in Figure 3 by using
multi-purpose system modeling software,
ExtendSim. Process P2-1 has four input connectors
to receive pellet/fragment, fresh salt (LiCl and Li
2
O),
recovered salt, and regenerated salt, and it also has
three output connectors to transfer cathode product
and O
2
to the next processes such as P2-2 and W3-1,
as shown in Figure 3.
Figure 3: Operation model of oxide reduction.
Each box in Figure 3 is a hierarchical block,
which contains many blocks and complicated flows
P2‐2
Cathode
Processing
P2‐1
Electrolytic
Reduction
W3‐1
OffgasO
W4‐1
LiCl
Purification
LiCl/Li2O
addition
SIMULTECH2014-4thInternationalConferenceonSimulationandModelingMethodologies,Technologiesand
Applications
688
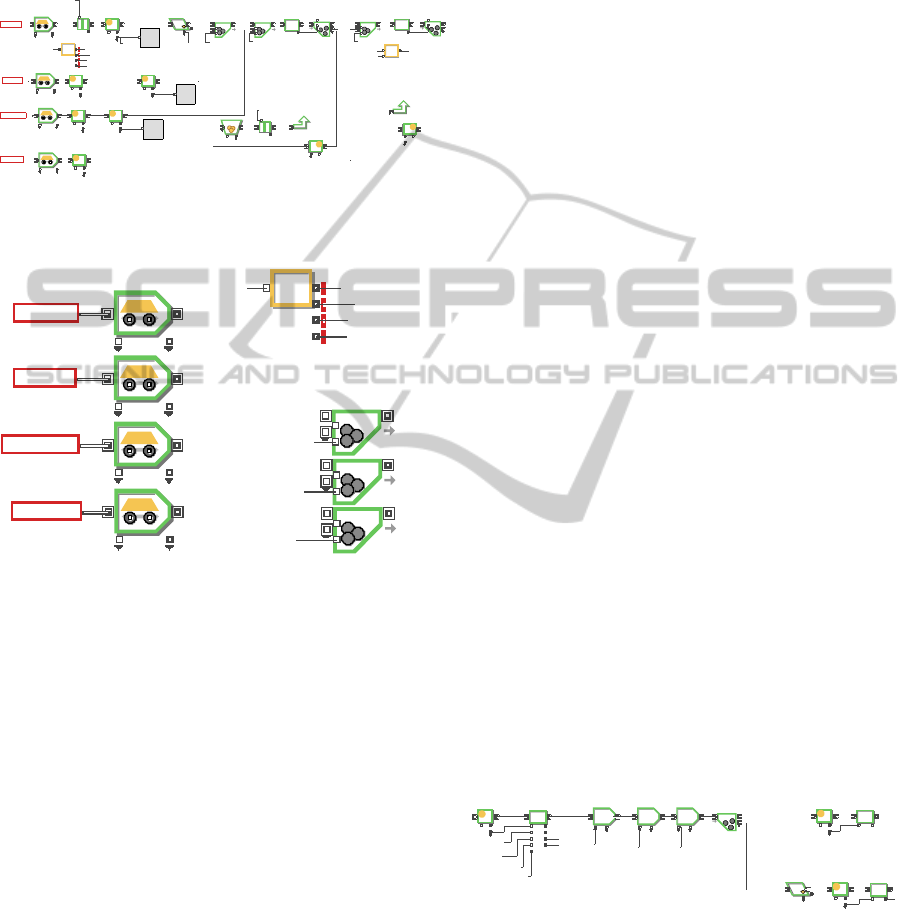
to implement functions inherent to the process: feed
material receipt, hold-up calculation, product
material calculation, and so on. If any box is double-
clicked in the model, detailed models as shown in
Figures 4 and 6 pop up.
Figure 4: A selected part in P2-1 for receipt of feed
materials.
Figure 5: Selected blocks needed for operation logic in
Figure 4.
Figure 4 shows the first part of P2-1 representing
the receipt of feed materials. An item flow in the
DES model is controlled by transport blocks,
equation blocks and batch blocks, as shown in
Figure 5. Transport blocks move items from the start
of a path to the end based on distance and speed
information, so they are used here for simulating
feed material’s movements that consume time. An
oxide reduction model begins with transport blocks
that describe the receipt of four types of feed
materials (fragment/pellet, recovered salt,
regenerated salt, and fresh salts). The feed of
fragment/pellet (ORFeedIn in Figure 5(a)) is always
needed for every batch operation. However, the
recovered salt (RecSaltIn in Figure 5(a)), and
regenerated and fresh salts (RegenSaltIn and
freshSaltIn in Figure 5(a)), can be received or not
according to the batch operation procedure. The
complicated operation logic of section 3.1 was
perfectly built in equation block in Figure 5. Input
value connector (InCnt) in Figure 5(b) indicates the
number of receipt of fragment/pellet (ORFeedIn)
item. In other words, it indicates the number of batch
operation of P2-1 because fragment/pellet
(ORFeedIn) is always needed for every batch
operation. The equation block judges if RecSaltIn,
RegenSaltIn, and freshSaltIn feeds need to be
received for current batch, and sends out 1 or 0
output signals through its output value variables
(addRecycleedLiCl, addRegenLiCl, and
addNewLiCl) to the batch blocks’ second input
value connectors in Figure5(c) to determine the
corresponding feed is added to fragment/pellet feed.
The materials generated in process P2-1 are
remaining salt in bath as a hold-up, and cathode
product and O
2
as products. The total amount and
elemental composition for the three types of material
are calculated in the later part of Figure 4, as shown
in Figure 6. Figure 7 shows some important blocks
to calculate the amounts of hold-up and products,
and to describe the operation time. The equation
blocks in Figure 7(a) calculates hold-up, i.e., the
remaining salt and fission products (FPs) dissolved
from fragment/pellet feed in the salt before electro-
chemical reaction occurs. In Figure 6, the equation
block is located right before three activity blocks
representing pre-process, main process, and post-
process of the electro-chemical reaction. Three
sequential activity blocks in Figure 7(b) merely play
a role of consuming the corresponding process time.
Actually, the electro-chemical reaction should be
simulated with a continuous system modeling
methodology if the main concerns are the changes
according to time by electro-chemical reaction
within a batch operation. However, this model
calculates only the final result after the electro-
chemical reaction because our main concern is how
consecutive batch operations affect the material
balance throughout the whole process.
Figure 6: A selected part in P2-1 for calculation of mass
compositions of hold-up and products (cathode product
and O
2
).
ORFeedInORFeedIn
RecSaltInRecSaltIn
D U
InCNT
y=f(x)
D U
i
r L
#
y=f(x)
{...}
1
2
demand
AD
addRegenLiCl
RegenSaltInRegenSaltIn
1
D U
i
r L
#
1
2
addRegenLiCl
addRegenLiCl
i
rL
addNew Li2O
addNewLiCl
addRecy cledL iCl
addRecy cledL iCl
VesselRegLiCl
FeedFormOR
TR U
BB RegLiCl
Stats
Calc ulate
P1-3-O Rf eed
Stat s
Calculate
P2-2-t oORRecLiC l
i
r L
#
Stat s
Calculate
W4-1-R egenSalt
i
r L
#
fresh SaltInfresh SaltIn
1
D U
i
r L
#
G_Open
demand
AD
i
r L
#
1
2
addNewLiCl
addNewLi2O
y=f(x)
addNewSalt
y=f(x)
InCNT
i
rL
#
LiClLi2Ob asket
addNewSalt
ORFeedInORFeedIn
D U
RecSaltInRecSaltIn
D U
RegenSaltInRegenSaltIn
1
D U
freshSaltInfreshSaltIn
1
D U
InCNT
y=f(x)
addRegenLiCl
addNewLi2O
addNewLiCl
addRecycledLiCl
1
2
addRecycledLiCl
1
2
addRegenLiCl
1
2
addNewSalt
(a)feedreceipt
(b)equation
(c)batchblocks
D F
preproces s
D F
process
D F
post proces s
{...}
O2
Cathod eDeposit
i
r L
#
i
r L
#
addRegenLiCl
addNewLi2O
addRecycle dLiCl
addNewLiCl
ReqLiCl
ReqLi2O
y=f(x)
FBChWeight
y=f(x)
i
r L
#
y=f(x)
remaining s alt R cdN um=2
Pretime
Posttim eProctime
ModelingandSimulationofPyroprocessingOxideReduction
689
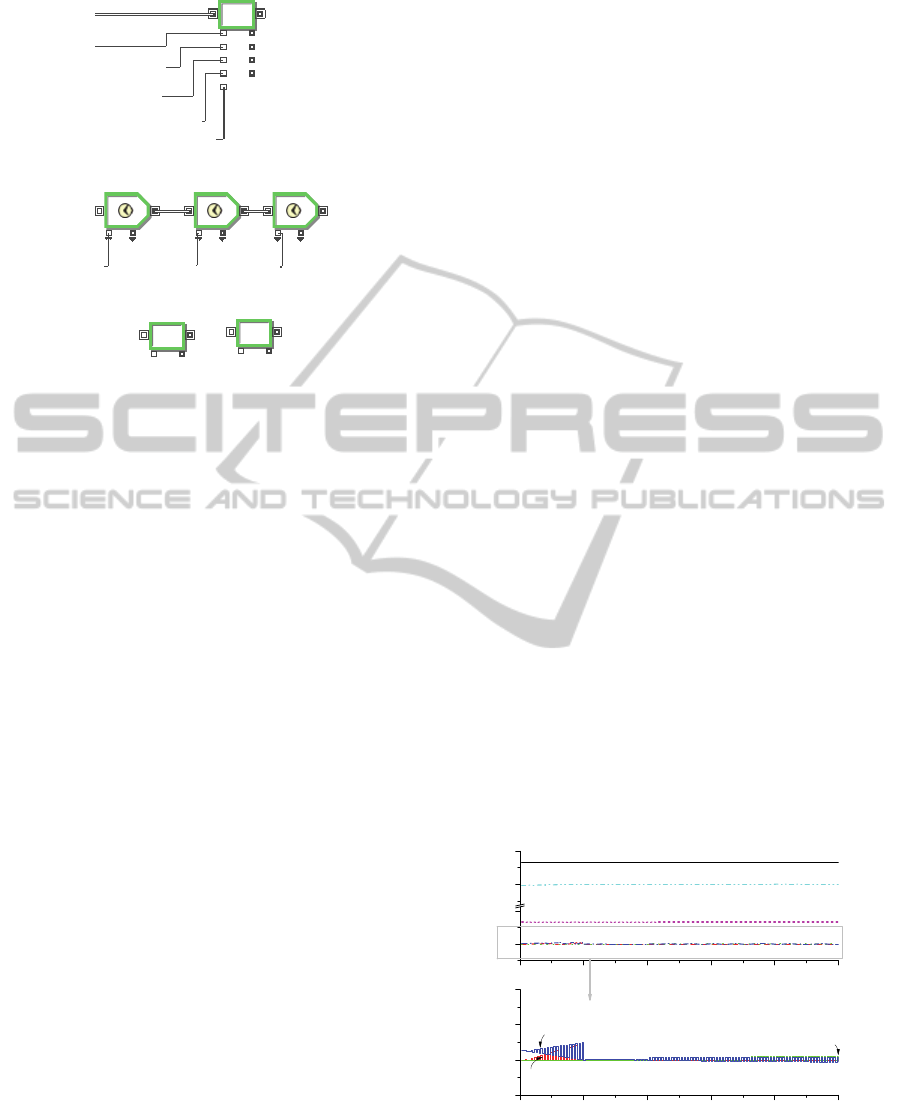
Figure 7: Blocks for calculation of hold-up and product
compositions, and process operation delay.
Two equation blocks in Figure 7(c) calculates the
mass composition of cathode product and O
2
. These
blocks are located in downstream right after three
activity blocks representing the electro-chemical
reaction. Every calculation results are written in
internal database of ExtendSim by equation blocks
in Figure 7(a) and 7(c), so that a further detailed
analysis can be performed after simulation by an
investigation of the recorded data during simulation.
4 SIMULATION
4.1 Default Scenario
The basic input parameters resulted in Table 2 and 3
are as follows: The capacities of process P2-1, P2-2
and W4-1 are 20 kgHM/batch, 100 kgHM/batch and
50 kgHM/batch, respectively, and operation times
taken by the processes are 20 day/batch, 44 h/batch,
and 165 hours/batch, respectively. One piece of
equipment is deployed for each process. Chemically,
20% salt over the weight of the cathode product is
carried to the next process P2-2. Actinide oxide and
noble metal oxide has a 99.5% reduction yield ratio,
but a rare earth oxide has a 30% reduction yield ratio.
The process P2-2 recovers 99.9% salt by distillation
and 0.1% salt transfers to the next process. This is
the default scenario to run the simulation. To reflect
the experimental results in the future or to analyze
various alternative operations, these parameters can
be changed.
4.2 Experimental Results
Simulation is performed based on the above default
scenario for 200 batch operations of process P2-1.
The 200 batch operations end within 250 days.
Figures 8 and 9, and Figures 10 and 11 show process
P2-1’s material balance for the SNF element, and
salt (LiCl+Li
2
O), respectively. Figures 8 and 10
show the material balance to indicate the amount of
material that is received from the input and sent to
output each batch. On the other hand, Figures 9 and
11 show the material balance for the amount
accumulated from the first batch. The amounts at the
end batch operation in Figures 9 and 10 mean the
equilibrium mass balance. In Figure 8, the
fragment/pellet includes 50kgHM plus oxide weight.
Therefore, after the process, the cathode product
losses as much weight as the oxygen generated
during the reduction. The top figure of Figure
indicates sum of inputs (fragment/pellet, recovered
salt and regenerated salt) are equal to sum of outputs
(cathode product and O
2
) and hold-up addition for
every batch operation. The bottom figure of Figure 8
is magnified to properly investigate small amounts
such as FPs contained in the hold-up, recovered salt,
and regenerated salt.
In the first batch operation, SNF addition in
hold-up (i.e., remaining salt) occurs owing to
dissolution of some of PFs of fragment/pellet feed.
Its contribution approximately amounts to 0.28kg
per batch operation by first row in Table 2. Without
any other contribution to SNF addition in hold-up,
the amount of 0.28kg is the same over the batch
operation. However, the SNF addition in remaining
salt until 40th batch operations fluctuates more or
less severely.
Figure 8: Material (a total SNF elements) balance every
batch in P2-1.
0
D F
preprocess
0
D F
process
0
D F
postprocess
Pretime
Posttime
Proctime
y=f(x)
O2
y=f(x)
Cathode product
addRegenLiCl
addNewLi2O
addRecycledLiCl
addNewLiCl
y=f(x)
AddedLiCl
AddedLi2O
ReqLiCl
ReqLi2O
(c)product
(a)saltaddition
(b)reaction
0 40 80 120 160 200
0
10
50
60
recoveredsalt,
O
2
hold‐upadditon
regeneratedsalt
cathodeproduct
SNFtotal(kg)
fragment/pellet
0 40 80 120 160 200
‐1
0
1
2
hold‐upadditon
SNFtotal(kg)
batch#
recoveredsalt
regeneratedsalt
SIMULTECH2014-4thInternationalConferenceonSimulationandModelingMethodologies,Technologiesand
Applications
690

Figure 9: Accumulated material (a total of SNF elements)
balance in P2-1.
When the hold-up addition is more than 0.28kg
is when recovered salt is recycled. In such batch
operation, PFs (which plays + contribution)
accompanied with the recovered salt is more than
PFs (which plays - contribution) accompanied with
the entrained salt with cathode product. On the other
hand, when the hold-up addition is less than 0.28kg
is when the recovered salt is not recycled. In such
batch operation, PFs accompanied with the entrained
salt with cathode product goes out of the remaining
salt. From the 2
nd
to the 40
th
operation, hold-up
addition is fluctuated according to whether
recovered salt is added or not. Since the recovered
salt is the salt recovered from the salt entrained in
cathode product, it contains the same FPs
concentrations as the remaining salt in salt batch of
P2-1. Hold-up addition increases every other batch
since the recovered salt is added every other batch
by operational procedure in section 3.1. During 2
nd
campaign (41~80 batch operations), neither
recovered salt with high concentration of FPs nor
regenerated salt with very low concentration of FPs
is received. Only fresh salt without FPs is added to
supplement a shortage of LiCl. It does not cause any
abrupt change of hold-up addition compared to the
1
st
campaign. Approximately, 0.03kg of SNF is
added in remaining salt for every batch operation
during 2
nd
campaign.
Compared to Figure 8, the Figure 9 represents
the accumulated in- and out-mass of P2-1. If the
Figure 8 is simply integrated over batch operation
number, it becomes Figure 9. In the bottom figure of
Figure 9, FPs increase in remaining salt (see the line
marked ‘hold-up acc.’ of the bottom of Figure 9)
because recycled salts containing high concentration
of FPs are constantly re-used without purification. In
steep increase during 1
st
campaign, supplementary
fresh salt addition during 2
nd
campaign does not
bring about a significant increase in remaining salt.
The gradual increase in remaining salt during 2
nd
campaign is only due to fragment/pellet’s
dissolution. Since 3
rd
campaign, the accumulation of
SNF in remaining salt increases gradually but more
steeply than 2
nd
campaign due to contribution of
both the dissolution of some FPs of fragment/pellet
and the regenerated salt addition with very low
concentration of FPs. The SNF input accumulation
by the recovered salt addition exponentially
increases during 1
st
campaign, however, the
accumulation stops increasing since 2
nd
campaign.
Figure 10 shows not the SNF material balance
but the salt material balance such that the sum of
fresh salt, recovered salt, and regenerated salt
exactly match the sum of salt entrained with the
cathode product and hold-up increment for every
batch operation. Fresh salt addition occurs during
only the 2
nd
campaign and the 1
st
batch of 2
nd
campaign needs more fresh salt than the others to
supply the accumulation of 0.1% loss amount during
the 1
st
campaign because cathode processing
recovers only 99.9% salt. An insufficient amount of
salt during the 1
st
campaign is supplemented through
a recycling of recovered salt but is through the
recycling of regenerated salt during the 3
rd
campaign.
Figure 11 shows an accumulation of batch mass
balance. The hold-up in Figure 11 indicates the
amount of remaining salt in bath right after transfer
of the cathode product, i.e., accumulation of hold-up.
Since the 3
rd
campaign, the remaining salt
approximately retains 400kg. The amount of salt
carried with the cathode product gradually decreases
because the FPs in proportion to the entrained salt
increases.
Figure 10: Material (salt: LiCl and Li
2
O) balance every
batch in P2-1.
0 40 80 120 160 200
0
2,500
5,000
7,500
10,000
12,500
O
2
hold‐up,recoveredsalt,regeneratedsalt
cathodeproduct
SNFtotal(kg)
fragment/pellet
0 40 80 120 160 200
0
2
4
6
8
10
12
14
hold‐upacc.
SNFtotal(kg)
batch#
recoveredsalt
regeneratedsalt
0 40 80 120 160 200
‐25
0
25
50
350
400
batch#
0 40 80 120 160 200
0
5
10
15
20
regeneratedsalt
recoveredsalt(kg)
batch#
recoveredsalt
0 40 80 120 160 200
0
50
350
400
freshsaltaddition(kg)
hold‐upaddtion(kg)
batch#
0 40 80 120 160 200
9.6
9.7
9.8
9.9
10.0
cathodeproduct(kg)
batch#
ModelingandSimulationofPyroprocessingOxideReduction
691

Figure 11: Accumulated material (salt: LiCl and Li
2
O)
balance in P2-1.
Validation of dynamic material flow was
performed in every level of details for guaranteeing
completeness of the model. Especially, dynamic
mass balance using equation (2) was carefully
checked for every batch operation and showed that
SNF and salt mass balance is always satisfied.
5 CONCLUSIONS
DES based modeling was applied to build a
pyroprocessing operation model, specifically, oxide
reduction model. A dynamic material flow as the
basic framework for an integrated pyroprocessing
was successfully implemented through ExtendSim’s
internal database and item blocks. Complex
operation logic behavior was verified, for example,
an oxide reduction process in terms of dynamic
material flow. Compared to the equilibrium material
flow, a model-based dynamic material flow provides
such detailed information that a careful analysis of
every batch is necessary to confirm the dynamic
material balance results. With the default scenario of
oxide reduction, dynamic material balance was
verified for every batch operation.
This study is a meaningful step to confirm a part
of an integrated pyroprocessing simulator in terms of
dynamic material flow and its implementation under
DES environment. The development of a multi-
purpose integrated pyroprocessing simulator is still
under progress with a mid-and long-term goal to
cope with safeguards assessment, economic
feasibility, technical evaluation, conceptual design,
and support of licensing for a future pyroprocessing
facility.
ACKNOWLEDGEMENTS
This work was supported by Nuclear Research and
Development Program of National Research
Foundation of Korea (NRF) funded by Ministry of
Science, ICT and Future Planning (MSIP).
REFERENCES
Piet, S. J., Soelberg, N. R., Pincock, L. F., Shaber, E. L.,
and Teske, G. M., 2011. The FIT 2.0 Model-Fuel
Cycle Integration and Tradeoffs, INL/EXT-10-20190
Rev.1.
Lee
a
, H. J. et al., 2013. Development of pyroprocessing
baseline flowsheet v4.0, Proceedings of the Korean
Radioactive Waste Society, May 9-10, 2013, Korea.
Lee
b
, H. J., Ko, W. I., Kim, I. T., and Lee, H. S., 2013.
Design for integrated pyroprocessing plant level
simulator, Annals of Nuclear Energy, 60, 316-328.
McCaskey, A., et al., 2011. The nuclear energy advanced
modeling and simulation safeguards and separations
reprocessing plant toolkit, ORNL/TM-2011/261.
Okamura, N., Sato, K., 2002. Computer code system for
the R&D of nuclear fuel cycle with fast reactor. IV.
Development of an object-oriented analysis code for
estimation of the material balance in the pyrochemical
reprocessing process, Cycle system technical report 3,
1–10.
Lee, H.J. et al., 2011. Discrete event dynamic system
(DES)-based modeling for dynamic material flow in
the pyroprocess. Annals of Nuclear Energy, 38, 860–
875.
Phongikarron, S., Herrmann, S., Simpson, M., 2011.
Diffusion model for electrolytic reduction of uranium
oxides in a molten LiCl-Li2O slat, Nuclear
Technology, 174, 85-93.
ExtendSim Simulation Software. Imagine That Inc, 2014.
Web. 24 Jun 2014. <http://www.extendsim.com>
0 40 80 120 160 200
400
500
600
700
800
900
1000
batch#
0 40 80 120 160 200
0
200
400
600
800
1,000
1,200
regeneratedsalt
recoveredsalt(kg)
batch#
recoveredsalt
0 40 80 120 160 200
300
350
400
450
freshsaltacc.(kg)
hold‐upacc.(kg)
batch#
0 40 80 120 160 200
0
500
1,000
1,500
2,000
cathodeproduct(kg)
batch#
SIMULTECH2014-4thInternationalConferenceonSimulationandModelingMethodologies,Technologiesand
Applications
692
