
Decision Trees and Data Preprocessing to Help Clustering Interpretation
Olivier Parisot, Mohammad Ghoniem and Beno
ˆ
ıt Otjacques
Public Research Centre Gabriel Lippmann, Belvaux, Luxembourg
Keywords:
Clustering Interpretation, Decision Trees, Data Preprocessing, Evolutionary Algorithms.
Abstract:
Clustering is a popular technique for data mining, knowledge discovery and visual analytics. Unfortunately,
cluster assignments can be difficult to interpret by a human analyst. This difficulty has often been overcome
by using decision trees to explain cluster assignments. The success of this approach is however subject to
the legibility of the obtained decision trees. In this work, we propose an evolutionary algorithm to cleverly
preprocess the data before clustering in order to obtain clusters that are simpler to interpret with decision trees.
A prototype has been implemented and tested to show the benefits of the approach.
1 INTRODUCTION
Clustering is a data mining technique designed to
split data into homogeneous groups, so that simi-
lar elements are assigned to the same cluster while
dissimilar elements are assigned to separate clus-
ters. There are various families of clustering algo-
rithms (hierarchical/partitional, fuzzy/hard, distance-
based/density-based, etc.). In this paper, the term
clustering refers also to the cluster assignment result-
ing from applying a clustering algorithm on a dataset.
Many approaches have been proposed to evalu-
ate clustering quality (Gan et al., 2007). Nonetheless,
once a clustering is computed from data, its interpre-
tation is a critical and non-trivial task for the end-
user (Aggarwal and Reddy, 2013). To explain how
the objects are assigned to each cluster, several ap-
proaches can be used (Gan et al., 2007; Jain, 2010).
Firstly, visual exploration is often applied by using
various techniques like scatterplots, projections, and
dendrograms for hierarchical clustering. Secondly, a
statistical study of each cluster can be achieved (by
computing minimum/maximum/mean values for each
attribute), and cluster centroids can be used to de-
fine representative items for the clusters. Thirdly, a
comparison to a ground truth can be carried out when
available. Finally, machine learning can be used to
gain insight about clusters: a convenient approach
consists in building a decision tree with a cluster as
its target variable in order to explain why an element
is assigned to it (Qyu et al., 2004).
In fact, decision trees are powerful tools for de-
cision support, data mining and visualization (Bar-
Figure 1: A decision tree representing a fictive cluster as-
signment that is explained by using the age feature.
low and Neville, 2001; van den Elzen and van Wijk,
2011), as they use a formalism that is intuitive and
easy to understand (Murthy, 1998). More precisely,
given a dataset containing n features A
1
,...,A
n
, a de-
cision tree can explain the value of the feature A
i
(of-
ten called class) according to the values of the other
features (A
j
, with j different to i). Graphically, de-
cision trees are frequently represented by node-link
diagrams (Figure 1). In addition, decision trees can
be automatically built from data by using numerous
techniques (Kotsiantis, 2013) e.g., the well-known
C4.5 (Quinlan, 1993) and CART (Breiman et al.,
1984) algorithms. Once built, a decision tree can
be characterized by two important properties: its size
(the number of nodes) and its accuracy regarding the
data (estimated using the error rate, i.e. the ratio of
elements which are not correctly explained using the
tree) (Breslow and Aha, 1997).
However, in some cases, they can be large and dif-
ficult to visualize (Herman et al., 1998). This makes
the use of complex decision trees for cluster inter-
pretation a daunting endeavor for a human analyst.
48
Parisot O., Ghoniem M. and Otjacques B..
Decision Trees and Data Preprocessing to Help Clustering Interpretation.
DOI: 10.5220/0005001300480055
In Proceedings of 3rd International Conference on Data Management Technologies and Applications (DATA-2014), pages 48-55
ISBN: 978-989-758-035-2
Copyright
c
2014 SCITEPRESS (Science and Technology Publications, Lda.)

Therefore, we propose an original preprocessing ap-
proach to transform the data, so that the clusters ob-
tained from the transformed data can be more easily
interpreted as they yield a simpler decision tree.
The rest of this article is organized as follows.
Firstly, related work is discussed. Then, the presented
method is described. Finally, a prototype is presented,
and the results of experiments are discussed.
2 RELATED WORK
As a clustering can be interpreted using decision trees,
simplification techniques can be valuable. Yet, sev-
eral methods have been proposed to reduce the size
of decision trees with a minimal impact on their accu-
racy.
Firstly, pruning is a well-known simplification
procedure (Breslow and Aha, 1997). It removes the
parts of the decision tree having a low explicative
power (i.e. by removing the branches that explain too
few cases and the branches with a high error rate). In
a recent work, the pruning algorithm is driven by the
dimensions of the decision tree (Stiglic et al., 2012).
Nevertheless, applying pruning on a decision tree is
likely to reduce its accuracy (Breslow and Aha, 1997).
Secondly, a simplified decision tree can be
obtained by working directly on the data. Com-
monly used as a preliminary step in machine
learning (Famili et al., 1997), data preprocessing
transforms a dataset to facilitate its use in a given
task (visualization, knowledge extraction, support
for modeling etc.) (Kandel et al., 2011). More
precisely, data preprocessing is a generic term
which regroups several kinds of data manipulation
tasks (Engels and Theusinger, 1998): ”cleaning”
(treatment of noise/extreme/redundant/unknown
values, etc.), ”dimensionality altering” (construc-
tion/transformation/selection of features, etc.) and
”quantity altering” (selection/sampling of data
records). As these transformations aim at simplifying
the data (in terms of dimensionality, number of
possible values, etc.), they can also help reduce the
size of the associated decision tree (at the expense of
accuracy). However, preprocessing has to be care-
fully used because it generally causes information
loss e.g., feature or records deletion.
Thirdly, it is possible to combine visualization,
user interaction and simplification techniques in or-
der to produce decision trees that are easier to in-
spect (van den Elzen and van Wijk, 2011). Typically,
simplifying a huge decision tree can be achieved by
collapsing large parts of it and allowing the analyst
expand them interactively.
In this paper, we aim at providing a clustering that
can be explained with a simple and accurate decision
tree. To this end, our approach consists in preprocess-
ing the data prior to clustering in order to obtain sim-
pler trees that are more suitable for cluster interpreta-
tion, while keeping both the intensity of data transfor-
mation and clustering alteration under control.
3 CONTRIBUTION
3.1 Overview of the Method
By cleverly transforming the dataset before clustering
(Algorithm 1), our method aims to obtain a slightly
different clustering that will yield a simpler decision
tree compared to the initial dataset. In other words,
simpler data lead to simpler clusterings that are easier
to interpret.
Algorithm 1: Method.
Require:
1: a dataset DS
Ensure:
2: preprocess the dataset DS to obtain a transformed
dataset DS
0
3: compute the clusters from the dataset DS
0
4: compute a decision tree that explains the cluster
assignment
However, to correctly appreciate the obtained
cluster interpretation, it is critical to check the mod-
ified dataset and the related clustering. To do that,
the method should control the data transformation,
in order to retain the most significant parts of the
dataset. Moreover, the clustering alteration should be
measured by comparing the modified clustering to the
original one.
3.2 Data Transformation Control
There are several metrics to gauge the intensity of data
transformation (Wang and Wang, 2007). In this work,
we use the data completeness ratio (DCR) (Parisot
et al., 2013) to reflect the loss of information due
to data preprocessing methods (e.g., record deletion,
loss of precision after discretization). More precisely,
the DCR of a modified dataset is obtained by comput-
ing the ratio of values that are kept unchanged during
the preprocessing steps. Hence, a DCR close to 100%
represents a slight transformation (and conversely, a
DCR close to 0% represents a considerable transfor-
mation).
DecisionTreesandDataPreprocessingtoHelpClusteringInterpretation
49

3.3 Clustering Alteration Control
In addition, the clustering should keep the same
global meaning as in the initial data. Following our
method (Algorithm 1), the data are preprocessed and
the clusters are identified on the basis of transformed
values, not on the original information: so it leads to
different results. As a consequence, the cluster in-
terpretation based on the original variables becomes
questionable (Dolnicar and Gr
¨
un, 2008). The com-
parison of the modified clustering to the initial clus-
tering requires appropriate metrics as discussed in the
literature (Wagner and Wagner, 2007). In this work,
the Jaccard index (JI) is used (Definition 1) (Jaccard,
1908) to measure clustering overlap. Other candidate
indicators include the Rand index.
Definition 1. Given two clusterings C and C
0
, we
define the following values:
N
11
= pairs in the same cluster in C and C
0
N
10
= pairs in the same cluster in C, not in the same
cluster in C
0
N
01
= pairs in the same cluster in C
0
, not in the same
cluster in C
Using them, the Jaccard index is computed as
follows: JI = N
11
/(N
11
+ N
10
+ N
01
)
In practice, the closer the Jaccard index is to 1, the
more overlapping the clusterings (and vice versa).
3.4 An Evolutionary Algorithm
In this work, a dataset transformation is defined as
an ordered sequence of data preprocessing operations
(like discretization, normalization, feature selection,
etc.). Given a list of possible data preprocessing op-
erations, we have to find a sequence of operations
that finally leads to a simpler decision tree for clus-
ter assignment. In fact, this problem leads to a classic
search one: there is a large count of possible solu-
tions and it is not reasonable to evaluate all of them.
Search heuristics may be used to solve this kind of
problems. In this category, evolutionary algorithms
are well-known (BDack et al., 1991) and often consid-
ered as efficient (Rudolph, 1996). Recently, an evolu-
tionary algorithm was proposed to automatically filter
data (Derrac et al., 2012).
Likewise, we propose an evolutionary algorithm
for this problem (Algorithm 2). The input is a dataset
and the output is a transformed dataset leading to a
clustering that is interpretable using a simpler deci-
sion tree. The data transformation and the clustering
alteration are controlled with two threshold parame-
ters: the minimum data completeness ratio and the
minimum Jaccard index.
Algorithm 2: Evolutionary algorithm.
Require:
1: a dataset DS, a minimum DCR, a minimum JI
Ensure:
2: Generate and evaluate a list of sequences of pre-
processing operations L (initial population)
3: while (no stagnation of best sequence) and (not
only similar sequences) do
4: Select two parent sequences S
1
and S
2
from L
5: Cross-over of S
1
and S
2
: build a new child se-
quence of preprocessing operations S
new
6: Mutation of the child sequence S
new
7: Evaluate the sequence S
new
and add it into L
8: Identify and remove the worst sequence S
worst
from L
9: Identify the best sequence S
best
in L and test if
stagnation
10: end while
11: Apply the best sequence S
best
on the dataset DS
to produce a dataset DS
0
12: return the dataset DS
0
The most important aspect of evolutionary algo-
rithms is the evaluation of the possible solutions (of-
ten called fitness). Here, the following metrics are
used to evaluate the sequence: the decision tree size,
the decision tree error rate, the data completeness ra-
tio, the amount of overlap between the initial and
resulting clusterings measured by the Jaccard index.
Based on this evaluation method, the algorithm aims
at finding a sequence of preprocessing operations
leading to:
• A modified dataset whose data completeness ratio
is higher than a threshold.
• An altered clustering that is interpretable with a
small decision tree, while the Jaccard index com-
puted between this clustering and the initial one is
higher than a threshold.
To achieve this goal, the algorithm is configured
with two parameters: P (the population size, i.e. the
count of possible solutions) and M (the maximum
count of loops with best sequence stagnation). The
algorithm follows different steps. First of all, an ini-
tial list of P sequences is built, and each sequence
is defined with a randomly chosen data preprocess-
ing operation (line 2). Then, while the current best
solution does not stagnate (regarding M) and the list
of possible solutions contains different sequences (i.e.
leading to a cluster assignment decision tree with the
same size) (line 3), the following steps are repeated:
• The tournament strategy (BDack et al., 1991) is
used to select two parent sequences from the cur-
DATA2014-3rdInternationalConferenceonDataManagementTechnologiesandApplications
50

rent list of sequences (line 4). The selected se-
quences are randomly cut and merged into a new
child sequence (line 5).
• A data preprocessing operation is randomly se-
lected and added into the child sequence (line 6);
after that, the child sequence is evaluated and
added into the current list of sequences (line 7).
• In order to keep a constant count of sequences (P),
the algorithm removes the sequence that leads to
the largest decision tree (line 8).
• The current best solution is identified and a stag-
nation test checks if the best solution remains un-
changed over several loops (regarding M) (line 9).
At the end (line 11), the obtained solution is a
transformed dataset leading to a clustering that is eas-
ier to interpret.
3.5 Usage of the Algorithm
The evolutionary algorithm proposed in this paper
aims at transforming data to help cluster interpreta-
tion. This transformation is controlled by two pa-
rameters, the minimal Jaccard index and the mini-
mal data completeness ratio, in order to obtain both
a dataset and a clustering that are close to the origi-
nal ones. Letting the user tweak these parameters can
be useful to analyze data following the visual analyt-
ics paradigm (Keim et al., 2008). Hence, results can
be produced and refined iteratively in order to support
cluster interpretation through visual inspection by the
end-user, trading accuracy for interpretability.
4 EXPERIMENTS
4.1 Prototype & Evaluation Protocol
A prototype has been developed in JAVA as a stan-
dalone tool. It is based on WEKA, a widely-used data
mining library (Witten et al., 2011) that provides al-
gorithms for decision tree induction, clustering and
preprocessing. The graphical representation of the de-
cision trees relies on the JUNG library (O’Madadhain
et al., 2003). The prototype provides a user interface
for results exploration (including statistics and data
visualizations) and user interaction e.g., to stop the
algorithm when a satisfactory solution is found.
We evaluated our approach on a selection of
datasets with various characteristics (record & feature
count, etc.) (Bache and Lichman, 2013; Torgo, 1998).
The datasets have been chosen with cluster interpreta-
tion in mind. For instance, several datasets have been
discarded because they lead to trivial clusterings such
as the spambase and magic04 datasets.
In order to check the impact of our method, we
have transformed these datasets with different values
for the minimal Jaccard index and the minimal data
completeness ratio. Then, we have compared the de-
cision trees explaining the clusterings of the origi-
nal vs. transformed datasets. In this work, we used
the popular k-means clustering algorithm (Gan et al.,
2007; Aggarwal and Reddy, 2013; Jain, 2010). Deci-
sion trees have been generated with J48 (Witten et al.,
2011), a widely used implementation of the C4.5 al-
gorithm (Quinlan, 1993). The pruning phase has been
enabled during the execution of the C4.5 algorithm, in
order to initially obtain small trees and check the ben-
efits of our approach.
During the tests, the following data preprocessing
operations have been considered:
• supervised and unsupervised feature selection,
• constant features deletion,
• missing values imputation/marking/deletion,
• outliers marking/deletion,
• attribute transformation (numerics to nominals,
nominals to binaries, nominals to numerics, etc.).
Lastly, the evolutionary algorithm has been empir-
ically configured as follows: the population count (P)
has been set to 50, and the stagnation count (M) has
been set to 200.
4.2 Results
The results (Tables 1 & 2 & 3) show the decision
trees obtained in the following cases with k-means
(k=2, 3, 4). For the sake of clarity, the tables do not re-
port the sequences of preprocessing operations which
have been found:
• CASE 1: Clustering of the original dataset and
computation of the cluster assignment decision
tree.
• CASE 2: Execution of the evolutionary algorithm
(Algorithm 2) to obtain a modified dataset, clus-
tering of the modified dataset and computation of
the cluster assignment decision tree.
The results show that the evolutionary algorithm
(Algorithm 2) is able to find data transformation se-
quences that meet our expectations: the modified data
(’CASE 2’) lead to clusters that are interpretable with
simpler decision trees than those obtained from the
original data (’CASE 1’).
In fact, the decision trees in ’CASE 2’ are smaller
because they represent altered and simpler clusterings
DecisionTreesandDataPreprocessingtoHelpClusteringInterpretation
51

Table 1: Clustering interpretation after the computation of 2 clusters: for CASE 1 & 2, the decision tree sizes and the error
rates are reported. For CASE 2, the Jaccard index (JI) and the data completeness ratio (DCR) are reported to show the
clustering alteration and the intensity of the data transformation.
Dataset CASE 1 CASE 2
name #rows #features size error size error JI DCR
autos 205 26 27 5.36% 8 2.92% 0.50 42%
vehicle 846 18 19 0.71% 6 0.23% 0.81 40%
cmc 1,473 10 77 1.90% 3 0% 0.40 100%
winequality-red 1,599 12 47 0.69% 3 0% 0.48 100%
SkillCraft1 3,395 20 201 1.88% 3 0% 0.41 95%
sick 3,772 30 67 0.80% 3 0% 0.58 96%
cpu act 8,192 22 223 0.69% 3 0% 0.61 82%
pol 15,000 49 17 0% 3 0% 0.47 100%
cal housing 20,460 9 279 0.40% 3 0% 0.58 89%
adult 32,561 15 609 0.95% 3 0% 0.55 47%
Table 2: Clustering interpretation after the computation of 3 clusters: for CASE 1 & 2, the decision tree sizes and the error
rates are reported. For CASE 2, the Jaccard index (JI) and the data completeness ratio (DCR) are reported to show the
clustering alteration and the intensity of the data transformation.
Dataset CASE 1 CASE 2
name #rows #features size error size error JI DCR
autos 205 26 18 4.88% 9 5.36% 0.51 96%
vehicle 846 18 35 0.82% 5 0% 0.41 89%
cmc 1,473 10 23 0.34% 4 0% 0.52 60%
winequality-red 1,599 12 99 1.94% 7 0.12% 0.41 92%
SkillCraft1 3,395 20 233 2.44% 25 0.09% 0.50 90%
sick 3,772 30 51 0.40% 5 0.05% 0.52 97%
cpu act 8,192 22 49 0.16% 4 0% 0.40 91%
pol 15,000 49 143 0.40% 5 0% 0.45 100%
cal housing 20,460 9 241 0.30% 5 0.01% 0.54 89%
adult 32,561 15 1267 1.50% 25 0% 0.40 47%
Table 3: Clustering interpretation after the computation of 4 clusters: for CASE 1 & 2, the decision tree sizes and the error
rates are reported. For CASE 2, the Jaccard index (JI) and the data completeness ratio (DCR) are reported to show the
clustering alteration and the intensity of the data transformation.
Dataset CASE 1 CASE 2
name #rows #features size error size error JI DCR
autos 205 26 51 6.34% 17 6.82% 0.46 92%
vehicle 846 18 15 0.59% 5 0% 0.67 63%
cmc 1,473 10 44 1.08% 12 0.40% 0.41 90%
winequality-red 1,599 12 145 3.25% 33 0.43% 0.37 83%
SkillCraft1 3,395 20 339 2.95% 55 0.73% 0.36 90%
sick 3,772 30 47 0.45% 11 0% 0.80 70%
cpu act 8,192 22 179 0.44% 14 0% 0.38 91%
pol 15,000 49 293 0.60% 47 0.10% 0.47 53%
cal housing 20,460 9 391 0.53% 66 0.10% 0.40 66%
adult 32,561 15 1301 2.25% 104 0.02% 0.40 53%
built on data which have been modified by the evolu-
tionary algorithm.
Moreover, the produced decision trees often have
a good accuracy. This means that the cluster assign-
ment logic is well captured by the trees. For example,
the clustering of the unmodified adult dataset (k=2)
leads to a tree of size 609: as is, the tree is not in-
telligible. In comparison, the clustering of the trans-
DATA2014-3rdInternationalConferenceonDataManagementTechnologiesandApplications
52
formed dataset leads to a tree of size 3 (Table 1). By
computing (k=3) clusters for the same dataset, a sim-
pler tree is obtained (25 nodes instead of 1267). While
the interpretation of a tree of size 25 may not be triv-
ial, a tree with 1267 nodes is unreadable (Table 2).
Additionally, in most cases a light data transfor-
mation is needed to get simpler clustering interpre-
tation trees, as expressed by high data completeness
ratio figures. For example, if we examine the cmc
dataset, the discretization of the first numeric attribute
suffices to obtain a much smaller clustering decision
tree. In contrast, the adult dataset needs a more inten-
sive transformation to simplify the tree (numerizing
all nominal attributes).
Finally, a Jaccard index mostly close to 0.5 indi-
cates that significant differences were found between
the initial and the resulting clusterings. Even if we
have observed that correct results can be obtained
while keeping a high Jaccard index, a powerful sim-
plification implies a substantial clustering alteration.
The following sections show the transformation
sequences found by our algorithm for two use-cases.
4.3 Example 1: the abalone Dataset
We have considered abalone, a widely-used
dataset (Bache and Lichman, 2013). It contains
the description of 4177 abalones having 8 attributes
including sex and length.
By simply using the k-means algorithm (k=2), we
obtain clusters that can be interpreted with a decision
tree of size 26. The error rate of the decision tree is
equal to 14.4% which is substantial.
Using our approach, we obtain a dataset for which
the clustering can be interpreted with a decision tree
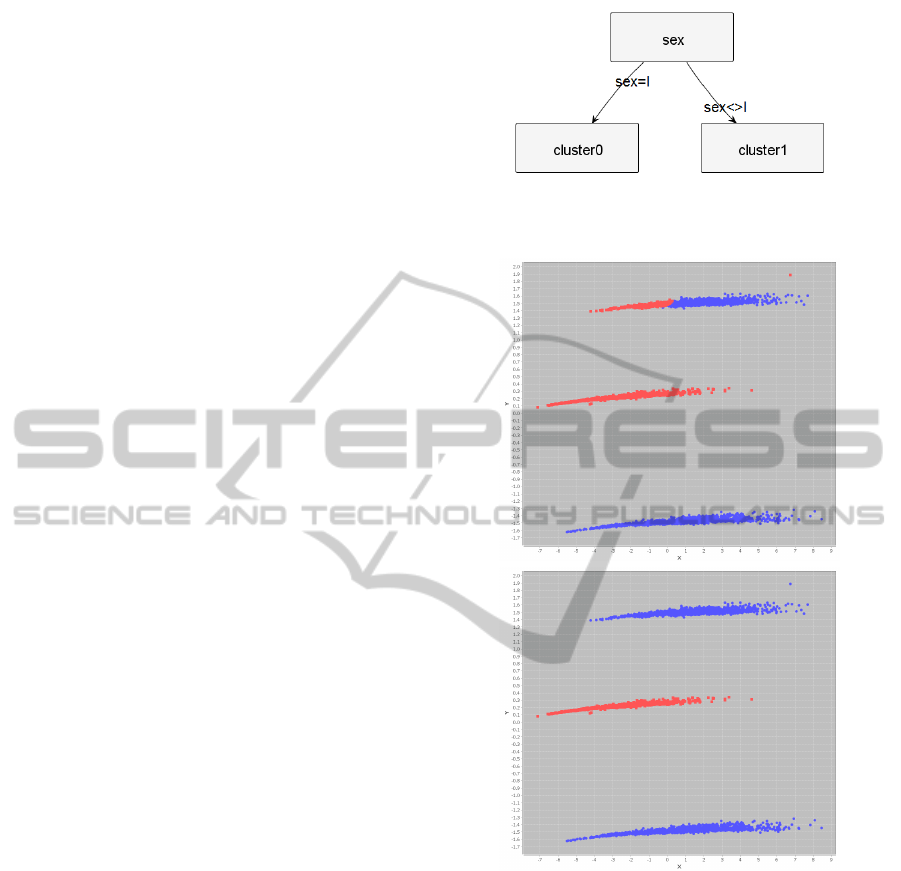
of size 3 with an error rate close to 0% (Figure 2).
In fact, the evolutionary algorithm found that replac-
ing the nominal sex attribute by several binary at-
tributes allowed to obtain a more interpretable clus-
tering. Thus, the obtained tree is simple and shows
that the sex attribute allows to explain the cluster as-
signment (infants in the first cluster, non-infants in the
other one). Lastly, the data completeness ratio is high
(88.9%) and the measured Jaccard index (0.78) shows
a strong agreement on cluster assignments.
To inspect the impact on the clusterings, well-
known projection methods can be used (Gan et al.,
2007). In Figure 3, PCA projections (i.e. Principal
Component Analysis) are used to show the clusters
before and after the preprocessing. According to these
projections, the clusters are different. But if we take a
look at the decision tree for cluster assignment (Fig-
ure 2), we can see that the interpretation is simpler.
Figure 2: Cluster assignment (k-means, k=2) for ’abalone’
after transformation by the evolutionary algorithm.
Figure 3: PCA projections for the abalone dataset for 2
clusters: the axes represent the two main principal compo-
nent. The first one is colored with the original clusters (top),
the second one with the transformed clusters (bottom).
4.4 Example 2: the vehicle Dataset
As another example, we have considered the vehicle
dataset (Bache and Lichman, 2013). It contains the
description of 846 vehicles with 18 attributes.
By computing the k-means clustering (k=3), we
obtain a result that can be interpreted with a deci-
sion tree of size 35. With our approach, we obtain
a transformed dataset whose clustering can be inter-
preted with a decision tree of size 5 (Figure 4).
To obtain this transformed dataset, the following
DecisionTreesandDataPreprocessingtoHelpClusteringInterpretation
53
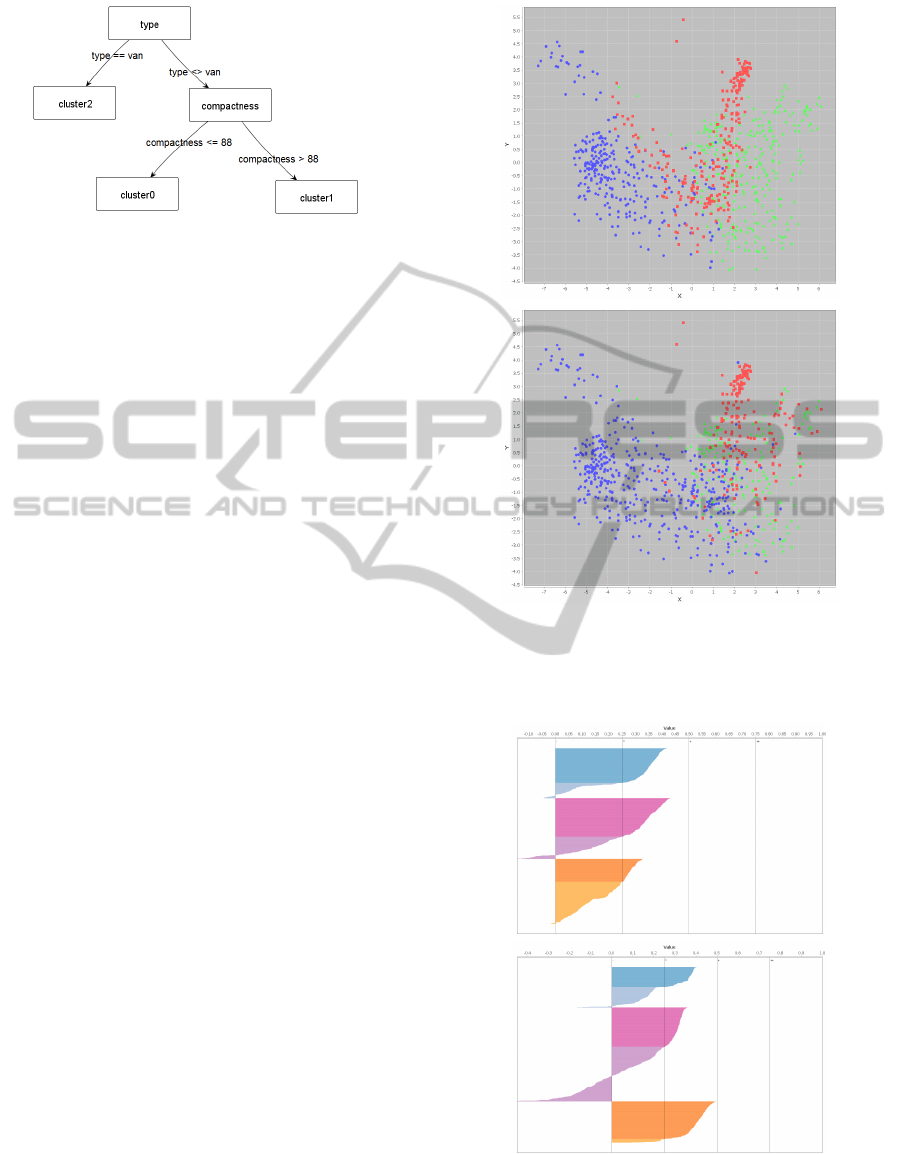
Figure 4: Cluster assignment (k-means, k=3) for ’vehicle’
after transformation with the evolutionary algorithm.
sequence of preprocessing operations has been dis-
covered by our evolutionary algorithm:
1. transformation of the first nominal attribute to sev-
eral binaries attributes,
2. discretization of the first numeric attribute,
3. marking of extreme values and outliers,
4. and finally transformation of the second nominal
attribute to several binaries attributes.
This sequence of operations causes some informa-
tion loss because the resulting data completeness ratio
is equal to 63%.
It causes clustering perturbation too: the Jaccard
Index is equal to 0.67 after the transformation. To
observe it, PCA projections have been computed be-
fore and after the preprocessing (Figure 5). In addi-
tion, Silhouette plots help to observe the quality of the
clustering (Rousseeuw, 1987): the results show that
the clusters are less correct (Figure 6).
As a result, the clustering is simpler to interpret,
but different than the one computed on the initial data.
Hence, our method allows the user to tune the trade-
off between simplicity of cluster interpretation and
agreement with the initial clustering. In other words,
it provides a way to build a simple clustering decision
tree that can be considered as an approximation of the
initial clustering decision tree. In addition, it provides
a modified dataset for which the cluster assignment is
correct, which may be subjected to a visual inspection
by the domain experts.
5 CONCLUSION
In this paper, we presented a method to help clustering
interpretation. It relies on an evolutionary algorithm
that transforms data so that the clustering of these
modified data can be explained with a simple cluster
assignment decision tree. The method has been de-
veloped in a Java prototype, and its effectiveness was
demonstrated and discussed on several datasets.
Figure 5: PCA projections for the vehicle dataset for 3 clus-
ters: the axes represent the two main principal components.
The first one is colored with the original clusters (top), the
second one with the transformed clusters (bottom).
Figure 6: Silhouette plots for the vehicle dataset for 3 clus-
ters (with and without data transformation). The x axis rep-
resents the Silhouette value, the y axis represents the ele-
ments. Larger Silhouette values indicate a better clustering.
DATA2014-3rdInternationalConferenceonDataManagementTechnologiesandApplications
54

Typically, the method can be used to discover pat-
terns from raw business data and support result expla-
nation. In future work, we will conduct user exper-
iments to evaluate the usefulness of our method for
interpreting the insights found from data. In addition,
we will apply the method on large real-world environ-
mental datasets. To this end, we will improve our ap-
proach to support large datasets by using incremental
techniques for clustering and decision tree induction.
REFERENCES
Aggarwal, C. and Reddy, C. (2013). Data Clustering: Algo-
rithms and Applications. Chapman & Hall/CRC D.M.
and K.D. Series. Taylor & Francis.
Bache, K. and Lichman, M. (2013). UCI machine learning
repository.
Barlow, T. and Neville, P. (2001). Case study: Visualiza-
tion for decision tree analysis in data mining. In Pro-
ceedings of INFOVIS’01, INFOVIS ’01, pages 149–,
Washington, DC, USA. IEEE Computer Society.
BDack, T., Hoffmeister, F., and Schwefel, H. (1991). A
survey of evolution strategies.
Breiman, L., Friedman, J. H., Olshen, R. A., and Stone, C. J.
(1984). Classification And Regression Trees. Chap-
man and Hall, New York.
Breslow, L. A. and Aha, D. W. (1997). Simplifying decision
trees: A survey. Knowl. Eng. Rev., 12(1):1–40.
Derrac, J., Cornelis, C., Garca, S., and Herrera, F. (2012).
Enhancing evolutionary instance selection algorithms
by means of fuzzy rough set based feature selection.
Information Sciences, 186(1):73 – 92.
Dolnicar, S. and Gr
¨
un, B. (2008). Challenging factor–
cluster segmentation. Journal of Travel Research,
47(1):63–71.
Engels, R. and Theusinger, C. (1998). Using a data metric
for preprocessing advice for data mining applications.
In ECAI, pages 430–434.
Famili, A., Shen, W.-M., Weber, R., and Simoudis, E.
(1997). Data preprocessing and intelligent data anal-
ysis. Intelligent Data Analysis, 1(1–4):3 – 23.
Gan, G., Ma, C., and Wu, J. (2007). Data clustering - The-
ory, Algorithms and Applications. ASA-SIAM series
on statistics and applied probability. SIAM.
Herman, I., Delest, M., and Melancon, G. (1998). Tree vi-
sualisation and navigation clues for information visu-
alisation. Technical report, Amsterdam, Netherlands.
Jaccard, P. (1908). Nouvelles recherches sur la distribution
florale. Bulletin de la Soci
´
et
´
e vaudoise des sciences
naturelles. Impr. R
´
eunies.
Jain, A. K. (2010). Data clustering: 50 years beyond k-
means. Pattern Recognition Letters, 31(8):651–666.
Kandel, S., Heer, J., Plaisant, C., Kennedy, J., van Ham,
F., Riche, N. H., Weaver, C., Lee, B., Brodbeck, D.,
and Buono, P. (2011). Research directions in data
wrangling: Visualizations and transformations for us-
able and credible data. Information Visualization,
10(4):271–288.
Keim, D., Andrienko, G., Fekete, J.-D., G
¨
org, C., Kohlham-
mer, J., and Melanc¸on, G. (2008). Information vi-
sualization. chapter Visual Analytics: Definition,
Process, and Challenges, pages 154–175. Springer-
Verlag, Berlin, Heidelberg.
Kotsiantis, S. (2013). Decision trees: a recent overview.
Artificial Intelligence Review, 39(4):261–283.
Murthy, S. K. (1998). Automatic construction of decision
trees from data: A multi-disciplinary survey. Data
Min. Knowl. Discov., 2(4):345–389.
O’Madadhain, J., Fisher, D., White, S., and Boey, Y. (2003).
The JUNG (Java Universal Network/Graph) frame-
work. Technical report, UCI-ICS.
Parisot, O., Bruneau, P., Didry, Y., and Tamisier, T. (2013).
User-driven data preprocessing for decision support.
In Luo, Y., editor, CDVE, volume 8091 of LNCS,
pages 81–84. Springer Berlin Heidelberg.
Quinlan, J. R. (1993). C4.5: Programs for Machine Learn-
ing. Morgan Kaufmann.
Qyu, M., Davis, S., and Ikem, F. (2004). Evaluation of
clustering techniques in data mining tools.
Rousseeuw, P. J. (1987). Silhouettes: a graphical aid to
the interpretation and validation of cluster analysis.
Journal of computational and applied mathematics,
20:53–65.
Rudolph, G. (1996). Convergence of evolutionary algo-
rithms in general search spaces. In Proceedings of
IEEE Int. Conf. on Evolutionary Computation, pages
50–54.
Stiglic, G., Kocbek, S., Pernek, I., and Kokol, P. (2012).
Comprehensive decision tree models in bioinformat-
ics. PLoS ONE, 7(3):e33812.
Torgo, L. (1998). Regression datasets.
www.dcc.fc.up.pt/∼ltorgo/Regression/DataSets.html.
van den Elzen, S. and van Wijk, J. (2011). Baobabview:
Interactive construction and analysis of decision trees.
In Visual Analytics Science and Technology (VAST),
2011 IEEE Conference on, pages 151–160.
Wagner, S. and Wagner, D. (2007). Comparing clusterings:
an overview. Universit
¨
at Karlsruhe.
Wang, S. and Wang, H. (2007). Mining data quality in com-
pleteness. In ICIQ, pages 295–300.
Witten, I. H., Frank, E., and Hall, M. A. (2011). Data
Mining: Practical Machine Learning Tools and Tech-
niques. Elsevier.
DecisionTreesandDataPreprocessingtoHelpClusteringInterpretation
55
