
Open Data Integration
Visualization as an Asset
Paulo Carvalho
1,2
, Patrik Hitzelberger
1
, Beno
ˆ
ıt Otjacques
1
, Fatma Bouali
2
and Gilles Venturini
2
1
Gabriel Lippmann Public Research Center, 41 rue du Brill, L-4422 Belvaux, Luxembourg
2
University Franc¸ois Rabelais of Tours, Tours, France
Keywords:
Data Integration, Information Visualization, Open Data, Linked Open Data.
Abstract:
For several years, and even decades, data integration has been a major problem in computer sciences. When it
becomes necessary to process information from different data sources, several problems may appear, making
the process of integration more difficult. Nowadays, more and more information is being sent and received
and is made available on the Web and Data Integration is becoming even more important. This is especially
the case in the emerging trend of Open Data (OD). Integrating data from public entities can be a difficult
process. Large quantities of datasets are made available. However, an important level of heterogeneity may
also exist: Datasets exist in different formats, forms and shapes. While it is important to be able to access this
information, it would also be completely useless if we were not able to interpret it. Information Visualization
may be an important tool to help the OD integration process. This paper presents problems and barriers which
can be encountered in the data integration process, and, more specifically, in the OD integration process. The
paper also describes how Information Visualization can be used to facilitate the integration of OD and make
the procedure more effective, friendlier, and faster.
1 INTRODUCTION
The main aims of Data Integration are to se-
lect and combine information from different data
sources/systems/entities into a unified view, in a way
that users can exploit and analyse it conveniently. For
several years, it has been a major subject of study in
computer science (Ziegler and Dittrich, 2004). The
topic has recently gained new importance due to the
appearance of numerous new information sources,
like Social Media, Blogs, Scientific Data, commercial
data, Big Data and Open Data (OD).
These data sources increase the data volumes and
the potential number of providers significantly, with
data data coming from public and private entities, as
well as from individuals. The relatively recent con-
cept of OD is a major example of this phenomenon.
OD makes information formerly hidden ”inside” pub-
lic and private organizations available and accessible
to everyone at little or no cost and without permis-
sion limitations. In order to benefit from the presump-
tive high potential business-value of OD, data must
be made usable, meaningful and exploitable to permit
its integration (Davies, 2010). This paper addresses
this problem, discussing the main problems related to
Data Integration with a special emphasis on the dif-
ficulties directly linked to the Integration of OD. In-
formation Visualization – also known as InfoVis – is
presented as a core and powerful approach for back-
ing the integration process.
2 OD INTEGRATION
2.1 General Overview
The appearance of new information sources not only
contributes to the growing amount of information, it
also increases the heterogeneity of data sources. Data
Integration processes have become even more com-
plicated and demanding. OD integration is currently
a subject of major importance. As an example, it is
in the focus of the current EU research framework
programme Horizon 2020 (Commission, 2014). One
topic of the ICT2014-1 call (EuropeanCommission,
2013) is ICT-15-2014: ”Big Data and Open Data In-
novation and take-up”. It focuses on the entire value
chains and reuse of Open (and Big) Data. It is a
major problem because of the difficulty of integrat-
41
Carvalho P., Hitzelberger P., Otjacques B., Bouali F. and Venturini G..
Open Data Integration - Visualization as an Asset.
DOI: 10.5220/0005000600410047
In Proceedings of 3rd International Conference on Data Management Technologies and Applications (DATA-2014), pages 41-47
ISBN: 978-989-758-035-2
Copyright
c
2014 SCITEPRESS (Science and Technology Publications, Lda.)
ing heterogeneous datasets. Datasets may be built us-
ing completely different methods (formats, schema,
metadata, etc.) (Rivero et al., 2012).
Today, organizations already integrate their inter-
nal data, using e.g. central repositories, data ware-
houses, or more process-oriented approaches like
service-oriented architectures for their operational
systems.
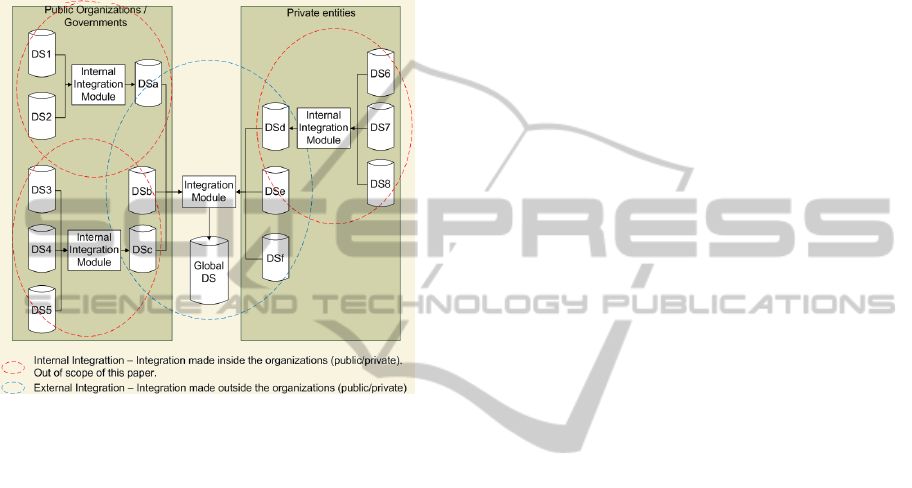
Figure 1: Public and Private Data Integration.
The integration of external data into these existing
IT landscapes is difficult. An internal integration oc-
curs ”inside” an organization. The probability that an
organization can control the format rules, policies and
standards is higher than it is for external, autonomous
data sources. In the following sections, we discuss
OD ”external integration” problems and issues, and
the current status and solutions.
2.2 An Overview of the Current State
Many public organizations, from local to national and
trans-national levels, have already made their data ac-
cessible on the Web. Several initiatives and directives
influence these events: European Union PSI Directive
(EuropeanParliament, 2003), Freedom of Informa-
tion (FOI) initiatives in different countries and con-
tinents (UnitedStateDepartmentOfState, 2010) (Gov-
ernmentOfSouthAustralia, 2003), Canada’s Action
Plan on Open Government (GovernmentOfCanada,
2011), etc. One argument for publishing public data is
the fact that it has been paid by the citizens in general
(Vander Sande et al., 2012). So, over the last couple
of years, the public sector has already created Open
Government Data portals to open and share its data.
These data portals or catalogues offer a single location
where governmental data can be found (Maali et al.,
2010). Others are currently in development.
2.3 Problems and Challenges
The OD movement not only has benefits. The fact
that public and private entities provide their datasets
brings issues of privacy, ownership, availability, us-
ability, accuracy and data combination (Janssen et al.,
2012). Different challenges related to interoperabil-
ity remain unresolved. Entities continue to build and
furnish datasets without applying common standards
and using heterogeneous systems. These datasets may
be constructed using different and inconsistent tech-
niques. Actually, and in general, Open Government
Data initiatives publish their data using one of the
following two general approaches (Kalampokis et al.,
2011):
• The data is available on the Web as downloadable
files in different formats, e.g. Excel, CSV, XML,
etc.
• The data is available on the Web using RESTful
APIs and SPARQL interfaces, as linked data.
Individual datasets, made up of data - and meta-
data in the best case scenario - are interesting and
useful on their own. Nevertheless, the positive and
collaborative effect of using public and private infor-
mation may be higher if data of different types (sci-
entific, social media, etc.) and delivered from several
entities is combined, compared and linked. Some of
the major problems and constraints which may be en-
countered when trying to integrate multi-source data
are related to the following topics:
• Structure and formats used - Given the high
number of different sources and datasets, it is
not astonishing that Public Sector Information
(PSI) is published following different modelling
paradigms (e.g. tabular, relational) (McCusker
et al., 2012) and formats: ZIP, CSV, XML, EX-
CEL, PDF, etc. Sometimes, data is even provided
in non-machine-readable and/or proprietary for-
mats;
• Metadata - Metadata is of paramount importance
for data integration and is one of the chief com-
ponents of PSI systems for OD provisioning. A
metadata schema is one of the main parts of a
PSI system which should be characterized in a
unified way (Bountouri et al., 2009). In other
words, metadata may be defined as necessary and
adequate so that data can be understood, shared
and reused (Edwards et al., 2011). If metadata
provided with a given dataset is not well-formed
DATA2014-3rdInternationalConferenceonDataManagementTechnologiesandApplications
42

and/or complete, final users may have difficul-
ties finding its related dataset (Houssos et al.,
2012). Metadata provides the means to discover
datasets, access them and understand them. Meta-
data normally refers to information about con-
text and content (for example, a title, a descrip-
tion, an author, etc.) of datasets. Most of meta-
data schemas implemented in the public sector
have been designed for national requirements. In
Australia, for example, the AGLS Metadata Stan-
dard was adopted (NationalArchivesofAustralia,
2010), New Zealand adopted the New Zealand
Government Locator Service (NZGLS) while the
United Kingdom chose another option, the e-
Government Metadata Standard (eGMS) (Charal-
abidis et al., 2009);
• Accessibility, Permanence and Timeliness - If OD
is commercially exploited, the providers should
respond to typical business requirements in terms
of accessibility, permanence and timeliness. Out-
dated information, missing information, or infor-
mation that is not accessible because of techni-
cal or other issues, cannot be the basis for reli-
able business processes. On the other hand, it
seems unrealistic to hope that the public sector
with its limited resources can offer the same ser-
vice levels as commercial data providers. The
integration processes must tackle these problems
– or at least make them visible when they occur
(Gurstein, 2011);
• Trust and Data Provenance - More and more, the
need for having information and knowledge about
data provenance is important. Data provenance, if
it can be determined, may be used by users/data
consumers to evaluate and interpret the informa-
tion provided (Moreau et al., 2008). OD Integra-
tion processes and applications should be aware
of data provenance, and offer efficient and reliable
ways to visualize and judge it;
• Multilingualism and cultural differences - The ex-
ample of the European Union, with its 28 mem-
ber states and a total of 24 official languages,
shows that the wealth of data that has been de-
scribed above is actually a linguistic mess. Fur-
thermore, cultural differences can already lead
to different semantics for basic integration prob-
lems: An address in France is not necessarily the
same “concept” as it is in Germany, for example.
Ideally, information represented in different lan-
guages should not hinder its integration. (Rehm
and Uszkoreit, 2011).
Even in a scenario where OD integration is tech-
nically possible, organizational and legal barriers may
exclude or complicate collaboration and the sharing
of data. Public and private entities may have some
constraints in opening and sharing their information.
They may claim ownership and/or control over certain
datasets (Martin et al., 2013).
2.4 Current OD Integration Solutions
Interoperability and standards are important to pro-
vide a solution able to analyse and process datasets
from various data sources, using different technolo-
gies and methods. Several solutions and systems, able
to help and support developers in processing a com-
plete and unified OD integration, have started to ap-
pear (e.g. Linked Open Data, CKAN, DKAN). They
are presented below.
2.4.1 Linked Open Data
OD may be defined in different forms - it may be rep-
resented as Linked Data. Linked Data refers to best
practices for publishing and connecting data on the
web that are machine-readable and may come from
different sources (Bizer et al., 2009). The adoption
of these practices leads to a concept where there is a
global web space in which both documents and data
- from different and multiple domains - are linked.
When OD is Linked Data, it is called Linked Open
Data. The main objective of Linked Open Data is
to help the Web of Data to identify datasets that are
available under open licences (OD sets), convert them
to a Resource Description Framework (RDF) apply-
ing Linked Data principles and finally publish them
on the Internet. Furthermore, as well as Linked Open
Data being concerned with the data publication as-
pect, it also takes the data consumption perspective
(Bauer and Kaltenb
¨
ock, 2011). Linked Open Data has
more advantages and less limitations and constraints
than OD. Currently, the so-called Linked Open Data
cloud already provides access to information covering
a large set of domains like economy, media, govern-
ment, life sciences, etc. The value and potential of
using all available data is huge.
In addition, while the idea behind OD is built on
the concept of a social web, the notion of Linked Data
is based on the semantic web approach (Bauer and
Kaltenb
¨
ock, 2011) - a movement which promotes the
use of common standards on the Web, encourages the
inclusion of semantic data in web pages and allows
data to be shared and reused by any kind of appli-
cation in a cost-efficient way. Sir Tim Berners-Lee
created a five-star model which describes the differ-
ent categories going from OD to Linked Open Data
(H
¨
ochtl and Reichst
¨
adter, 2011), to help and encour-
age entities to link their data:
OpenDataIntegration-VisualizationasanAsset
43
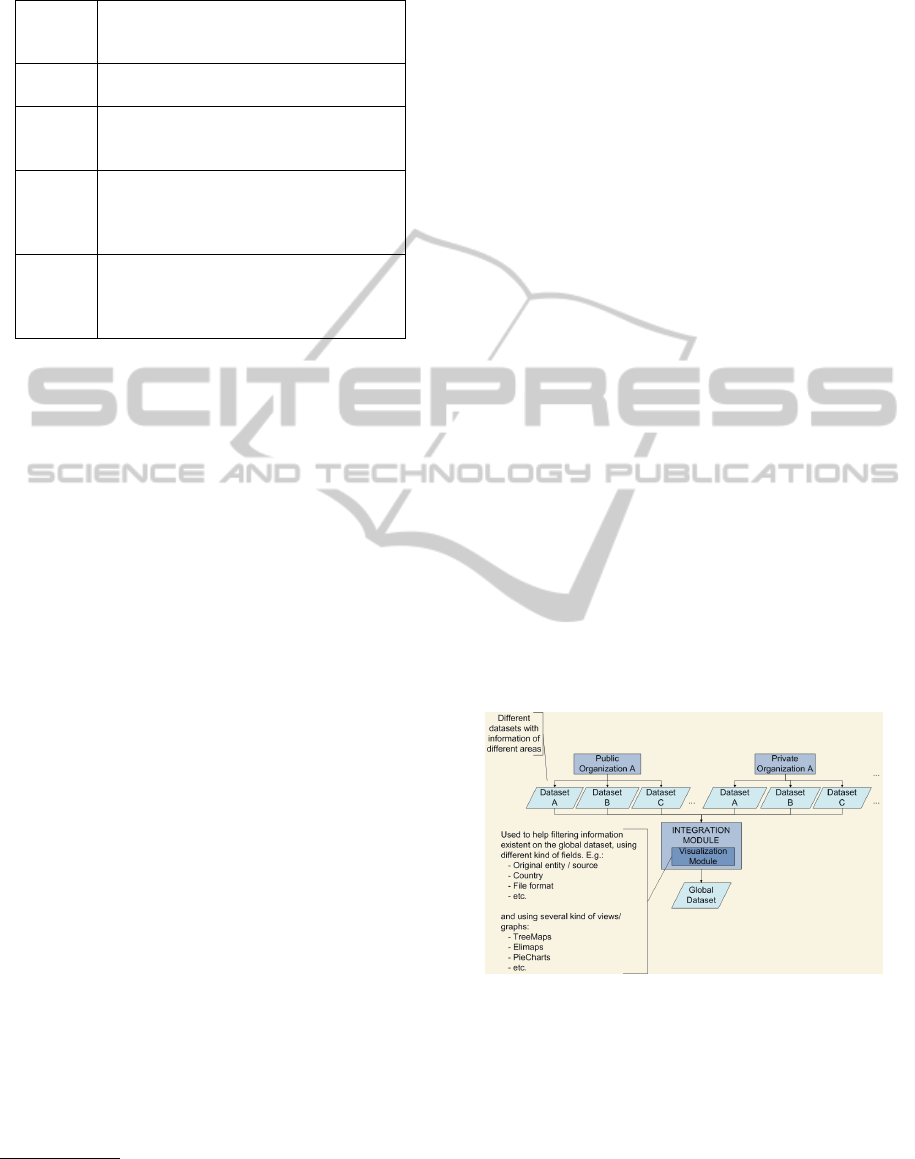
Table 1: Sir Tim Berners-Lee five stars model.
*
Information is available on the Web
under an open licence and in any
format.
**
(*) + Same as (*) + as structured
data.
***
(**) + Same as (**) + only
non-proprietary formats are used
(e.g. CSV instead of XLS).
****
(***) + Same as (***) + use of URI
(Uniform Resource Identifier)
identification - people can point to
individual data.
*****
(****) + Same as (****) + data is
linked to other data so context is
preserved - Interlinking between
data.
In the field of data management, Linked Open
Data is gaining importance. Several Open Govern-
ment Data portals, in various sectors and areas, are
already using Linked Open Data principles in their
systems (e.g. the Government Linked Data (GLD)
Working Group(W3c, 2014); the Linking Open Gov-
ernment Data (LOGD) Project(Twc, 2014); the LOD2
project(Lod2, 2014)).
2.4.2 CKAN
Comprehensive Knowledge Archive Network
(CKAN) is another project related to the OD integra-
tion topic (OpenKnowledgeFoundation, 2014). It is a
web-based Open Source data portal platform for data
management that provides necessary tools to the pub-
lic sector, other organizations and companies wanting
to publish and open their data. CKAN provides an
extensive support for Linked Data and RDF. CKAN
is already used by some important data catalogues
worldwide (e.g. the official Open Data portal of the
UK Government (Data.gov.uk, 2014); the prototype
of a pan-European data catalogue (Publicdata, 2014);
and Berlin’s Open Data Catalogue (Berlin.de, 2014)).
2.4.3 DKAN
DKAN is a Drupal-based
1
Open Data platform with
a full suite of cataloguing, publishing and visualiza-
tion features that help and support governments, non-
profits organizations and universities in easily pub-
lishing data to the public (Drupal, 2011). Most of
the core open data features that exist on CKAN are
replicated in DKAN.
1
Drupal is a Content Management System which has
grown in popularity in the last few years due to its open-
ness, modularity and features (Corlosquet et al., 2009)
3 INFORMATION
VISUALIZATION AS AN ASSET
Information Visualization can be extremely helpful
when large amounts of data are involved. In many
scenarios, end users do not have the technical expe-
rience and knowledge to understand the meaning of
data and how to formulate queries for the desired re-
sults. They should nevertheless be capable to discover
how to link data and how data is enabled to build
queries which yield the expected results (Fox and
Hendler, 2011). Information Visualization could be
a major asset to help and support end-users on these
tasks. Many problems and difficulties on interpret-
ing, filtering and viewing information can be avoided,
minimized and/or eliminated by using Information
Visualization. A Visualization System may be seen as
a block which receives data as input and interacts with
other entities to produce a graphical representation
of the received information (Duke et al., 2005). The
strength and power of Information Visualization is the
ability to present information in many and different
forms, graphs and shapes (e.g.: Pie charts, Ellimaps
- use nested ellipses of various sizes to build graph-
ics (Otjacques et al., 2009), Treemaps, Geographical
Treemaps, etc.). Depending on the purpose and mean-
ing of the processed data, one specific graph may be
easier to read and understand than another one. The
following architecture is presented to understand the
manner in which visualization may be an advantage in
the way information is selected, viewed and obtained.
Figure 2: Data Integration with Visualization.
In the solution presented above, an Information
Visualization block is used in the Integration Module
as a component in the integration process. It provides
a way to visually present the dataset information and
apply filters to them in a visual form. Based on these
facts, and because OD deals with different and hetero-
geneous data sources and multiple types of data, we
argue that Information Visualization can ease the ma-
nipulation, understanding and integration process of
DATA2014-3rdInternationalConferenceonDataManagementTechnologiesandApplications
44
the data that is generated and the data that is provided
by new information sources. Information Visualiza-
tion can be used to analyse and understand raw data
and metadata in both internal and external integra-
tions. Problems and difficulties in understanding, fil-
tering and viewing information can be avoided, min-
imized and/or eliminated by applying this paradigm.
An example of how Information Visualization could
help a user to quickly visualize external integration
issues is presented in figure 3:
Figure 3: Ellimap representing museum information.
The image represents the number of museums in
certain cities of France. The information, which was
previously integrated internally, comes from four dif-
ferent data sources:
• data.gouv.fr (RepubliqueFranc¸aise, 2013) - pro-
vides the number of museums in the cities of
Bordeaux, Lyon, Nantes, Paris, Strasbourg and
Toulouse;
• ToulouseMetropole.data [donn
´
ees publiques]
(Communaut
´
eUrbaineduGrandToulouse, 2011) -
provides the number of museums in the city of
Toulouse;
• Nantes Ouverture des Donn
´
ees - ouverture des
donn
´
ees publiques (NantesM
´
etropole, 2011) -
provides the number of museums in the city of
Nantes;
• Strasbourg.eu et Communaut
´
e Urbaine (Villeet-
Communaut
´
eUrbainedeStrasbourg, 2013) - pro-
vides the number of museums in the city of Stras-
bourg.
The size of each ellipse presented on the graph
is proportional to the number of museums in the re-
lated city. First, observing this graph, it is easy for
the user to compare cities and identify which one(s)
has more museums. This type of data representation
is very useful when the goal is to compare the size
of datasets for example. Second, it is also possible to
analyse more closely the information in the datasets.
In this case, for example, we can see that the informa-
tion about the number of museums in Nantes can be
obtained from two different data sources: data.gouv.fr
and Nantes Ouverture des Donn
´
ees. This is a typical
scenario where specific information can be obtained
from different sources. For example, if a user wants to
know the number of museums in Nantes, by analyzing
quickly the information on the graph, the user can eas-
ily see the existence of data incoherence. data.gouv.fr
indicates that there are 4 museums in Nantes while
Nantes Ouverture des Donn
´
ees demonstrates the ex-
istence of 15 museums. A user will have to choose
one data source for this information, which means he
or she has to determine which data source is the more
reliable, which one has been modified/updated more
recently, etc. An Ellimap can be used for this purpose.
It is possible to visualize the metadata of datasets (e.g.
by the use of tooltips). The example below demon-
strates how the user may see additional information
to help him to analyse and identify the required in-
formation (e.g. identify the more reliable data source
compared to another one).
Figure 4: Ellimap used to visualize dataset’s metadata.
Another kind of graph could be used for the same
purpose complementing the information with the lo-
cation of the analysed data sources: the geographical-
weighted Map. In Figure 5, the same example as pre-
sented above is shown. The difference is that the in-
formation is organized into rectangles which are po-
sitioned according to the location of the data sources
(e.g. Nantes’ OGD source information is displayed
on the North-West side of the graph – corresponding
to the geographical location of Nantes in France; data
from Strasbourg is shown on the North-East side of
the graph, etc.).
4 CONCLUSIONS AND FURTHER
WORK
OD offers many benefits, potential applications and
services to society in general. However, it also has
some constraints, barriers and issues. OD Integration
OpenDataIntegration-VisualizationasanAsset
45
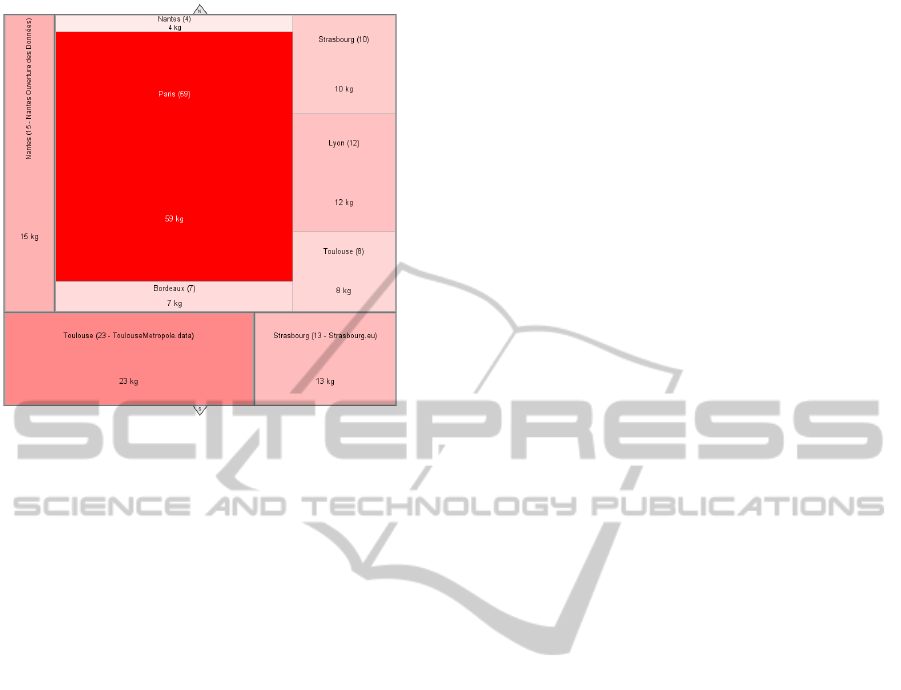
Figure 5: Geographical Weighted Map representing mu-
seum information.
may be a complex task to accomplish and the related
challenges and issues will continue to be an impor-
tant field of research. Besides the technical problems,
some entities - both in the private and public sectors –
continue to be reluctant to collaborate and share their
data.
Fortunately, more and more data is nevertheless
being published and is already available. Having
access to these massive quantities of information is
however not enough to realize the above-mentioned
potential. The quote of Gertrude Stein ”Everybody
gets so much information all day long that they lose
their common sense” fairly resumes the meaning of
having access to large amounts of information but be-
ing completely impotent to harness and use it because
of an incapacity to interpret and analyse it.
Governments, and private and public entities who
wish to open their data should do it in an organized
and previously agreed manner, furnishing datasets ac-
companied by metadata describing their content. Due
to the use of standards and the application of prin-
ciples to publish data over the web, Linked Open
Data may be a solution to open, share and reuse data
in distributed environments in an effective and cost-
efficient way, so that it can be made available and ac-
cessed by any kind of application.
But even then, for obvious reasons, OD will con-
tinue to be a rapidly-evolving and heterogeneous data
source. Thus, Information Visualization can be a
powerful tool for aiding the OD integration process.
Its methods and means may be used to provide mech-
anisms to analyse and process large datasets rapidly
and efficiently, in both internal and external integra-
tion, giving a visual overview of the dataset structure
and helping the user to understand its content, detect
possible errors in datasets and data incoherencies, and
show dataset metadata so it can be used for filtering,
etc.
Based on our current research, we intend to build
a Visualization platform to support complex OD inte-
gration, trying to make the whole process easier, more
effective, more intuitive and quicker. To reach this ob-
jective, the platform will use advanced and innovative
types of data representation, different kinds of graphs
and various data filtering systems - e.g. development
of the new FlowerDecisionGraph.
REFERENCES
Bauer, F. and Kaltenb
¨
ock, M. (2011). Linked open data:
The essentials. Edition mono/monochrom, Vienna.
Berlin.de (2014). Berlin open data. http://daten.berlin.de/.
Last accessed on Jan 03, 2014.
Bizer, C., Heath, T., and Berners-Lee, T. (2009). Linked
data-the story so far. International Journal on Seman-
tic Web and Information Systems (IJSWIS), 5(3):1–22.
Bountouri, L., Papatheodorou, C., Soulikias, V., and Stratis,
M. (2009). Metadata interoperability in public sec-
tor information. Journal of Information Science,
35(2):204–231.
Charalabidis, Y., Lampathaki, F., and Askounis, D. (2009).
Metadata sets for e-government resources: The ex-
tended e-government metadata schema (egms+). In
Electronic Government, pages 341–352. Springer.
Commission, E. (2014). The eu framework
programme for research and innovation.
http://ec.europa.eu/programmes/horizon2020/en.
Last accessed on Jan 03, 2014.
Communaut
´
eUrbaineduGrandToulouse (2011).
Toulousemetropole.data [donn
´
ees publiques].
http://data.grandtoulouse.fr/. Last accessed on Jan 23,
2014.
Corlosquet, S., Delbru, R., Clark, T., Polleres, A., and
Decker, S. (2009). Produce and consume linked data
with drupal! In The Semantic Web-ISWC 2009, pages
763–778. Springer.
Data.gov.uk (2014). Opening up government. http://
data.gov.uk/. Last accessed on Jan 03, 2014.
Davies, T. (2010). Open data, democracy and public sec-
tor reform. A look at open government data use from
data. gov. uk.
¨
Uber: http://practicalparticipation.
co. uk/odi/report/wp-content/uploads/2010/08/How-
is-open-governmentdata-being-used-in-practice. pdf.
Drupal (2011). Dkan. https://drupal.org/project/dkan. Last
accessed on Jan 03, 2014.
Duke, D. J., Brodlie, K. W., Duce, D. A., and Herman, I.
(2005). Do you see what i mean?[data visualization].
Computer Graphics and Applications, IEEE, 25(3):6–
9.
DATA2014-3rdInternationalConferenceonDataManagementTechnologiesandApplications
46

Edwards, P. N., Mayernik, M. S., Batcheller, A. L., Bowker,
G. C., and Borgman, C. L. (2011). Science friction:
Data, metadata, and collaboration. Social Studies of
Science, 41(5):667–690.
EuropeanCommission (2013). Ict 2014 - infor-
mation and communications technologies.
http://ec.europa.eu/research/participants/portal/deskto
p/en/opportunities/h2020/topics/87-ict-15-2014.html.
Last accessed on Feb 6, 2014.
EuropeanParliament (2003). Directive 2003/98/ec
of the european parliament and of the coun-
cil of 17 november 2003 on the re-use
of public sector information. http://eur-
lex.europa.eu/LexUriServ/LexUriServ.do?uri=OJ:L:2
003:345:0090:0096:EN:PDF. Last accessed on Jan
28, 2014.
Fox, P. and Hendler, J. (2011). Changing the equation
on scientific data visualization. Science(Washington),
331(6018):705–708.
GovernmentOfCanada (2011). Canada’s action plan
on open government. http://data.gc.ca/eng/canadas-
action-plan-open-government. Last accessed on Jan
28, 2014.
GovernmentOfSouthAustralia (2003). Gov-
ernment of south australia state records.
http://www.archives.sa.gov.au/foi. Last accessed
on Jan 28, 2014.
Gurstein, M. B. (2011). Open data: Empowering the em-
powered or effective data use for everyone? First
Monday, 16(2).
H
¨
ochtl, J. and Reichst
¨
adter, P. (2011). Linked open data-a
means for public sector information management. In
Electronic Government and the Information Systems
Perspective, pages 330–343. Springer.
Houssos, N., J
¨
org, B., and Matthews, B. (2012). A multi-
level metadata approach for a public sector informa-
tion data infrastructure. In Proceedings of the 11th
International Conference on Current Research Infor-
mation Systems.
Janssen, M., Charalabidis, Y., and Zuiderwijk, A. (2012).
Benefits, adoption barriers and myths of open data and
open government. Information Systems Management,
29(4):258–268.
Kalampokis, E., Hausenblas, M., and Tarabanis, K. (2011).
Combining social and government open data for par-
ticipatory decision-making. In Electronic participa-
tion, pages 36–47. Springer.
Lod2 (2014). Creating knowledge out of interlinked data.
http://lod2.eu/Welcome.html. Last accessed on Jan
03, 2014.
Maali, F., Cyganiak, R., and Peristeras, V. (2010). En-
abling interoperability of government data catalogues.
In Electronic Government, pages 339–350. Springer.
Martin, S., Foulonneau, M., Turki, S., and Ihadjadene, M.
(2013). Risk analysis to overcome barriers to open
data. Electronic Journal of e-Government, 11(2).
McCusker, J. P., Lebo, T., Chang, C., McGuinness, D. L.,
and da Silva, P. P. (2012). Parallel identities for man-
aging open government data. IEEE Intelligent Sys-
tems, 27(3):55.
Moreau, L., Groth, P., Miles, S., Vazquez-Salceda, J., Ibbot-
son, J., Jiang, S., Munroe, S., Rana, O., Schreiber, A.,
Tan, V., et al. (2008). The provenance of electronic
data. Communications of the ACM, 51(4):52–58.
NantesM
´
etropole (2011). Nantes ouverture des
donn
´
Ees - ouverture des donn
´
ees publiques.
http://data.nantes.fr/accueil/. Last accessed on
Jan 23, 2014.
NationalArchivesofAustralia (2010). Agls metadata stan-
dard. http://www.agls.gov.au/. Last accessed on Jul
07, 2014.
OpenKnowledgeFoundation (2014). The open source data
portal software. http://ckan.org/. Last accessed on Jan
03, 2014.
Otjacques, B., Cornil, M., and Feltz, F. (2009). Using el-
limaps to visualize business data in a local adminis-
tration. In Information Visualisation, 2009 13th Inter-
national Conference, pages 235–240. IEEE.
Publicdata (2014). Europe’s public data.
http://publicdata.eu/. Last accessed on Jan 03,
2014.
Rehm, G. and Uszkoreit, H. (2011). Multilingual eu-
rope: A challenge for language tech. MultiLingual,
22(3):5152.
RepubliqueFranc¸aise (2013). data.gouv.fr.
http://www.data.gouv.fr/. Last accessed on Feb
3, 2014.
Rivero, C. R., Schultz, A., Bizer, C., and Ruiz, D. (2012).
Benchmarking the performance of linked data transla-
tion systems. In LDOW.
Twc (2014). Linking open government data.
http://logd.tw.rpi.edu/. Last accessed on Jan 03,
2014.
UnitedStateDepartmentOfState (2010). Freedom of infor-
mation act. http://foia.state.gov/. Last accessed on
Jan 28, 2014.
Vander Sande, M., Portier, M., Mannens, E., and Van de
Walle, R. (2012). Challenges for open data usage:
Open derivatives and licensing. In Workshop on Using
Open Data.
VilleetCommunaut
´
eUrbainedeStrasbourg (2013).
Strasbourg.eu et communaut
´
e urbaine.
http://www.strasbourg.eu/fr. Last accessed on
Jan 23, 2014.
W3c (2014). Government linked data working group char-
ter. http://www.w3.org/2011/gld/charter. Last ac-
cessed on Jan 03, 2014.
Ziegler, P. and Dittrich, K. R. (2004). Three decades of data
integration-all problems solved? In IFIP congress
topical sessions, pages 3–12. Springer.
OpenDataIntegration-VisualizationasanAsset
47
