
Application of Bioelectrical Vector Analysis
in Professional Soccer Players
BIVA in Sport
Gabriele Mascherini, Andrea Cattozzo, Cristian Petri, Lorenzo Francini and Giorgio Galanti
Sports Medicine Department, University of Florence, largo Brambilla 3, Florence, Italy
Italian Football Athletic Trainers Association, via D’Annunzio, Florence, Italy
Keywords: Bio Impedance, Soccer, Sport Training, Vector Analysis.
Abstract: Soccer is a sport team with a discontinuous nature of physical effort and the duration of the regular season is
10 months length. Hydration status, water consumption are aspects of human performance debate in recent
years and it’s well demonstrated as a reduction of total body water impairs endurance ability. Bio
impedance is a useful methods to assess total body water, in addition recent studies reports a new approach
in the evaluation of hydration status independently from body weight. The aim of the study was to
determine changes of the bioelectrical impedance throughout a soccer season. Bioelectrical parameters of a
Italian professional football team were recorded eight time during a regular season. The detection were
carried out following the standard tetra polar method. Twenty-five male soccer players were submitted at
BIA measurement, but only eleven athletes took part in all eight sessions detection. The data recorded by
conventional BIA processing didn’t show any statistical differences in weight, hydration and cellular
masses. Bio Impedance Vector Analysis (BIVA) shows a high significance in Anova test for the values of
Xc (p<0.01) and PA (p<0.001), no difference in Rz among eight measurements. Body composition and
hydration status in footballers are generally well and the variations in conventional BIA are minimal.
Therefore BIVA in this population may give specific information for physiological changes for training
dues. A regular bio impedance assessment in athletes is desirable to follow adaptations to training loads.
1 INTRODUCTION
Many sports such as football, rugby and basketball
have a discontinuous nature of physical effort,
consisting in prolonged periods of exercise with
repeated intermittent high intensity bursts
interspersed with lower-intensity exercise: football is
a sport team and his sudden changes in intensity is
due to its intrinsic nature dictated by tactical and
technical reasons (Di Salvo V, 2008).
A regular season in professional Italian soccer
league during 10 months and the level of exercise
could induces muscle-tendon injuries, overuse
syndromes, over-reaching and even over-training
syndromes causing days of absence from the sport
(Bahr R., 2009; Kellmann M., 2010).
During matches and training, soccer players are
exposed to high physical stress (Bangsbo J, 2006),
which is suggested to influence body composition
and hydration status.
Hydration status, water consumption and the effects
of hypo hydration on aspects of human performance,
health and wellbeing have been the topic of much
public and scientific debate in recent years. The
effect of body water balance on aspects of exercise
performance has been extensively researched and in
recent years has been reviewed widely
(Cheuvront
SN, 2003; Coyle EF, 2004; Judelson DA, 2007)
.
C
orrect rehydration is sufficient to limit body mass
loss to 1.4%, prevents a reduction in soccer skill
performance (McGregor S, 1999) in comparison
with performance when body mass is reduced by
2.5%. Body water loss in human subjects results in
fluid losses from both the intracellular and
extracellular fluid compartments (Costill DL, 1976).
More recently, the influence of hydration status on
the movement patterns in football has been
investigated (Edwards AM,, 2007) using the ‘yo-yo’
intermittent recovery test (Krustrup P, 2003;
Bangsbo J, 2008): a reduction of 2.1% or 2.4% in
84
Mascherini G., Cattozzo A., Petri C., Francini L. and Galanti G..
Application of Bioelectrical Vector Analysis in Professional Soccer Players - BIVA in Sport.
DOI: 10.5220/0004995500840088
In Proceedings of the 2nd International Congress on Sports Sciences Research and Technology Support (icSPORTS-2014), pages 84-88
ISBN: 978-989-758-057-4
Copyright
c
2014 SCITEPRESS (Science and Technology Publications, Lda.)

body mass induced a reductions of 13% and 15%
respectively in ‘yo-yo’ test performance.
Bioelectrical impedance analysis (BIA) is a
property-based method of body composition
specifically detecting soft tissue hydration with a 2–
3% measurement error, which is comparable to
routine laboratory tests (Piccoli A, 2002).
Applications in sport have been primarily for
body composition analysis (Yannakoulia M, 2000),
and recently for assessment of nutritional status and
soft tissue composition in soccer players (Gatterer
H, 2011).
The aims of this study was collect bioelectrical
parameters in soccer players in order to check the
hydration status during an entire season.
2 METHODS
Twenty-five male soccer players were submitted to
BIA measurement during all regular season, but only
eleven athletes (age 22.4±1.8 years, height
181.3±7.7 m) took part in all eight sessions
detection. Absence were due to health reason
(including injuries), soccer players arrived during
the season and the goalkeepers are not included in
this study.
Design: Observational longitudinal prospective
study.
A professional football team taking part at Italian
fourth soccer division begins the season in July.
After having received oral consent to carry out the
evaluations, at the first training session (T1) were
performs anthropometrics and bioelectrical analysis.
Bioimpedance parameters for each players were
recorded in the morning, at rest condition, without
physical activity in the previous 12 h and following
the standard tetrapolar method (BIA 101 Sport
Edition, Akern, Florence, Italy). To detect any
difference in bioelectrical and hydration values of
lean body mass during the season bio impedance
analysis were done three weeks after the first
evaluation (T2) and then every forty days always in
Wednesday morning: total assessment were eight in
all season (T3-T8).
Body impedance is generated in soft tissues as an
opposition to the flow of an injected alternate
current and is measured from skin electrodes that are
placed on hand and foot (whole body analysis). The
resistance (Rz) is the opposition to the flow of an
injected alternating current, at any current
frequency, through intra and extracellular ionic
solutions, while reactance (Xc) is the dielectric or
capacitative component of cell membranes and
organelles, and tissue interfaces.
Data analysis were perform by software
Bodygram PRO 3.0 and detect with a convectional
analysis (BIA) and Vector analysis (BIVA).
Conventional BIA is based on electric models
supporting quantitative estimates of body
compartments through regression equations which
are not valid in individuals with altered hydration.
Bioelectrical impedance vector analysis (BIVA) is
based on patterns of the resistance-reactance graph
(Rz - Xc graph) relating body impedance to body
hydration without equations (Kyle UG, 2004). A
simple algorithm with few operational rules has been
derived for interpreting impedance vector position
and migration on the Rz - Xc graph at the bedside in
any clinical condition. Impedance (Z vector, ohm) is
represented with a point in the Rz - Xc plane which
is a combination of Rz and Xc. Vector normalization
by the subject’s height (Z/H, in Ω/m) controls for the
different conductor length (Codognotto M, 2008).
This new methods is mainly used in clinical
conditions, few studies are now present in literature
(Jaffrin MY, 2009).
Data from conventional analysis were:
free fat mass (FFM), fat mass (FM), total water
(TBW), extracellular water (ECW), intracellular
water (ICW), body cellular mass (BCM), extra
cellular mass (ECM).
For vector analysis the bioelectrical parameters
resistance, reactance and phase angle (PA) lead to
the development of resistance-reactance graph.
For each parameter recorded in the eight sessions
was performed statistical analysis with ANOVA
Test.
3 RESULTS
The data recorded by conventional BIA processing
were report in table 1and didn’t show any statistical
differences both in weight, hydration and cellular
masses.
Bio Impedance Vector Analysis shows a high
significance in Anova test for the values of Xc and
PA (table 2), but no difference in Rz among the
eight measurements.
Figures 1 shown the vector analysis of the eight
assessment during the regular season: sample group
it is positioned for whole regular season in athlete’s
area characterized by a state of lower general
hydration and a higher cellular mass respect the
general population.
The position of sample group in vector graph,
however, varies from July to May and it is possible
ApplicationofBioelectricalVectorAnalysisinProfessionalSoccerPlayers-BIVAinSport
85
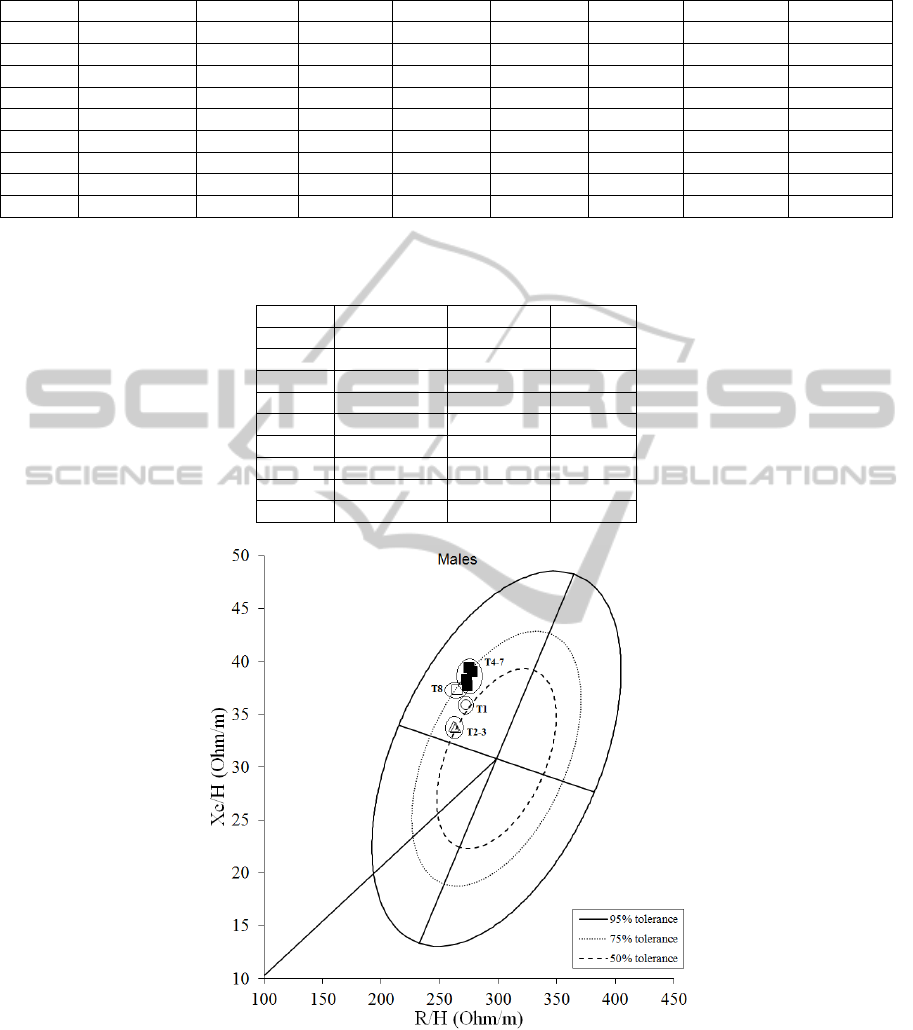
Table 1: Conventional BIA results.
Weight (kg) FFM (kg) FM (kg) TBW (L) ECW (L) ICW (L) BCM (kg) ECM (kg)
T1 74.9±6.4 62.2±5.9 12.7±2.4 45.5±4.3 18.0±2.0 27.5±3.0 37.6±3.5 24.5±2.9
T2 75.6±6.7 63.5±6.2 12.0±2.1 46.5±4.5 18.6±1.9 27.9±3.1 38.1±3.8 25.3±2.6
T3 75.0±6.6 63.0±6.1 12.0±2.1 46.1±4.5 18.5±2.0 27.6±31 37.7±3.7 25.2±2.8
T4 75.3±6.5 62.2±6.5 13.0±2.5 45.5±4.7 17.4±2.4 28.1±2.9 38.6±4.0 23.5±3.5
T5 76.4±6.5 62.1±6.1 14.2±2.2 45.5±4.4 17.6±2.2 27.9±3.0 38.3±3.5 23.8±3.1
T6 76.3±6.5 62.8±6.4 13.5±2.2 45.9±4.7 17.2±2.2 28.7±3.0 39.5±4.1 23.2±3.1
T7 76.1±6.2 62.1±5.9 13.9±2.0 45.5±4.3 17.4±2.2 28.0±2.8 38.5±3.6 23.6±3.2
T8 75.9±6.7 63.8±6.5 12.2±2.1 46.7±4.7 17.7±2.1 28.9±3.1 39.8±4.2 23.9±3.1
Anova NS NS NS NS NS NS NS NS
Legend: FFM = Free Fat Mass, FM = Fat Mass, TBW = Total Body Water, ECW = Extra Cellular Water, ICW = Intra Cellular Water.
Table 2 BIVA results.
Rz (ohm) Xc (ohm) PA (°)
T1 496.4±37.9 65.8±7.4 7.5±0.5
T2 481.1±36.6 62.5±5.0 7.4±0.3
T3 485.5±32.6 62.9±5.1 7.3±0.3
T4 498.0±44.3 70.0±10.3 8.0±0.8
T5 502.2±37.4 69.1±7.5 7.8±0.5
T6 494.0±42.2 71.3±9.0 8.2±0.7
T7 501.1±40.9 70.1±8.5 7.9±0.8
T8 479.9±38.5 68.0±7.9 8.0±0.6
Anova NS <0.01 <0.001
Figure 1: Bia Vector with res.istance-reactance graph of soccer players.
to identify four major groups T1, T2-T3, T4-T7, T8.
From the first detection (T1) is present in an initial
rehydration phase (T2-T3).
In T3-T7 vector analysis shows a loss of fluids with
slight increase in cell mass. Last assessment T8
shows an overall increase in body water.
4 DISCUSSION
The usefulness of body impedance measurement in
sports derives from an immediate availability as a
noninvasive, inexpensive and transportable test that
icSPORTS2014-InternationalCongressonSportSciencesResearchandTechnologySupport
86

transforms electrical properties of tissues into body
composition information (Kyle UG, 2004).
Acute changes in body mass over a short time
period can frequently be assumed to be a result of
body water loss or gain (Lentner C, 1981; Maughan
RJ, 2007) and therefore changes in body mass can
be used to quantify water gain or loss.
A regular season in professional soccer is 10
months length, during this time the footballers has in
average 250 training session and 45 official matches:
during this time numerous physiological changes
occurs. Footballers are in young age and the
parameters of body composition and hydration are
generally regular, therefore small variations in
conventional analysis (BIA) were reported.
Bio Impedance Vector Analysis (BIVA) in this
particular sports population may give specific
information for physiological changes for training
dues.
In July, at the first analysis (T1), players has a
good condition but a lower level of training, there
were considered the baseline of bioelectrical values.
In August (T2) and in September (T3) the
temperature and the training load were high: Rz, Xc
and PA reached the minimum values with statistical
differences for Xc and PA, we can assume a
redistribution of body water as a first response to
training loads.
Vector parameters from T4 to T7 are stabilized
and do not differ among themselves, during this
phase physical effort of athletes can be considered
stable.
In last evaluation (T8) the increase in body water
can be attributed to a decrease in training load by the
end of the official games.
In conclusion the shift of sample group within
the Rz - Xc graph during the eight assessments
shows how the body of athletes, through training,
initially (T2-T3) undergoes an increase and
redistribution of body water (in favor of the extra-
cellular compartment), then the cellular mass (lean
body mass) increase simultaneously with a reduction
in body water (T4-T8).
A regular Bio Impedance Analysis for
physiological assessment in athletes is advisable to
follow the adaptations to training loads. In particular
during the initial period of regular season when the
high level of physical effort is required: during this
period water loss through the sweat will be
prevented and replenished during and after the single
training sessions.
Also to be considered both the increase in the
summer period and the not change during the season
in total body water in order to plan the training.
Therefore medical and technical staff will have
information to avoid a possible occurrence of
overreaching or overtraining syndrome.
5 CONCLUSIONS
Conventional BIA analysis does not appear
sensitivity to detect athletes adaptations:
bioelectrical values as Resistance, Reactance, Phase
Angle and therefore a Bio Impedance Vector
Analysis (BIVA) is proved more sensitive to
physiological adaptation in sports subjects.
Future research is needed to determine which are
the most stressed muscle groups of the lower limb
from training in football
ACKNOWLEDGEMENTS
The authors did not receive any financial support for
doing this analysis and presenting it in this report.
REFERENCES
Bahr R, 2009. No injuries, but plenty of pain? On the
methodology for recording overuse symptoms in
sports. Br j Sports Med; 43:13 966-72
Bangsbo J, Mohr M, Krustrup P., 2006. Physical and
metabolic demands of training and match-play in the
elite football player. J Sports Sci;24:665-74.
Bangsbo J, Iaia FM, Krustrup P, 2008. The Yo-Yo
intermittent recovery test: a useful tool for evaluation
of physical performance in intermittent sports. Sports
Med; 38, 37–51.
Cheuvront SN, Carter R III & Sawka MN, 2003. Fluid
balance and endurance exercise performance. Curr
Sports Med Rep; 2, 202–208.
Codognotto M, Piazza M, Frigatti P, Piccoli A: Influence
of localized edema on whole body and segmental
bioelectrical impedance. Nutrition 2008;24:569–574.
Coyle EF, 2004. Fluid and fuel intake during exercise. J
Sports Sci; 22, 39–55.
Costill DL, Cote R & Fink W, 1976. Muscle water and
electrolytes following varied levels of dehydration in
man. J Appl Physiol; 40, 6–11.
Di Salvo V, Pigozzi F, 2008. Physical training of football
players based on their positional rules in the team.
Effects on performance-related factors. J Sports Med
Phys Fitness.;38(4):294-7.
Edwards AM, Mann ME, Marfell-Jones MJ et al., 2007.
The influence of moderate dehydration on soccer
performance: physiological responses to 45-min of
outdoors match-play and the immediate subsequent
ApplicationofBioelectricalVectorAnalysisinProfessionalSoccerPlayers-BIVAinSport
87

performance of sport-specific and mental
concentration tests. Br J Sports Med; 41, 385–391.
Gatterer H, Schenk K, Ferrari P, Faulhaber M, Schopp E,
Burtscher M., 2011. Changes in hydration status of
soccer players competing in the 2008 European
Championship. J Sports Med Phys Fitness;51(1):89-
94.
Jaffrin MY, 2009 Body composition determination by
bioimpedance: an update. Curr Opin Clin Nutr Metab
Care;12(5):482-6.
Judelson DA, Maresh CM, Anderson JM et al., 2007.
Hydration and muscular performance. Does fluid
balance affect strength, power and high-intensity
endurance? Sports Med; 37, 907–921.
Kellmann M., 2010. Preventing overtraining in athletes in
high-intensity sports and stress/recovery monitoring.
Scand J Med Sci Sports. 20 Suppl 2:95-102.
Krustrup P, Mohr M, Amstrup T et al., 2003. The yo-yo
intermittent recovery test: physiological response,
reliability, and validity. Med Sci Sports Exerc; 35,
697–705.
Kyle UG, Bosaeus I, De Lorenzo AD, Deurenberg P, et
al., 2004. Bioelectrical impedance analysis – part I:
review of principles and methods. Clin Nutr;23:1226–
1243.
Kyle UG, Bosaeus I, De Lorenzo AD, Deurenberg P, et
al., 2004. Bioelectrical impedance analysis – part II:
utilization in clinical practice. Clin Nutr;23:1430–
1453.
Lentner C 1981 Geigy Scientific Tables, 8th ed. Basle,
Switzerland: Ciba-Geigy Ltd.
Maughan RJ, Shirreffs SM & Leiper JB, 2007. Errors in
the estimation of hydration status from changes in
body mass. J Sports Sci; 25, 797–804.
McGregor S, Nicholas C, Lakomy H et al., 1999. The
influence of intermittent high-intensity shuttle running
and fluid ingestion on the performance of a soccer
skill. J Sports Sci; 17, 895–903.
Piccoli A, 2002. Patterns of bioelectrical impedance vector
analysis: learning from electrocardiography and
forgetting electric circuit models. Nutrition;18:520–
521.
Yannakoulia M, Keramopoulos A, Tsakalakos N, Matalas
AL, 2000. Body composition in dancers: the
bioelectrical impedance method. Med Sci Sports
Exerc. Jan;32(1):228-34.
icSPORTS2014-InternationalCongressonSportSciencesResearchandTechnologySupport
88
