
Individual Performance Optimization of Elite Cyclists
Luca Oggiano, Lars Sætran and Lars Morten Bardal
Norwegian University of Science and Technology, Department of Energy and Process Engineering
K. Hejes vei 2b 7042, Trondheim, Norway
Keywords: Aerodynamics, Biomechanics, Wind Tunnel Testing.
Abstract: The present work focuses on individual posture optimization with the aim to individually reduce the drag
and increase the power output on six elite cylists. In order to be able to quantify the changes in drag, power
output and VO2max, wind tunnel tests combined with power output and oxygen intake measurements were
carried out on each of the athletes tested. Drag measurements were performed in the large scale wind tunnel
at NTNU at a constant wind speed of 14.2m/s using a AMTI high frequency force plate. Simultaneously
with the drag measurements, the volume of oxygen intake and the power output generated by the athletes
during the test in different positions were acquired respectively with a Metamax II portable analyzer from
Cortex Biophysic and a Tacx Bushido cycling rig. The main results show that lowering the handlebar while
raising the seat in order to obtain a smaller frontal area and a straighter back, lowers the aerodynamic drag
but will possibly affect the volume of oxygen intake. The handlebar repositioning leaded to similar results
and it might then be questionable whether it is worth reducing the air resistance if the athlete does not sit as
comfortably. In most cases a lower handlebar positioning and a narrower set up of the handlebar resulted in
a considerable drag reduction without compromising the volume of oxygen intake. Being the present work a
preliminary test, no statistical results are presented but as an overall conclusion, it can be pointed out the
need to couple drag force measurements with oxygen intake and power production measurements in order to
have a clearer picture of the effectiveness of the wind tunnel testing.
1 INTRODUCTION
The aerodynamic drag is the main opposing force
that cyclists need to overcome with their generated
power and it counts as 90% ((De Groot et al., 1995,
Di Prampero, 2000, Oggiano et al., 2008)) of the
total forces acting against the athletes motion,
leading to the fact that even small reductions could
then lead to a large improvement in terms of
performances.
(Debraux et al., 2012) gives a clear overview of
the parameters that affect the drag on cyclists and on
the existing methods and theories used to measure it,
minimize it and reduce it, with particular focus on
frontal area direct and indirect measurements and on
frontal area reduction. In his review Debraux also
lists the different methods of assessment of
aerodynamic drag used by different authors dividing
them in wind tunnel tests, linear regression analysis
models, traction resistance measurement methods
and deceleration methods. The author also points at
pros and cons of each measuring method. However,
most methods and tests often focus only on drag (or
frontal area) reduction by modifying and adjusting
the athletes position on the bike, often discarding or
neglecting the side effects that a postural change
might induce in terms of biomechanical and
physiological effectiveness.
A number of authors (Atkinson et al., 2007,
Broker et al., 1999, Di Prampero, 2000, Heil et al.,
2001, Olds, 1998, Olds, 2001, Olds et al., 1995,
Padilla et al., 2000) on the other hand tried to create
mathematical models in order to be able to estimate
the power output generated by the athlete depending
on its posture and on the power required to
overcome the drag and the other resistive forces.
These models often use the posture as input,
modeling the frontal area and the drag and
successively assuming the needed power output.
The present study aims to individually optimize
cyclists performances by simultaneously measuring
oxygen intake, aerodynamic drag and power output
generated in a wind tunnel test. All the adjustments
on the cyclists posture were done keeping the
athletes posture within the parameters stated in the
UCI regulations (UCI, 2012).
79
Oggiano L., Sætran L. and Morten Bardal L..
Individual Performance Optimization of Elite Cyclists.
DOI: 10.5220/0004988700790083
In Proceedings of the 2nd International Congress on Sports Sciences Research and Technology Support (icSPORTS-2014), pages 79-83
ISBN: 978-989-758-057-4
Copyright
c
2014 SCITEPRESS (Science and Technology Publications, Lda.)
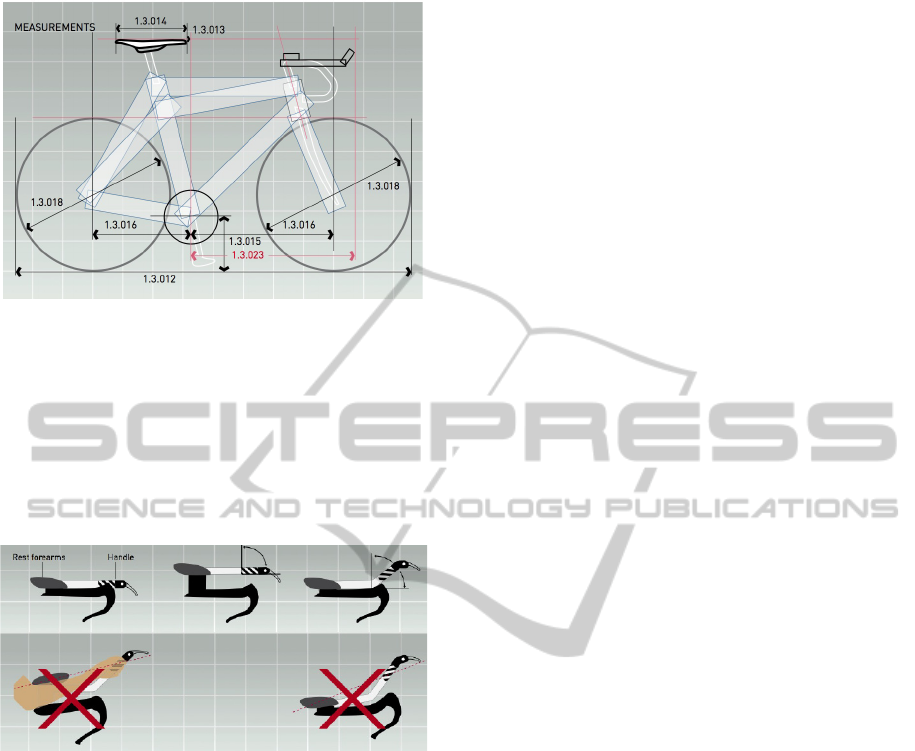
Figure 1: Bike measurements by UCI regulations (UCI,
2012).
The test was conducted in the large industrial
wind tunnel at NTNU in Trondheim. During the test,
six athletes from the Norwegian Cycling Federation
(NCF) were tested, of which five were from the
Under-23s and one from the Paralympics team.
Physiological data about the athletes were
previously collected.
Figure 2: Possible modifications to the handlebar by UCI
regulations (UCI, 2012).
2 EXPERIMENTAL SETUP
The large industrial wind tunnel at NTNU in
Trondheim was used for the test. The tunnel has a
test section which is 12.5 m long, 2.7 m wide and
1.8 m high, and it is able to reach a maximum wind
speed up to 30 m/s. During the test, the speed was
set at a constant value 14.2m/s. The test section is
equipped with an AMTI BM600400HF force plate
which is able to measure forces in 6 directions (3
forces and 3 moments on the 3 axes). The forces
were acquired using an in-house made Labview
program.
The power output generated by the cyclists
during the test was acquired with a fully wireless
Tacx Bushido trainer (REF). The Bushido trainer
was modified and welded to a steel plate and bolted
to the force balance. The front wheel was equipped
with an electric motor to add rotation at the correct
speed. The whole unit was under the wind tunnel
floor to avoid disturbances on the flow field.
The Volume of Oxygen intake (VO2max) was
measured using a Metamax II portable metabolic
analyzer 3.9 ( Cortex biophysics GmbH,Leipzig,
Germany ), previously evaluated by (Medbø et al.,
2008) The analyzer has built-in sensors to measure
O2 and CO2 , barometer and thermometer, and it
measures the flow of exhaled air using a turbine
flow meter placed in the breathing mask. The
instrument was calibrated against ambient air and
gas of known concentration of O2 (16%) and CO2
(4%) the morning before testing. The concentration
of O2 and CO2 in the room were measured before
each athlete started its respective session. The
analyzer was mounted under the wind tunnel floor to
avoid flow disturbances.
3 METHODS
Six athletes with different ages and body
characteristics were chosen for the test (table 1). The
test was carried out on the NTNU wind tunnel with a
constant wind speed of 14.2m/s. During the test,
5minutes samples at 1000Hz were acquired and the
mean values for V02max, Power Output generated
and drag force were acquired.
Being this test an individual test focused on
improving the posture of each of the athlete more
than in finding general conclusions, each athlete was
asked to assume their regular time trial posture and
their natural posture was successively modified
within the UCI rules trying to reduce the frontal area
and straighten their back without compromising the
comfort. Small adjustments were then individually
suggested for each athlete in order to be able to
reduce the drag and possibly increase the power
output and the VO2 intake. Only a limited number
of adjustments were tried for each athlete and they
were obtained adjusting the width and height of the
handlebar and the height of the seat.
The adjustments used were chosen for each
athlete basing the choice on a qualitative analysis of
the reference posture:
a) Vertical adjustment of the handlebar: lowering
the handlebar leads to a frontal area reduction
but it also leads to a lower efficiency due to a
more compressed posture. Raising the
handlebar has the opposite effect.
b) Horizontal adjustment of the seat: directly
influences the "seat tube angle" (STA). Larger
icSPORTS2014-InternationalCongressonSportSciencesResearchandTechnologySupport
80
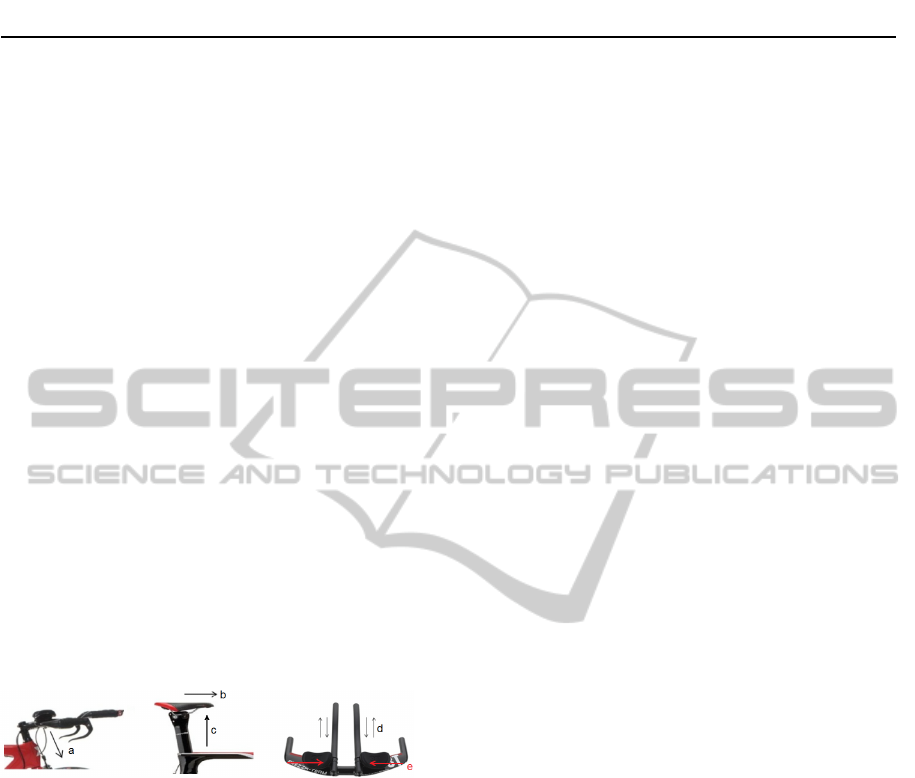
Table 1: Participants and adjustments.
Subject 1 Subject 2 Subject 3 Subject 4 Subject 5 Subject 6
Age 213823 21 2018
Weight [kg] 71 71 69 78 79 76
Height [cm] 185 179 185 183 194 193,5
Resting heart rate [bpm] 42 41-46 39 – 45 45
Maximum heart rate [bpm] 204 189 202 196 190 203
Adjustments
a
high a high a high a lower a low a high
b
forward b forward c high c low + a high e tight c high
c
high +
e
tight e tight e tight c low + b forward e wide
STAs have been proven to give an increase in
power outputs and a reduction in drag
(Ettema and Lorås, 2009).
c) Vertical adjustment of the seat: it directly
influences the back of the athletes. It is know
that a flatter back can help lower the drag, but
can provide lower efficiency.
d) Horizontal adjustment of the handlebar in the
longitudinal direction. It directly affects the
back posture of the cyclist. If the handlebar is
pushed forward, the shoulders are lower and
thus the frontal area can be reduced. Opposite
effects can be found when the handlebar is
adjusted in the opposite direction.
e) Horizontal adjustment of the handlebar in the
cross-flow direction (adjusting distance
between the brackets): increasing the distance
between the arms leads to lower drag.
Figure 3: Type of adjustments made to handlebar and
seat.
Not all the adjustments were used for the six
athletes but only individual adjustments based on
comfort response and qualitative analysis of the
reference posture were made (Table 1).
4 RESULTS
The adjustments are summarized in figure 4 where
the increase or decrease of drag, VO2max and
power generated are presented in percentage in a
columns plot.
Adjustment a - The vertical handlebar
adjustment was tested on all athletes, lowering or
raising it depending on the reference posture of the
participant. The results relative to this adjustment
seem to consistently prove that lowering the
handlebar results in lower drag while raising it
produces an increase in drag. At the same time,
lowering the handlebar increases the VO2
consumption while raising it leads to a lower VO2
consumption. The link between power output
generation and handlebar adjustment does not
show consistent results but it seems the adjustment
seems to differently affect each participant.
Adjustment b - Moving the seat forward
(adjustment b) did not affect the athletes drag but it
created a noticeable fall in VO2 consumption. A
large increase on power output was also noticed
for participant 1 while this didn’t happen for
participant 2. During the test it was however
noticed that participant 1 was more comfortable
and stable in holding this position than participant
2 and this might explain the difference.
Adjustment c - Raising the seat showed in
general induce a flatter back on the athletes,
making this change beneficial both in terms of
drag reduction but also in term of power
production. However, there is a maximum limit for
the seat high and some athletes already had their
seats set to the maximum. Raising the seat over
this limit leads to lower efficiency and lower
power production.
Adjustment d – Moving the handlebar forward
proved to have an effect on drag reduction and
power production. However, this adjustment was
performed only for participant 1 in combination
with the seat raising.
Adjustment e - Narrowing the handlebar leads
to narrower arms and generate a smaller frontal
area but this adjustment resulted to be somehow
less comfortable for the riders. No increase in
power production was noticed.
Some combinations of adjustments were also
performed following the athletes inputs and
resulted in large increases in power production and
IndividualPerformanceOptimizationofEliteCyclists
81
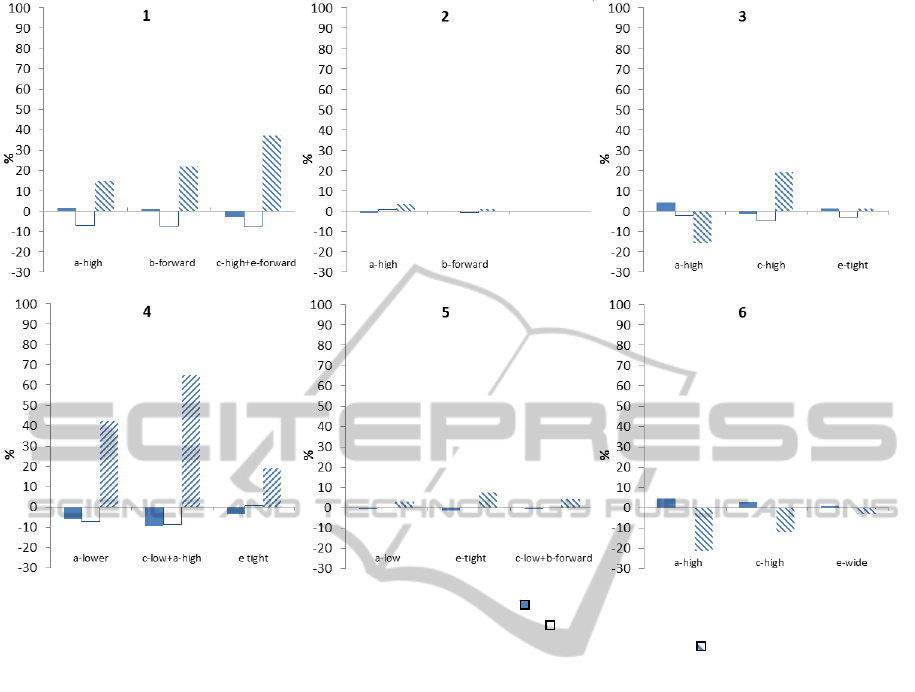
Figure 4: Individual results for the 6 participants. The first column ( solid blue filling) represents the drag change in
percentage with respect to the reference posture, the second column ( solid white filling) represents the change in
percentage of VO2 consumption with respect to the reference posture and the third column ( blue oblique lines filling)
represents the power output change in percentage with respect to the reference posture.
reductions in drag. The combination c_high+d_
forward for participant 1and the combination
c_low+a_high for participant 4 proved that in some
cases small individual adjustments are able to
dramatically improve the performances.
As an overall comment, all the athletes except
for participant 6 were able to reduce their VO2
consumption, increase their power output and
reduce their drag with small adjustments to their
reference position. If the drag reduction plays a
large role at higher speeds, the VO2 reduction has
a great impact on the riders performances at lower
speeds where the aerodynamic drag is negligible
and the riders can use less oxygen .
5 CONCLUSIONS
Six athletes were tested in the NTNU wind tunnel
laboratory and their performances were analyzed
measuring simultaneously the drag, the VO2
consumption and the power output generated.
It was impossible to complete a full matrix of
adjustments to the athletes’ positions but, even
with small adjustments, simultaneous gains in
terms of VO2 reduction, drag reduction and power
output increase were noticed.
The results show that individual adjustments
can lead to large improvements in terms of
performances and but they are too variable and too
individual to be able to draw general conclusions
thus a deeper analysis with a larger number of
participants should be carried out in order to be
able to generalize the results.
REFERENCES
Atkinson, G., Peacock, O. and Passfield, L. 2007.
Variable versus constant power strategies during
cycling time-trials: Prediction of time-savings using
an up-to-date mathematical model. Journal of Sports
Science, 25, 1001–1009.
Broker, J. P., Kyle, C. R. and Burke, E. R. 1999. Racing
cyclist power requirements in the 4000-m individual
and team pursuits. Medicine and Science in Sports
and Exercise, 31, 1677–1685.
icSPORTS2014-InternationalCongressonSportSciencesResearchandTechnologySupport
82

De Groot, G., Sargeant, A. and Geysel, J. 1995. Air
friction and rolling resistance during cycling.
Medicine and Science in Sports and Exercise, 27,
1090–1095.
Debraux, P., Grappe, F., Manolova, A. V. and Bertucci,
W. 2012. Aerodynamic drag in cycling: methods of
assessment. Sports Biomechanics, 10, 197–218.
Di Prampero, P. E. 2000. Cycling on earth, in space and
on the moon. European Journal Applied of
Physiology, 82, 345–360.
Ettema, G. and Lorås, H. W. 2009. Efficiency in cycling:
a review. European Journal Applied of Physiology,
106, 1–14.
Heil, D. P., Murphy, O. F., Mattingly, A. R. and
Higginson, B. K. 2001. Prediction of uphill time-trial
bicycling performance in humans with a scaling-
derived protocol. European Journal of Applied
Physiology, 85, 374–382.
Medbø, J. I., Mamen, A., Welde, B., Von Heimburg, E.
and Stokke, R. 2008. Examination of the metamax i
and ii oxygen analysers during exercise studies in
the laboratory. Scand J Clin Lab Invest, 597–604.
Oggiano, L., Sætran, L., Leirdal, S. and Ettema, G.
2008. Aerodynamic optimization and energy saving
of cycling postures for international elite level
cyclists. The Engineeeing of Sport 7., 597-604.
Olds, T. 1998. The mathematics of breaking away and
chasing in cycling. . European Journal of Applied
Physiology, 77, 492-497.
Olds, T. 2001. Modelling human locomotion. Sports
Medicine, 31, 497–509.
Olds, T. S., Norton, K. I., Lowe, E. L. A., Olive, S.,
Reay, F. and Ly, S. 1995. Modeling road-cycling
performance. Journal of Applied Physiology, 78,
1596-1611.
Padilla, S., Mujika, L., Angulo, F. and Goiriena, J. J.
2000. Scientific approach to the 1-h cycling world
record: A case study. Journal of Applied Physiology,
89, 1522–1527.
UCI 2012. UCI regulations.
IndividualPerformanceOptimizationofEliteCyclists
83
