
HS4MC
Hierarchical SLA-based Service Selection for Multi-Cloud Environments
Soodeh Farokhi
1
, Foued Jrad
2
, Ivona Brandic
1
and Achim Streit
2
1
Institute of Information Systems, Vienna University of Technology, Vienna, Austria
2
Steinbuch Centre for Computing, SCC Karlsruhe Institute of Technology, KIT Karlsruhe, Karlsruhe, Germany
Keywords:
Multi-Cloud, Service Level Agreement (SLA), Service Selection, Software-as-a-Service (SaaS),
Infrastructure-as-a-Service (IaaS), InterCloud-SLA.
Abstract:
Cloud computing popularity is growing rapidly and consequently the number of companies offering their
services in the form of Software-as-a-Service (SaaS) or Infrastructure-as-a-Service (IaaS) is increasing. The
diversity and usage benefits of IaaS offers are encouraging SaaS providers to lease resources from the Cloud
instead of operating their own data centers. However, the question remains for them how to, on the one hand,
exploit Cloud benefits to gain less maintenance overheads and on the other hand, maximize the satisfactions
of customers with a wide range of requirements. The complexity of addressing these issues prevent many
SaaS providers to benefit from the Cloud infrastructures. In this paper, we propose HS4MC approach for
automatic service selection by considering SLA claims of SaaS providers. The novelty of our approach lies
in the utilization of prospect theory for the service ranking that represents a natural choice for scoring of
comparable services due to the users preferences. The HS4MC approach first constructs a set of SLAs based
on the given accumulated SaaS provider requirements. Then, it selects a set of services that best fulfills the
SLAs. We evaluate our approach in a simulated environment by comparing it with a state-of-the-art utility-
based algorithm. The evaluation results show that our approach selects services that more effectively satisfy
the SLAs.
1 INTRODUCTION
Using various services from multiple Clouds to have
a wide range of choices with various cost and quality
of services (QoS) can be viewed as a natural evolu-
tion in Cloud computing. There are several reasons to
utilize multiple Clouds such as: improving the qual-
ity of service, while optimizing service cost; migrat-
ing among various providers; avoiding vendor lock-
in; and the need of particular Cloud services which are
not provided elsewhere. There are two types of deliv-
ery models for multiple Clouds: Federated Cloud and
Multi-Cloud (Petcu, 2013), which differ in the degree
of collaborations between the involved Clouds and the
way that the user interacts with them. In the Federated
model, there is a need for an agreement between the
various involved Cloud providers transparent for the
user. While in the Multi-Cloud model, which is the
focus of this paper, there is no need for such agree-
ment. In the latter, a user is aware of various Clouds,
and usually a third party is responsible to deal with
these variation in the service provisioning phase.
Software-as-as-Service (SaaS) providers, as po-
tential Cloud infrastructure service users, are being
encouraged to profit from hosting their offered soft-
ware service in the Cloud instead of establishing their
own data-centers. Therefore, SaaS providers are look-
ing into solutions that minimize their overall infras-
tructure leasing cost without adversely affecting the
customers (Wu et al., 2011). To achieve this goal, it
is essential to have a clear definition of user require-
ments and then provide a solution by which these re-
quirements are met. In the Cloud context, the ex-
act requirements (both functional and non-functional)
under which the services are or should be delivered
are specified in SLA. In addition, service delivery
systems are managed through the SLA management
process to meet the QoS objectives specified in the
SLA. In the SaaS provider scenario, it is necessary
to specify and manage SLAs in two layers: an SLA
between the SaaS customer and the SaaS provider
that reflects the QoS objectives of the offered services
to the customer, and an SLA between the SaaS and
the Infrastructure-as-a-Service (IaaS) provider, which
722
Farokhi S., Jrad F., Brandic I. and Streit A..
HS4MC - Hierarchical SLA-based Service Selection for Multi-Cloud Environments.
DOI: 10.5220/0004979707220734
In Proceedings of the 4th International Conference on Cloud Computing and Services Science (MultiCloud-2014), pages 722-734
ISBN: 978-989-758-019-2
Copyright
c
2014 SCITEPRESS (Science and Technology Publications, Lda.)

implicitly affects the customer satisfaction. Because
of the aforementioned advantages of Multi-Cloud and
the various QoS requirements of the SaaS providers,
they have begun to exploit this fertile environment.
There have been a number of studies exploring
service selection in the Cloud such as (Bellavista
et al., 2013), (Clark et al., 2013) and (Wu et al., 2013).
However, they have mostly focused on maximizing
the profit of either the customer or the IaaS providers
by proposing solutions in a single Cloud without thor-
oughly investigating SLAs. Thus, barriers relevant to
the service allocation for SaaS providers while man-
aging SLA issues in Multi-Cloud has not been stud-
ied well. As a recent investigation of SLA interoper-
ability issues in Multi-Cloud, an IEEE working group
called InterCloud Working Group (ICWG)
1
, has been
established recently to focus on developing a standard
for interCloud interoperability.
Since in Multi-Cloud dependent components of
a single SaaS application can be distributively de-
ployed in diverse Cloud infrastructures with various
QoS attributes, from the SaaS provider perspective,
the deployment can be considered as a Composite In-
frastructure Service with a set of functional and non-
functional requirements for each included application
component. As a result of service diversity in Multi-
Cloud, the selection of a set of suitable services is a
challenging task. The question remains how to, on
the one hand, score and select services for each sin-
gle component and on the other hand, optimize this
allocation to satisfy the requirements of the compos-
ite service. Moreover, these concerned QoS param-
eters can be conflicting or have differing importance
degrees for the SaaS provider.
Stimulated by these challenges, in this paper we
address the problems surrounding SLA management
and service selection for SaaS providers in Multi-
Cloud to assist them in fulfilling their objectives in
an effective way. We propose an SLA-based Multi-
Cloud service allocation approach that sits between
the SaaS and IaaS provider and includes two main
phases: (1) the SLA Construction and the (2) Service
Selection. In the first phase, the Composite Infrastruc-
ture Service of SaaS provider is broken down to a set
of functional and non-functional requirements called
sub-SLAs and a meta-SLA. Meta-SLA includes the
requirements of a more abstract level related to the
whole composite service, while sub-SLAs express re-
quirements of each infrastructure service included in
this composite service.
The first phase forms SLAs named InterCloud-
SLAs that are provider-independent. These SLAs in-
clude SaaS provider desired QoS requirements for the
1
http://grouper.ieee.org/groups/2302/
application deployment on the Cloud. The focus of
this paper is the second phase which uses an algorithm
to score services based on the user satisfaction. As the
user satisfaction has been a subject of great interest
to Cloud providers, the principle of prospect theory
(Kahneman and Tversky, 1979) is used in the scoring
and selection algorithm to model the user satisfaction
as a function of quality aspect of service and the im-
portance of each parameter for the user. This theory
is an alternative descriptive model of decision making
under risk for utility theory and is said to be more re-
alistic in calculating the user satisfaction. Based on
this theory the changes in specific quality aspects of
a service is sensed more by users who have assigned
higher weights to these aspects. Namely, satisfaction
is subjective and may be different for different users
even for the exact same service with the same quality
aspects. To the best of our knowledge, this is the first
application of prospect theory in the Cloud service se-
lection problem.
As prospect theory is an alternative model for util-
ity theory, we evaluate our work by comparing the re-
sult with a utility-based matching algorithm using a
real-world SaaS provider scenario based on a simula-
tion environment. As it will be presented later in the
paper, the evaluation result shows the flexibility and
effectiveness of our selection algorithm as well as jus-
tification of our SLA specification in a Multi-Cloud.
The remainder of this paper is organized as fol-
lows. In Section 2 we discuss the related work. Sec-
tion 3 presents an overview of HS4MC approach and
outlines its main phases, while Section 4 focuses on
the selection algorithm and SLA specification by con-
sidering a concrete example. Section 5 is dedicated to
the evaluation of our approach, and finally, in Section
6 we conclude the paper and express the directions of
our future work.
2 RELATED WORK
The issues of SLA-based service selection has been
widely investigated in both web service domain and
Cloud computing in recent years. In this section we
explore approaches dealing with this issue. An ex-
tensive comparison of existing approaches working
on service selection for composite Web services is
given in (Moghaddam and Davis, 2014). In web ser-
vice domain, the author of (Yau and Yin, 2011) pro-
poses a web service QoS-based ranking and selection
approach. Their approach calculates the satisfaction
score of the user for each QoS parameter based on
the basis of prospect theory and then aggregates the
scores in order to select the service with the highest
HS4MC-HierarchicalSLA-basedServiceSelectionforMulti-CloudEnvironments
723
HS4MC Approach
Multi-Cloud
SLA
SLA
SLA
SLA
SLA
SLA
SLA
SLA
Sub
SLA
sub
SLA
sub
SLA
SLA
SLA
Middleware Layer
customer customer
SaaS provider
SLA
SLA
SaaS Provider Layer
Customer Layer
IaaS provider Layer
SLA SLA
SLA Technical details
SLA Abstraction
meta
SLA
Systematic perspective SLA hierarchy perspective
Customer SLA
SaaS Provider SLA
InterCloud SLAs
IaaS provider SLA
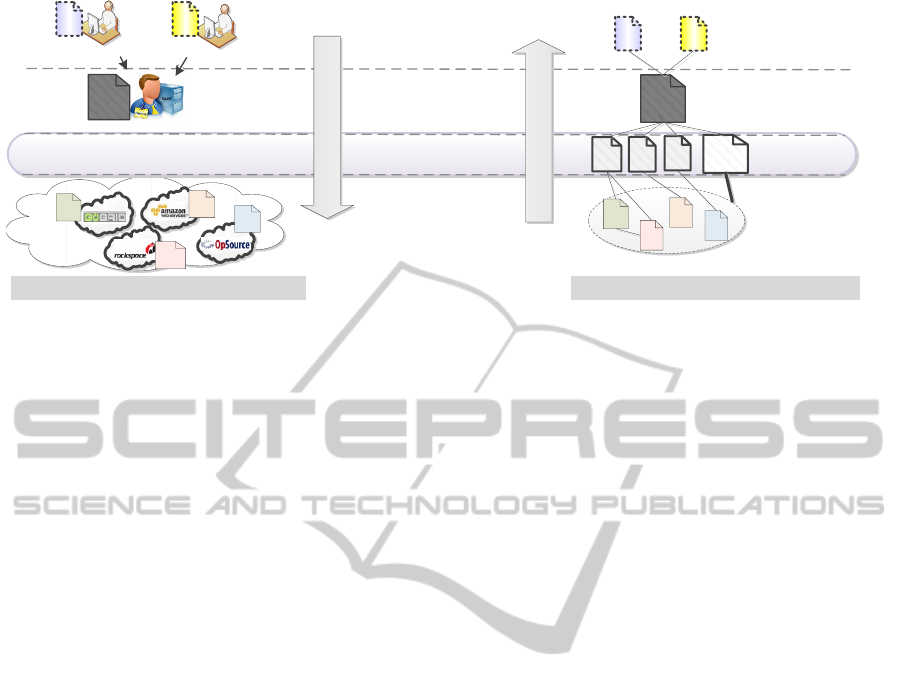
Figure 1: SLA hierarchy and service diversity in Multi-Cloud.
aggregated score. Their approach has some signifi-
cant advantages over existing work, such as selecting
the service that best satisfies QoS requirements con-
cerning by the user, instead of the service with the best
QoS, which may lead to over-qualification and can
improve utilization of services. Moreover, by using
prospect theory, they modeled the relation between
service QoS parameters and the user satisfaction more
precisely. However, in their work, they only focus on
a single service selection. In our work, we also use the
principle of prospect theory to rank both single Cloud
services as well as composite Cloud services.
For the service selection in Multi-Cloud, a
methodology is needed to compare Cloud services
based on the various criteria such as the cost and QoS
parameters for different user profiles (Petcu, 2013).
In addition, because of the SLA heterogeneity in this
environment, SLA management from both customer
and provider perspectives is challenging.
Most of the works that focus on the SLA-based
service selection and allocation in Clouds are focused
only on maximizing the customer profit (Dastjerdi,
2013) and (Clark et al., 2013) or IaaS provider profit
(Lee et al., 2010). The work in (Wu et al., 2011) is
one of the first dealing with resource allocation from
the SaaS provider perspective. This work was also
enhanced to support both customer and SaaS provider
profits in (Wu et al., 2013). The authors propose an al-
location strategy for SaaS providers to maximize their
profit and customer satisfaction level when deploy-
ing their applications in Cloud infrastructure services.
Their approach also supports the dynamic changing
of customer requests with the goal to minimize the
number of used VMs. However, in their SLA, they
consider just response time and service initiation time
as service selection parameters for SaaS provider. In
addition, their evaluation is performed in one Cloud
with a single requested VM per Service.
Similar works have investigated service alloca-
tion in the Cloud (Son et al., 2013) and our previ-
ous work (Emeakaroha et al., 2011) by providing an
SLA-driven resource allocation scheme that selects
a proper data center among globally distributed cen-
ters operated by a provider. In contrast, we support
composite Multi-Cloud services where the SLA of the
component services can even be conflicting, by sup-
porting more parameters such as availability, latency,
reputation, throughput and cost.
The concept of sub-SLA and meta-SLA were first
mentioned in (Ouelhadj et al., 2005) in Grid comput-
ing domain. The authors use these concepts to sched-
ule jobs in Grids by utilizing a multi-agent system and
an SLA negotiation protocol. Our usage of these con-
cepts on Multi-Cloud significantly differs from this
one due to the differences between Grid and Cloud
business models.
Compared to the previous works, we propose an
approach to assist SaaS providers to select the most
suitable Cloud infrastructure services while handling
the SLA hierarchy and heterogeneity (in abstraction
and technical details) and variety of services in Multi-
Cloud. Our goal is to maximize the SaaS provider
profit by maximizing its SLA satisfaction level, which
we believe can be achieved by applying prospect the-
ory in the computation of user satisfaction
3 HS4MC APPROACH
The systematic perspective of Figure 1 represents
the position of HS4MC approach. It lies between
the SaaS and IaaS provider layers and handling the
SLA heterogeneity and service selection. HS4MC
proposes the concept of sub-SLA and meta-SLA as
InterCloud-SLAs to be able to cover the requirements
of the SaaS provider for the Composite Infrastructure
CLOSER2014-4thInternationalConferenceonCloudComputingandServicesScience
724
SLA
Repository
IaaS offers
Repository
SaaS provider Requirements
2
sub
sla
SLA Construction Engine
Meta-SLA
Sub-SLA
Service Selection Engine
Service Ranker
Composite
Service Ranker
InterCloud
SLA
sla
sla
sla
sla
Composite
Cloud Service
Phase 1
Phase 2
input
output
output
input
Input & output of phase 1
Input & output of phase 2
Meta
SLA
SaaS Component
sub
sla
sub
sla
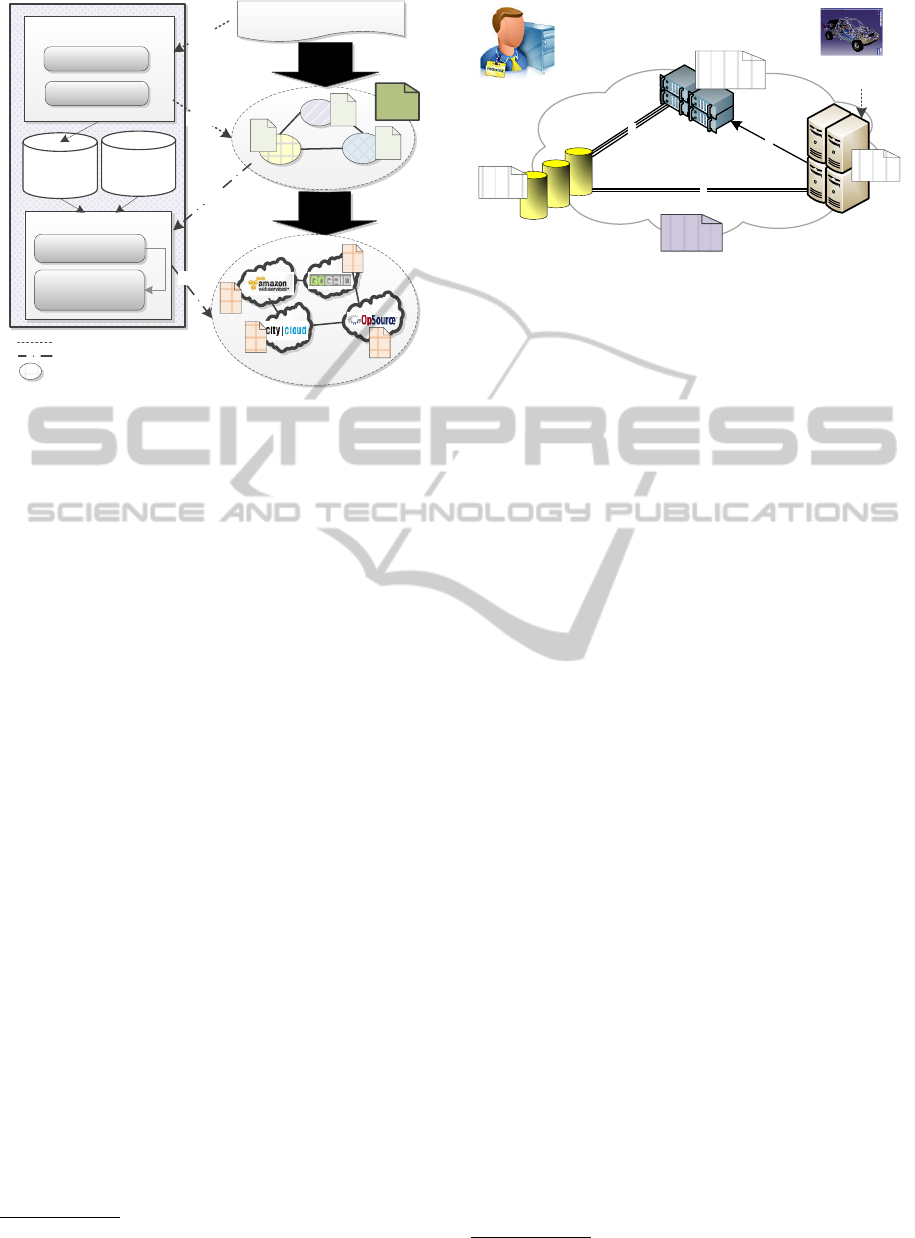
Figure 2: HS4MC architecture and phases.
Service as well as each included service. In HS4MC
approach, we focus on the SLA between a SaaS and
an IaaS provider which includes both functional and
non-functional parameters. Each non-functional pa-
rameter in an SLA can be considered as hard or soft.
Hard parameters must be satisfied, e.g the infrastruc-
ture cost must be less than a specific amount, while
satisfaction of soft parameters is not mandatory but
preferred, e.g response time is preferred to be less
than 5s. By SLA satisfaction, we mean providing
functional and hard non-functional parameters as well
as trying to find the most suitable services for the soft
ones.
In HS4MC there are two phases: SLA Construc-
tion and Service Selection, which are described in this
section. Figure 2 depicts the HS4MC architecture and
the included phases along with the input and output of
each phase.
SLA Construction Phase. As the input of this
phase, the SaaS provider submits its Cloud infras-
tructure requirements to the SLA Construction Engine
as a single XML file. These requirements contain
two abstract parts: one including the requirements
for each infrastructure component (Cloud virtual ma-
chine (VM) or storage), and the other enfolding the
requirements of the whole set of requested infrastruc-
tures. The SLA Construction Engine extracts the data
related to these two parts and constructs a set of sub-
SLAs as well as a meta-SLA by utilizing an SLA on-
tology. The main purpose of constructing such SLAs,
named InterCloud-SLA
2
is to address the SLA inter-
operability issue in Multi-Cloud. Figure 1 presents
this process by considering the SLA hierarchy per-
2
Inspired by a sub-group of aforementioned IEEE Inter-
cloud Working Group (ICWG), named InterCloud-SLA.
CAD-aaS
Customer
meta-SLA
SaaS Provider
1
CAD-aaS Standard Edition
(
connectivity
=
1
)
(
connectivity
=
3
)
(connectivity =2)
4
CAD Application UI
(1 Small Cloud-VM)
sub-SLA
(UI)
3
CAD Models
(100 GB Cloud-Storage in Europe)
sub- SLA
(Storage)
2
GPU
(1 Large Cloud-VM)
sub- SLA
(Computation)
Figure 3: Composite infrastructure service for a CAD-aaS
standard edition.
spective.
Namely, the SLA Construction Engine needs some
sort of data-connection and reasoning ability in or-
der to break down the SaaS requirements in a way
that they can be mapped to the current service offers.
Moreover, it should be able to combine current offers
in order to provide new value-added services for the
user requirements. The further steps of this phase on
SLA extraction are according to our previous work
(Breskovic et al., 2013) and (Redl et al., 2012).
Service Selection Phase. The InterCloud-SLAs
and the IaaS providers’ offers are two inputs of this
phase, as shown in Figure 2. The Service Ranker
component is responsible for creating a ranking list
of services for each sub-SLA, which are then used by
the Composite Service Ranker component to score the
combinations of services for the meta-SLA. The out-
put of this phase is a Composite Cloud Service, which
has the best satisfaction score among the other candi-
dates. Before describing the details of this phase in
the following section, we present a concrete example
to provide the intuition of our approach.
3.1 Example Scenario
As a running example, a CAD
3
software provider
aims to deploy its CAD software in Cloud and offers
it as a public Cloud SaaS, called CAD-as-a-Service
(CAD-aaS), in three software editions: enterprise,
professional and standard. Each edition has a specific
set of requirements. The CAD-aaS provider wants
to deploy the various components of its CAD ser-
vice, presented in Figure 3 in Cloud, so it request
several Cloud infrastructure services: one small VM
for the application user interface (UI), one large VM
with GPU features for the computation component
and 100GB of storage to store the CAD models. Each
requested service has a sub-SLA. Non-functional pa-
rameters related to the whole CAD composite ser-
3
Computer-Aided Design
HS4MC-HierarchicalSLA-basedServiceSelectionforMulti-CloudEnvironments
725

vice form the meta-SLA. The edge numbers repre-
sent the execution sequence of the CAD-aaS. The
components communicate with each other based on
the CAD software application topology. The degree
of data communications between components are de-
picted as connectivity value for each edge and it will
be described later. The rationale behind choosing this
example is that deploying CAD applications in the
Cloud has been investigated widely; for example it
is used in the Cloudflow project
4
which has the aim
to make the Cloud infrastructures a practical solution
for manufacturing by automatic provisioning of SaaS
applications over Cloud infrastructure services.
4 SERVICE SELECTION PHASE
The cornerstone of the Service Selection Phase is a
selection algorithm that works based on prospect the-
ory to compute the user satisfaction score for a certain
service. This theory is proper for describing user de-
cisions among various choices with uncertainty, and
considers human behavior in computation of the user
satisfaction. We adopted the idea of the algorithm
presented in (Yau and Yin, 2011) and developed it to
support service selection for a Cloud composite ser-
vice, and to cover all functional and non-functional
parameters of InterCloud-SLAs. In this section, we
first introduce the SLA specification used in the Ser-
vice Selection Phase, then we elaborate the steps of
the selection algorithm.
4.1 SLA Specification
A set of m infrastructure services can be defined as
follows where F
i
is the functional parameter of service
S
i
and NF
i
is its non-functional parameter.
Service O f f ers = {S
1
,··· , S
m
},
S
i
= {F
i
, NF
i
} 1 ≤ i ≤ m (1)
The InterCloud-SLA contains a set of n sub-SLAs and
one meta-SLA and is defined by
InterCloud SLA =
{{subSLA
1
,··· , subSLA
n
}, metaSLA} (2)
where each subSLA
j
and metaSLA includes a set of
functional parameters F and non-functional parame-
ters NF as follows:
subSLA
j
= {F
j
, NF
j
} 1 ≤ j ≤ n (3)
metaSLA = {F, NF} (4)
4
http://eu-cloudflow.eu/project/concept.html
Non-functional parameters of subSLA or metaSLA,
NF
k
are represented as tuple
NF
k
= {Min
k
, Max
k
, W
k
, T
k
} 1 ≤ k ≤ l (5)
where Min
k
and Max
k
determine the accepted bound-
aries for parameter k. W
k
represents the user prefer-
ence on parameter k in the service selection, and it is
valued within (0, 1]. A larger W
k
shows that parameter
k is more important for the user, so this parameter will
have more impact on the service ranking. T
k
specifies
the type of parameter k, which can be hard or soft.
In the selection algorithm, non-functional parameters
are treated in the same way as functional parameters.
If the user specifies no value for each of the in-
troduced factors, the default values are assigned, T
k
=
so f t and W
k
= 0.5 that show the medium importance
of parameter k. Moreover, for Min
k
and Max
k
, the
default values are defined as the smallest and largest
values for parameter k within a corresponding set of
Service O f f ers. For example, if k = availability,
then Min
k
= 90% and Max
k
= 100% can be assigned
as the default values.
The last part in our modeling is a graph which de-
scribes the degree of connectivity among sub-SLAs (a
number between 1 to 3, larger means higher connec-
tivity). In this graph, the nodes present the sub-SLAs
and the edge shows to which degree these two cor-
responding components are going to transfer data at
runtime, which influence the traffic cost and latency
of the composite deployment. As depicted in Fig-
ure 3, the connectivity value for each edge shows the
amount of data transfer between the involved nodes.
For example, the computation node transfers the high-
est amount of data with the storage node, among other
edges in the CAD-aaS graph.
4.2 Service Selection Algorithm
The selection algorithm, as depicted in the following
pseudo code, can be described in six steps.
Step (1) A set of services that satisfies the func-
tional and hard non-functional parameters is chosen
for each sub-SLA (line 4-5). We assume that the fil-
tered list in not empty at this step, indeed the negoti-
ation with the user in case that no service is found for
the given requirements can be considered as a future
work.
Step (2) Due to the variety of differing non-
functional parameters in metrics and scales for a given
service set, they are needed to be normalized before
being used in service ranking. In Equation (6), we
normalize service quality parameters in such a way
that the higher value always means better. This equa-
tion calculates the normalized result, N
ik
, for values
CLOSER2014-4thInternationalConferenceonCloudComputingandServicesScience
726

Norm(NF
ik
) = N
ik
=
NF
ik
− Min
jk
Max
jk
− Min
jk
i f larger NF
ik
is desirable
Max
jk
− NF
ik
Max
jk
− Min
jk
i f smaller NF
ik
is desirable
(6)
between the accepted boundaries, Min and Max. For
values which are better than accepted boundaries, the
result is 1 and for the worse values the result would be
0. For parameters like availability where larger value
is desirable, we use the first case, and for parameters
like cost, where minimization is the goal, the second
case is used for the normalization (line 6-8).
Listing 1: Pseudo-code of the selection algorithm.
1 Input: S e r v i c e O f f e r L i s t , subS L A L ist , m e t a S L A
2 Output : S e l e c t e d C o m po site S e r v i c e
3
4 for each s u b S L A in s u b S L A L i s t
5 Fil t e r S e r v i ce Of ferL i s t by F a nd Hard - NF
6 for each NF
i
of S
i
in S e r v i c e Of fe rL ist
7 for each NF
j
in subSLA
j
8 Normali z e Va l u e NF
ik
by N o rm (NF
ik
)
9 Com p u t e s a t i s f ac t io n s c ore N
ik
by S SF (N
ik
)
10 endfor
11 Comput e F i na lSa t i s f a cti o n S c or e S
i
by CF (S
i
)
12 endfor
13 endfor
14 S t ore a ll C o m bi n at i on s of se r v i c e s of S erv i ce -
15 O f f e r L i s t in Co mpo s i t i on Ser v i c e L ist
16 for each Co m p o si t i on in C omp o s i t io nSe r v i c e Lis t
17 for each N F in m e t a S L A
18 Comput e A g g r egat e d V a l u e
19 endfor
20 endfor
21 F i l t e r Co m p o s it ion S e r v i ceL i s t by F a nd Hard - NF
22 for each Co m p o si t i on in C omp o s i t io nSe r v i c e Lis t
23 for each N F in m e t a S L A
24 Normali z e Ag g r e g a t e dVal u e of NF by Nor m ( NF )
25 Comp u t e s a t i s f ac t io n s c ore C om p os i t io n
26 by S SF ( N)
27 endfor
28 // based on included services and subSLAs
29 Compute a v e r a g e Fi n a l S at osf a c t i on Sco r e
30 // based on subSLAs and metaSLA
31 Compute F i na lCo m p o s i tio n S c o r e by Score
f inal
32 // based on calculated FinalCompositionScore
33 So r t Com p o s i tio n S e r v ice L i s t
34 endfor
35 return S e l e c t e d C o m po si teSe r v i c e
Step (3) Let N
ik
be the normalized value of NF
ik
of
service S
i
, the Satisfaction Scoring Function SSF can
be defined as Equation (7). This formula computes
the user satisfaction score of the normalized value N
ik
of each non-functional parameter in S
i
based on the
W
j
in subSLA
j
(line 6-10).
SSF(N
ik
) =
0.5(2N
ik
− 1)
1−W
jk
+ 0.5 N
ik
>0.5
−0.5(−2N
ik
+ 1)
1−W
jk
+ 0.5 N
ik
≤0.5
(7)
The rationale behind the SSF is based on prospect
theory. This theory implies that changes in a specific
quality aspects of a service is sensed more by users
who have assigned higher weights to those quality pa-
rameters. Indeed, the satisfaction of user for a ser-
vice is based on the gains and losses relative to the
reference point (normalized value of 0.5) instead of
absolutely determined by the normalized QoS param-
eters of that service. Moreover, satisfaction is influ-
enced by the importance weight of user assigned to a
specific quality parameter. According to this theory,
the satisfaction function should be concave for gains,
and convex for losses. To clarify the behavior of the
SSF, we present the graphs in Figure 4. Each curve
shows the behavior of SSF based on different weights
for various non-functional parameters supported ei-
ther in sub-SLA or meta-SLA. For example, in the
second diagram which the accepted boundaries are
99.5% as minimum and 100% as maximum, then the
normalized value of 0.4 (value=99.7%) has different
satisfaction scores for standard, professional and en-
terprise users based on their specified weights. Other
diagrams also show the influence of weights in SSF
for differing non-functional parameters. The weights
can also be different based on the goal of the user for
a service. For example, the first diagram shows vary-
ing weights of a user for response-time of different
infrastructure services. As depicted response-time for
VM which is dedicated to UI
5
is more important for
user (higher weight) than VM for computation.
Step (4) Until now, we have calculated the satis-
faction score for each NF
i
of service Si, so we have a
satisfaction score set {SC
i1
,· ·· ,SC
ik
,··· ,SC
il
} calcu-
lated based on the {NF
j1
,· ·· ,NF
jk
·· · ,NF
jl
}. At this
point, it is needed to compute the final satisfaction
score of each service by the following Combination
Function CF (line 11)
CF(S
i
,subSLA
j
) =
∑
l
k=1
SC
ik
.W
jk
∑
l
k=1
W
jk
(8)
Step (5) The previous steps (line 4-13) are exe-
cuted on the sub-SLA level, while from this step on,
5
User Interface
HS4MC-HierarchicalSLA-basedServiceSelectionforMulti-CloudEnvironments
727
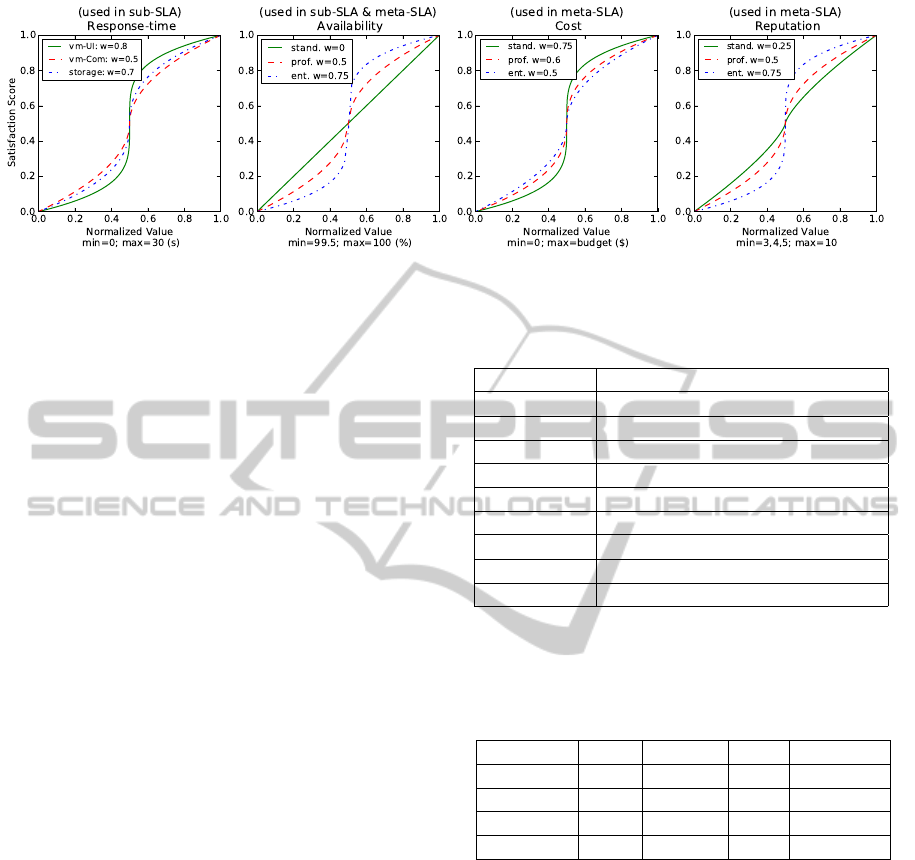
Figure 4: The effect of weighting and min-max boundaries in satisfaction score for parameters of sub-SLA and meta-SLA.
the meta-SLA will be processed. First, for all possi-
ble combinations of selected services corresponding
to each subSLA, the aggregated non-functional val-
ues are calculated by using their correlated aggregated
functions, defined in Table 3 (line 14-20). Then, the
algorithm follows the same steps (1 to 4) by consider-
ing the aggregated values, meta-SLA and the possible
service combinations, named Composition (line 21-
26).
Step (6) For the final selection, the algorithm con-
siders the influence of both sub-SLAs and meta-SLA.
To this aim, the average FinalSatis f actionScores
of services included in the Composition (line 27-
28) is computed. Then, by the Equation (9)
in which W
metaSLA
is the importance weight of
meta-SLA and W
subSLA
the weight of sub-SLA, the
FinalCompositionScore is calculated for the final se-
lection (line 29-30).
Score
f inal
= W
metaSLA
.Score
agg
+W
subSLA
.Score
ave
(9)
The first ranked CompositeService would be the out-
put of Selection Algorithm (line 31-34). The top
ranked composite service is the one with the largest
satisfaction score which means that the service QoS
can best satisfy the user requirements. Hence, in the
proposed algorithm the services whose QoS parame-
ters are not the best in comparison with other services
can still be ranked on the top as long as they perfectly
satisfy the user QoS requirements. This is beneficial
in improving utilization of services, and also saving
the resources to satisfy other users.
5 EVALUATION
In this section, we evaluate the proposed algorithm
using the scenario described in Section 3.1 in com-
parison with a state-of-the-art utility-based matching
algorithm (Jrad et al., 2013). For this purpose, we im-
plemented both algorithms in Java language and then
Table 1: Functional and non-functional parameters of sim-
ulated IaaS providers (S=Small, M=Medium, L=Large).
Parameters Definition (unit/range)
IaaS
Type
V M
S/M/L
, Storage
Location data-center region (1−4)
Reputation provider reputation rank (1−10)
Availability up-time of service (%/3 Month)
ResTime time to fully receive an answer (s)
T hroughput download a few large files (Mb/s)
Cost
V M
lease V M
S/M/L
($/hour)
Cost
Storage
store ($/GB/Month)
Cost
Tra f f ic
download ($/GB/Month)
conducted a set of simulations. The experimental re-
sult will be presented in this section.
Table 2: Latency matrix (ms).
USA Europe Asia Australia
USA 25 150 250 100
Europe 150 25 150 200
Asia 250 150 25 500
Australia 100 200 500 25
5.1 Simulation Setup
In order to model heterogeneous infrastructure ser-
vices in a Multi-Cloud environment, we simulate 12
commercial IaaS providers, each with one or more
data centers distributed along different geographical
locations (four continents). In our simulation envi-
ronment, each provider has a set of functional and
non-functional parameters as well as pricing models,
as depicted in Table 1. Each provider either provides
Cloud storage or Cloud VMs presented in three sizes:
small, medium, and large. The VM budget is given
based on the computation units. one, two and four
computation units are respectively assigned to small,
medium and large VM sizes. We assume that compu-
CLOSER2014-4thInternationalConferenceonCloudComputingandServicesScience
728
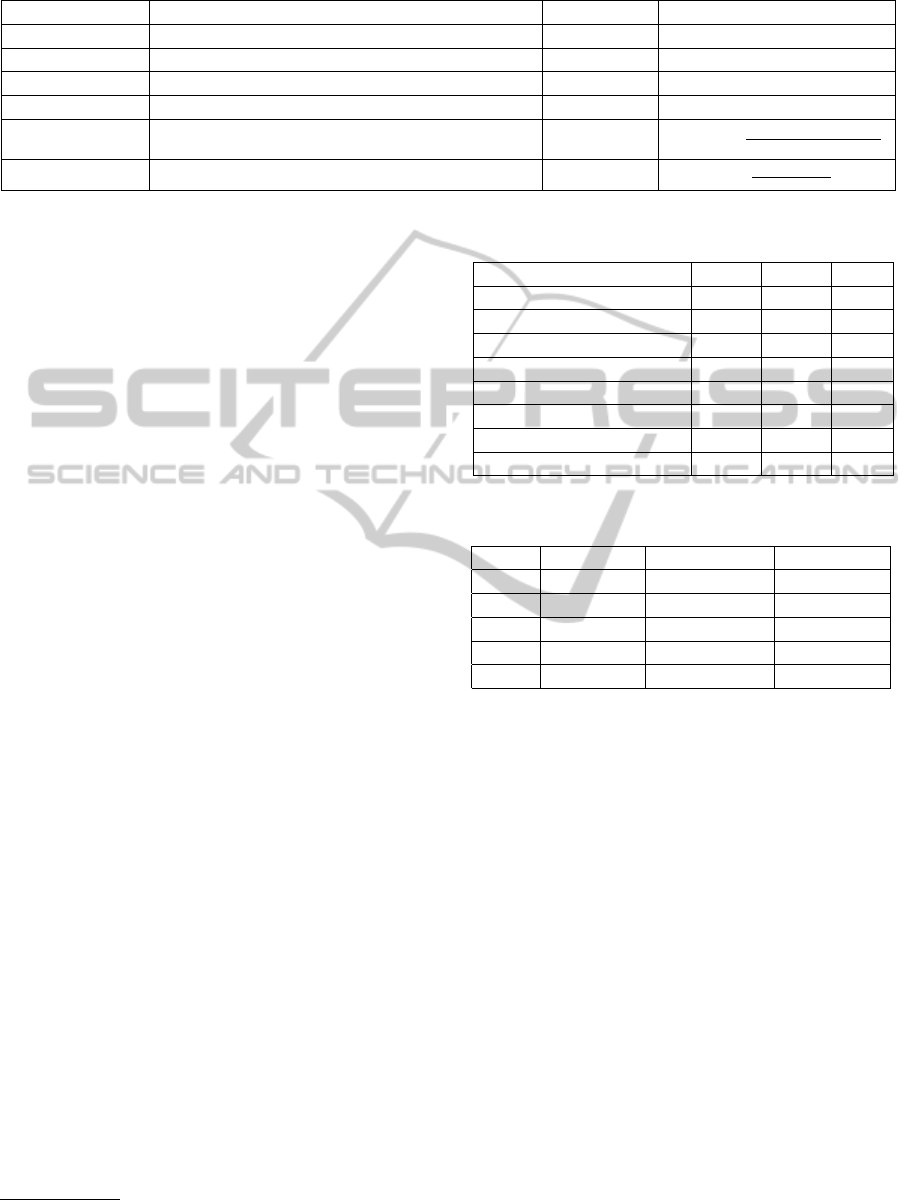
Table 3: Meta-SLA functional and non-functional parameters and the corresponding aggregated functions.
Parameter Definition Unit/Range Aggregation function
Contract
duration
leasing period hour -
Budget V M(small/hour), Storage(GB/month), Tra f f ic(GB/month) $ -
Availability up-time of composite service % Ava
agg
=
∏
n
i=1
Ava(S
i
)
Throughput downloaded data from composite service Mbit/s T h
agg
= min
n
i=1
T h(S
i
)
Latency latency of composite service ms Lat
agg
=
∑
n
i, j=1
W (S
i j
).Lat(S
i j
)
∑
n
i, j=1
W (S
i j
)
Reputation popularity of included providers 1 - 10 Rep
agg
=
∑
n
i=1
Rep(S
i
)
n
tational units of different IaaS providers for the same
VM size are similar. The pricing model for each simu-
lated provider has been acquired by the pricing model
of the corresponding real-world IaaS provider, while
the values of QoS attributes have been gathered by
running a set of Cloud tests via CloudHarmony
6
on
the considered public Cloud providers using a single
client hosted in Europe. This specification allows us
to model a realistic simulation environment.
Furthermore, the reputation value for each
provider is simulated considering the reputation rank-
ing model introduced in (Itani et al., 2011). Due
to lack of free access to information related to the
latency between different data centers (available on
CloudHarmony), a latency matrix has been defined
with synthesized values by considering the geograph-
ical distances, shown in Table 2, while the latency be-
tween services within the same data center is assumed
to be 10ms.
Supported meta-SLA parameters in our simula-
tion are presented in Table 3. In this Table, budget
is the willingness of the user’s investment in VM and
storage renting as well as the data traffic based on the
defined units. For the VM a unit of cost expresses the
value of renting a small VM per hour, while for the
storage and traffic it represents the value of storing or
transferring 1GB of data per month. The calculation
of the total budget in our simulation is based on these
three introduced units as well as the Contract
duration
.
In addition, the estimated size of the transferred data
also influences the calculation of traffic cost. For
other non-functional parameters in the meta-SLA, as
depicted in Table 3, there is a corresponding aggre-
gation function according to the ones introduced in
(Zeng et al., 2003). These functions calculate the ag-
gregated values of composite service non-functional
parameters based on its constituent services. In the
aggregated latency formula W (S
i j
) is the connectivity
value of each edge in the graph introduced in Section
4.1. While Lat(S
i j
) is gathered from the latency ma-
trix, showed in Table 2, based on the data center geo-
6
http://cloudharmony.com/
Table 4: Meta-SLA values for different software editions.
Parameter (unit) Stan. Prof. Ent.
Contract
duration
(hour) 720 720 720
Budget-VM ($/hour) 0.07 0.1 0.14
Budget-Storage ($/month) 0.1 0.12 0.15
Budget-Traffic ($/month) 0.1 0.12 0.15
Availability (%) 96 98 99.8
Throughput (Mbit/s) 5 5 15
Latency (ms) 100 100 40
Reputation (1−10) 3 3 5
Table 5: Sub-SLA values for different software editions
(St=Standard, Pr=Pro f essional, En=Enter prise).
SubSLA
UI
SubSLA
Comp.
SubSLA
Stor.
Edit. St / Pr /En St / Pr /En St / Pr /En
Type vm vm storage
Size S/M/L L/L/L 100/500/1000
Num. 1 / 1 /1 1 / 2 /5 1 / 1 /2
Loca. − − Europe
graphical location of included services in the compo-
sition. In order to show the different aspects of our ap-
proach, we run the experiments by three sets of SLAs
for three CAD software editions (Standard, Profes-
sional and Enterprise), each with different meta-SLAs
and sub-SLAs as depicted in Table 4 and Table 5, re-
spectively.
As shown in Figure 3, CAD-aaS example, we di-
vided the sub-SLAs into three logical groups. The
first group of requested services belongs to the in-
frastructures which provide the application’s user in-
terface, called subSLA
UI
. The second group, is re-
lated to the infrastructures for computing the appli-
cation’s business logic which is rendering the im-
ages in CAD-aaS, called subSLA
Computation
. Finally,
data persistence group belongs to the infrastructures
which store and maintain the data (CAD models),
called subSLA
Storage
. Although our approach is flex-
ible enough to receive three different sets of sub-
SLAs {subSLA
UI
, subSLA
Computation
, subSLA
Storage
}
for each software edition, we consider the same set
for all editions. The rationale behind it is that each
HS4MC-HierarchicalSLA-basedServiceSelectionforMulti-CloudEnvironments
729
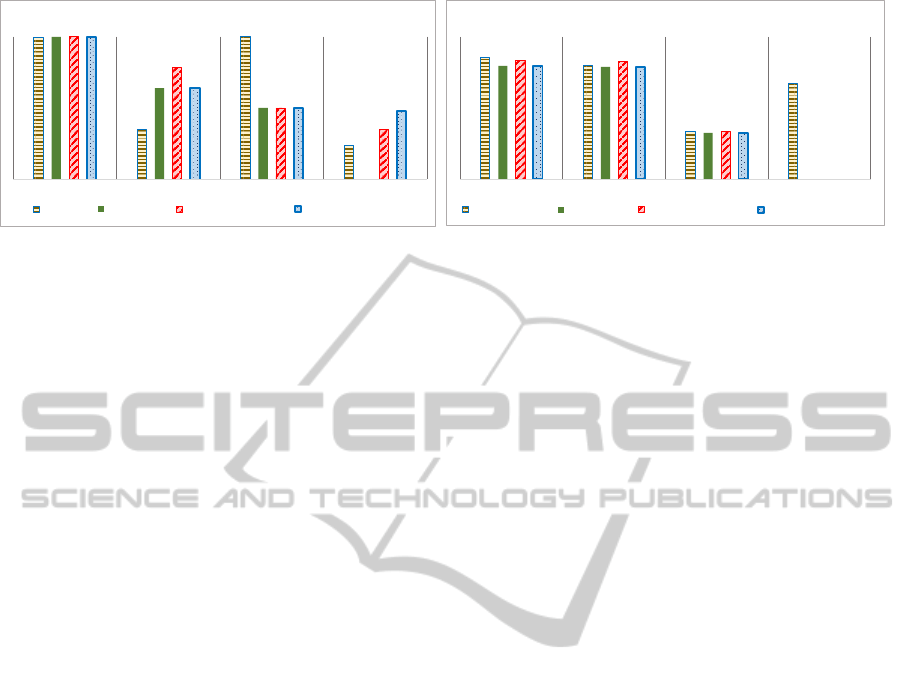
96
5
100
3
99.91
19.11
10
99.79
36.5
10
5
99.91
19.11
10
9
Availability Throughput Latency
Q o S P a r am e t er s
( M e t a - S L A)
Meta-SLA Utility-based Prospect-based (1st)
Reputation
Prospect-based (2nd)
364.4
252
10
102.4
243.5
234.00
9.5
319
309
10
243
234
9.5
Co st
(M e ta -S L A)
Total-cost
VM-cost
Meta-SLA Value
Utility-based
Storage-cost
Prospect-based (1st)
Traffic -cost
Prospect-based (2nd)
Figure 5: Simulation results: aggregated QoS values of selected services and meta-SLA for the standard edition scenario.
sub-SLA expresses the functional and non-functional
requirements related to the application components
(UI, Computation, Storage). While it is possible to
have different functional needs such as type, size and
number of requested infrastructure services for each
component, the non-functional requirements of vari-
ous components in different software editions are al-
most the same.
5.2 Utility-based Matching Algorithm
The utility-based algorithm, which the proposed al-
gorithm is compared to, uses a quasi-linear utility-
function adopted from the multi-attribute auction the-
ory (Asker and Cantillon, 2008) to calculate the user
utility, taking the user payment willingness in focus.
The utility for each composite service is calculated by
subtracting the total service usage costs (include VM,
traffic, storage) from its monetized usage benefit. The
former is calculated for each user by multiplying his
overall score for the SLAs with his maximal payment
for a perfect service. The overall SLA scores (a nor-
malized value between 0 and 1), defined as the sum
of the weighted single SLA parameter scores, express
the overall user satisfaction for a certain service qual-
ity. For the calculation of the SLA score, the algo-
rithm uses so called fitting functions that map each
SLA metric value to a satisfaction level between 0 and
1.
5.3 Theoretical Comparison
The key differences of the proposed algorithm, named
prospect-based, with the utility-based algorithm can
be summarized as follows.
(1) The two algorithms have a different perspec-
tive on the cost. In our algorithm, the cost has a flexi-
ble impact with a specified weight, similar to the other
non-functional parameters, while in the utility-based
algorithm, the cost has a fixed influence with a pre-
defined impact. (2) The weighting model of these
two algorithms are different. In the prospect-based
algorithm, the weight of each non-functional param-
eter is chosen within (0,1] independently of other pa-
rameters. However, in the utility-based algorithm the
weights are dependent to each other within (0,1] and
the sum of them should be 1. (3) The utility-based
algorithm selects as the target a Composite Infras-
tructure Service which the one offering the maximal
utility value for the user. While, our algorithm se-
lects the service that best satisfies both the meta-SLA
and the sub-SLAs. In both algorithms, functional pa-
rameters must be fulfilled and both aim to find the
best set of non-functional parameters. However, con-
trary to the utility-based algorithm, our algorithm can
also support hard non-functional parameters that can
be treated as the same way as functional parameters.
(4) The fitting functions used in the utility-based al-
gorithm are quite similar to SSF used in our algo-
rithm. However, our algorithm is more flexible as
it is based on the weights, while the utility-based al-
gorithm needs to define separated fitting function for
each QoS. Therefore, supporting more SLA parame-
ters in our algorithm needs less effort. Furthermore,
these fitting functions in utility-based algorithm are
only used to score the aggregated QoS based on the
SLA for the Composite Infrastructure Service, while
our algorithm supports scoring each single infrastruc-
ture service based on the sub-SLA as well as the com-
posite service based on the meta-SLA using the SSF.
5.4 Experimental Results
In this section, the service selection results of both
algorithms are analyzed based on several evaluation
scenarios in which the inputs are as shown in Table
4 and Table 5, described earlier. The scenarios in
the following sections have been designed in a way
to highlight different aspects of our work.
CLOSER2014-4thInternationalConferenceonCloudComputingandServicesScience
730
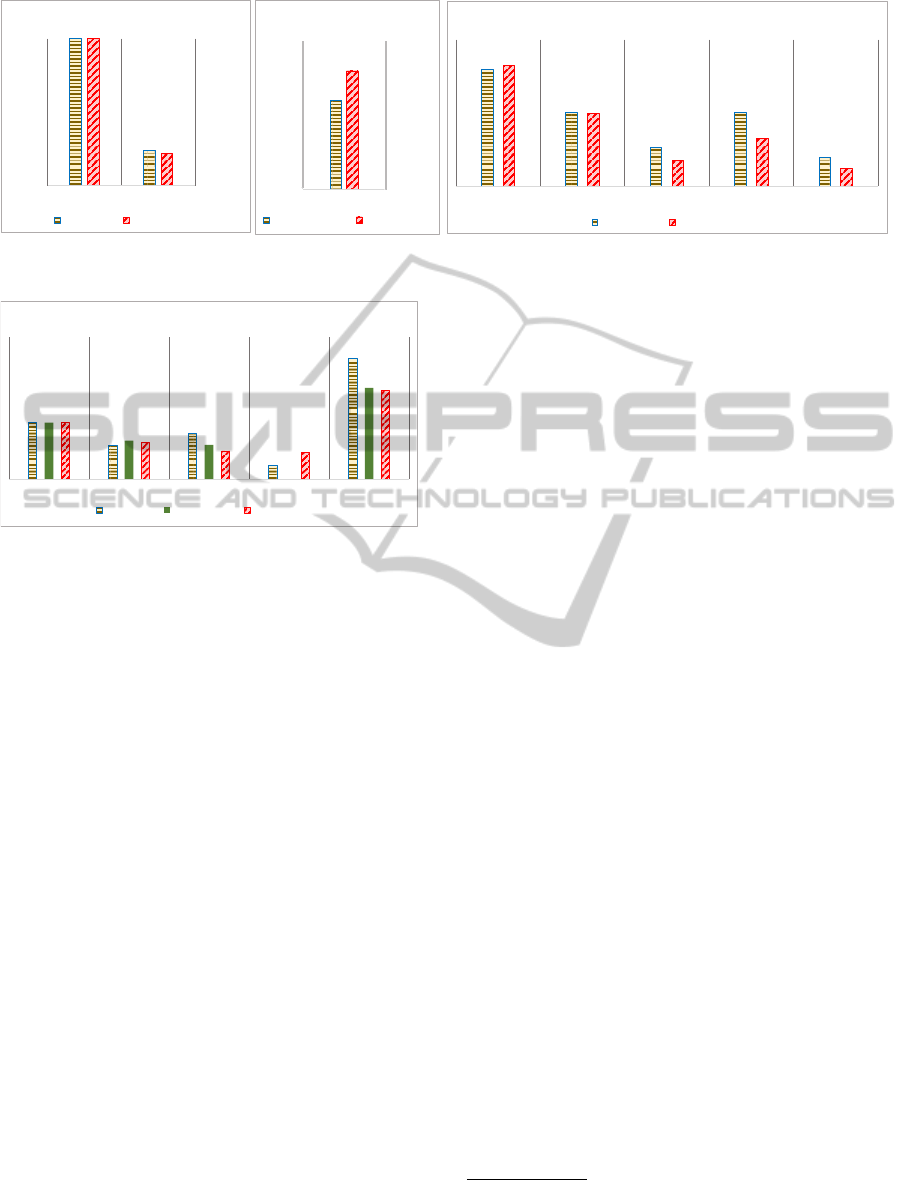
99.97
3
99.97
2.73
Availability Response time
Q o S p a r am e te r s
( S u b - SL A f o r U I )
me
SubSLA_UI Prospect-based
6
8
Q o S p a r am e te r s
( S u b - SL A f o r S t o r a g e)
Reputation
SubSLA_Storage
Prospect-based
1535
99.87
11.28
100
6.33
2008.8
98.00
5
20
3
Total Cost Availability Throughput Latency Reputation
Q o S p a r am e te r s a n d C o s t
( M e t a - S L A)
Meta-SLA Prospect-based
Figure 7: Simulation results: QoS values of selected services, meta-SLA and sub-SLAs for the professional edition scenario.
99.8
15
40
3
18086.4
99.44
23.13
16.429
1673
99.91
19.11
10
9
1317.76
Availability
Throughput Latency Total-cost
Q oS par ame t e r s an d C ost
(M e t a - SLA )
Meta-SLA Utility-based
Reputation
Prospect-based
violation!
Figure 6: Simulation results: aggregated QoS values of se-
lected services and meta-SLA for the enterprise edition sce-
nario.
5.4.1 Impact of Cost
At the first scenario, minimizing the cost is the main
goal of the user and the composite service QoS is
more important than the quality of individual services.
To simulate this scenario, we assigned the weights as
W
subSLA
= 0.1 and W
metaSLA
= 0.9, to dominate the in-
fluence of meta-SLA on sub-SLAs in service selec-
tion. Furthermore, in meta-SLA, W
Cost
= 0.8 and for
other non-functional parameters W
NF
= 0.25 to make
cost as the most effective factor on service selection.
Figure 5 depicts the results of aggregated QoS val-
ues of chosen services for the both algorithms. In
this scenario, the selected services (the 1st ranked or
the 2nd rank) of the prospect-based algorithm are the
exactly the same as the selected result of the utility-
based algorithm, and both algorithms select the ser-
vices of the same Cloud provider data center. For this
reason, the aggregated values of latency are 10ms.
Furthermore, both algorithms are successful in sat-
isfying the requested non-functional parameters of
meta-SLA including cost (cost of VM, Storage and
Traffic), as illustrated in Figure 5.
The results of the first scenario, demonstrate the
tendency of both algorithms to select services from
the same Cloud provider data center, if this does not
lead to SLA violations. The first ranked services of
the prospect-based algorithm were chosen from Ama-
zonEC2
7
(Europe
8
) while the utility-based algorithm
and the second ranked of our algorithm selected all
services from the Voxel
9
(Europe). This is reason-
able, since the data traffic is free of charge and la-
tency is negligible when all the services are located at
the same data center. Note that the experiments with
the professional and enterprise editions achieved sim-
ilar results to the experiments with the standard edi-
tion and will, therefore, not be herewith discussed in
detail.
5.4.2 Impact of Meta-SLA
At the second scenario, we evaluate the proposed al-
gorithm in a condition in which the importance of
another QoS parameter, availability, for the user is
equal to cost and higher than the ones of other non-
functional parameters. We achieve this by setting the
weight of availability more than the weights of other
meta-SLA parameters (incl. throughput, latency, rep-
utation) in the enterprise software edition scenario.
Moreover, in the utility-based algorithm, we set
the weight equal to 0.5 for the availability and 0.25 for
both the latency and throughput. By applying these
settings, we gain the results as depicted in Figure 6.
Our algorithm chose AmazonEC2 (Europe), while the
utility-based algorithm selected Voxel (Europe) for all
requested infrastructure services. The graphs in this
figure show that our algorithm performs well by first
not violating any SLA parameters and then by giv-
ing priority to the parameters that are more impor-
tant for the user (cost and availability) and finally try-
ing to choose the services with suitable quality val-
ues (closer to the user request) for other parameters.
This can justify the idea of applying prospect theory
in the service selection, in which the best score is for
a service that more closely satisfy the requested SLA
7
http://aws.amazon.com/ec2/
8
It means data center is located in Europe.
9
http://www.voxel.net
HS4MC-HierarchicalSLA-basedServiceSelectionforMulti-CloudEnvironments
731

parameters from the higher priority ones to the lower
ones, contrary to the services that have the best qual-
ity. The throughout graph of this figure demonstrates
that the utility-based algorithm tries to maximize the
values of throughput, while the requested availability
is violated. This scenario shows that the utility-based
algorithm focuses more on keeping the cost under
the requested budget as the cost impact is not config-
urable in the algorithm. While in the prospect-based
algorithm by assigning suitable weights and accepted
boundaries for each SLA parameters, we can obtain
the ranking score that maximizes the user’s satisfac-
tion.
5.4.3 Impact of Sub-SLA
At the last scenario, we consider that the SaaS
provider has specific non-functional requirements
for some of its components. In the other word,
the CAD-aaS provider wants to provide a profes-
sional software edition in which, for the security rea-
sons, it is required to use Cloud storage service that
stores the CAD models only in Europe, and has a
good reputation (location = EU and reputation =
6 in subLSA
Storge
). Furthermore, the CAD-aaS
provider wants to keep the response-time of its de-
ployed UI under 3s, and makes it highly available
(responseTime = 3s and availability = 99.98% in
subSLA
UI
) with high importance weights (0.75) for
the professional software edition. we consider the im-
portance weight as default (W=0.5) for other meta-
SLa parameters.
The graphs depicted in Figure 7 depict the com-
parison results between the QoS parameters requested
in meta-SLA and sub-SLAs, and the QoS values of
the selected services (Rackspace
10
for UI and Stor-
age, Citycloud
11
for Computation both in Europe) by
the prospect-based algorithm. As shown, the algo-
rithm found a suitable set of services that satisfies not
only the requested meta-SLA for the composite ser-
vice, but also all the requested sub-SLAs’ parameters
have been satisfied.
5.4.4 Discussion
From the first scenario, we conclude that although the
impact of cost in the prospect-based algorithm is not a
predetermined like the utility-based algorithm, by as-
signing proportional weights to the service selection
criteria, the proposed algorithm can behave the same
as a utility-based method which is widely accepted
10
http://www.rackspace.com
11
https://www.citycloud.com
Cloud service selection from the efficiency point of
view.
The second scenario, in which another QoS pa-
rameter is as important as cost for the user, shows that
the prospect-based algorithm outperforms the utility-
based algorithm. It selects more suitable services
which first do not violate any requested meta-SLA
parameters, and then chooses the services with better
quality values for the parameters that are more impor-
tant for the user.
The third scenario highlights one of the main fea-
tures of the proposed algorithm. The proposed al-
gorithm not only tries to find an optimum compos-
ite service with accepted aggregated QoS values to
satisfy the meta-SLA, but also consider the sub-SLA
satisfaction for each included service. While, exist-
ing service selection algorithms that support compos-
ite service selection, only focus on finding the set of
services which satisfies the aggregated QoS parame-
ters and neglect to view the included services in this
composite service separately. We can cover this need
easily by the sub-SLA concept, as represented in the
third scenario.
To sum up, according to the experimental results,
when we are dealing with the quality parameters of a
service as a whole, any algorithms may be adequate
to find the most suitable services among the candi-
dates. The main problem here is that in this situa-
tion, services provided by the same provider are pre-
ferred. This diminishes the benefits of a multi-cloud
environment. Our algorithm comes into play when
users want to take the advantage of being able to com-
bine services offered by different providers available
in a multi-cloud. By introducing the sub-SLA con-
cept, now the user can defines more details regard-
ing the individual services inside a composite service.
This, as can be seen in the results, leads to a better
user satisfaction. It is worth mentioning that support-
ing parameters such as reputation is significant in our
work.
However, as also hinted in (Yau and Yin, 2011)
regarding to the application of prospect theory in web
service domain, although this theory has been widely
accepted and used in economics, the evaluation of its
effectiveness and accuracy in regarding to its influ-
ence on Cloud service ranking and selection needs
more studies and investigation.
6 CONCLUSION
Diversity of services in Multi-Cloud is encouraging
more SaaS providers to move towards using the in-
frastructures provided by the IaaS providers instead
CLOSER2014-4thInternationalConferenceonCloudComputingandServicesScience
732

of running their own private data centers. However,
there are still some issues that impede this evolu-
tionary process such as the lack of an efficient ser-
vice selection and SLA management. In this pa-
per, we introduced HS4MC approach an Hierarchical
SLA-based Service Selection for Multi-Cloud Envi-
ronments. This approach contains two phases: SLA
Construction and Service Selection. In the former,
we investigated the SLA hierarchy issue and tack-
led it by proposing the sub-SLA and meta-SLA con-
cepts. In the latter, we used a selection algorithm
based on prospect theory to score the infrastructure
services based on the given SLAs and the degree of
user satisfaction. Our simulation-based evaluation
and a comparison with a utility-based matching algo-
rithm showed that our approach effectively selects a
set of services for the composition that satisfy both
meta-SLA and sub-SLA parameters. For this pur-
pose, we implemented both algorithms and modeled a
realistic simulation environment for a CAD software
provider scenario.
In our future work, we will investigate more on
the construction of InterCloud-SLAs by utilizing the
model driven principles. We will also focus on map-
ping these SLAs to the selected cloud infrastructure
services at runtime. Finally, we will explore the SLA
violation detection issue and develop a penalty model
in case of violations as the next steps in the Multi-
Cloud SLA management.
ACKNOWLEDGEMENTS
Soodeh Farokhi is financed through the doctoral col-
lege ”Adaptive Distributed Systems”, Holistic En-
ergy Efficient Management of Hybrid Clouds (HA-
LEY) project of the Vienna University of Technology,
the Austrian National Research Network S11403 and
S11405 (RiSE) of the Austrian Science Fund (FWF),
and by the Vienna Science and Technology Fund
(WWTF) grant PROSEED. Foued Jrad’s research stay
abroad at the Vienna University of Technology was
funded by the Karlsruhe House of Young Scientists
(KHYS).
REFERENCES
Asker, J. and Cantillon, E. (2008). Properties of scoring
auctions. The RAND Journal of Economics, 39(1):69–
85.
Bellavista, P., Corradi, A., Foschini, L., and Pernafini,
A. (2013). Automated provisioning of saas applica-
tions over iaas-based cloud systems. In Advances in
Service-Oriented and Cloud Computing, pages 94–
105. Springer.
Breskovic, I., Altmann, J., and Brandic, I. (2013). Creating
standardized products for electronic markets. Future
Generation Computer Systems, 29(4):1000–1011.
Clark, K., Warnier, M., and Brazier, F. M. (2013). Auto-
mated non-repudiable cloud resource allocation. In
Cloud Computing and Services Science, pages 168–
182. Springer.
Dastjerdi, V. (2013). QoS-aware and semantic-based ser-
vice coordination for multi-Cloud environments. PhD
thesis, University of Melbourne.
Emeakaroha, V. C., Brandic, I., Maurer, M., and Breskovic,
I. (2011). Sla-aware application deployment and re-
source allocation in clouds. In Computer Software and
Applications Conference Workshops (COMPSACW),
2011 IEEE 35th Annual, pages 298–303. IEEE.
Itani, W., Ghali, C., Kayssi, A. I., and Chehab, A. (2011).
Accountable reputation ranking schemes for service
providers in cloud computing. In CLOSER, pages 49–
55.
Jrad, F., Tao, J., Knapper, R., Flath, C. M., and Streit, A.
(2013). A utility-based approach for customised cloud
service selection. Int. J. Computational Science and
Engineering.
Kahneman, D. and Tversky, A. (1979). Prospect theory: An
analysis of decision under risk. Econometrica: Jour-
nal of the Econometric Society, pages 263–291.
Lee, Y. C., Wang, C., Zomaya, A. Y., and Zhou, B. B.
(2010). Profit-driven service request scheduling in
clouds. In Proceedings of the 2010 10th IEEE/ACM
International Conference on Cluster, Cloud and Grid
Computing, pages 15–24. IEEE Computer Society.
Moghaddam, M. and Davis, J. G. (2014). Service selection
in web service composition: A comparative review
of existing approaches. In Web Services Foundations,
pages 321–346. Springer.
Ouelhadj, D., Garibaldi, J., MacLaren, J., Sakellariou, R.,
and Krishnakumar, K. (2005). A multi-agent infras-
tructure and a service level agreement negotiation pro-
tocol for robust scheduling in grid computing. In
Advances in Grid Computing-EGC 2005, pages 651–
660. Springer.
Petcu, D. (2013). Multi-cloud: expectations and current
approaches. In Proceedings of the 2013 international
workshop on Multi-cloud applications and federated
clouds, pages 1–6. ACM.
Redl, C., Breskovic, I., Brandic, I., and Dustdar, S. (2012).
Automatic sla matching and provider selection in grid
and cloud computing markets. In Proceedings of the
2012 ACM/IEEE 13th International Conference on
Grid Computing, pages 85–94. IEEE Computer So-
ciety.
Son, S., Jung, G., and Jun, S. C. (2013). An sla-based
cloud computing that facilitates resource allocation in
the distributed data centers of a cloud provider. The
Journal of Supercomputing, pages 1–32.
Wu, L., Garg, S. K., and Buyya, R. (2011). Sla-based re-
source allocation for software as a service provider
HS4MC-HierarchicalSLA-basedServiceSelectionforMulti-CloudEnvironments
733

(saas) in cloud computing environments. In Clus-
ter, Cloud and Grid Computing (CCGrid), 2011 11th
IEEE/ACM International Symposium on, pages 195–
204. IEEE.
Wu, L., Kumar Garg, S., Versteeg, S., and Buyya, R. (2013).
Sla-based resource provisioning for hosted software
as a service applications in cloud computing environ-
ments. Journal of IEEE Transactions on Services
Computing.
Yau, S. S. and Yin, Y. (2011). Qos-based service ranking
and selection for service-based systems. In Services
Computing (SCC), 2011 IEEE International Confer-
ence on, pages 56–63. IEEE.
Zeng, L., Benatallah, B., Dumas, M., Kalagnanam, J., and
Sheng, Q. Z. (2003). Quality driven web services
composition. In Proceedings of the 12th interna-
tional conference on World Wide Web, pages 411–421.
ACM.
CLOSER2014-4thInternationalConferenceonCloudComputingandServicesScience
734
