
Analysing the Migration Time of Live Migration of Multiple Virtual
Machines
Kateryna Rybina, Abhinandan Patni and Alexander Schill
Chair of Computer Networks, Faculty of Computer Science, Technical University Dresden, 01062 Dresden, Germany
Keywords:
Virtual Machine, Live Migration of Multiple VMs, Interference Effects, KVM, SPEC CPU2006, VM
Migration Costs, VM Migration Time, Energy-efficient Computing.
Abstract:
Workload consolidation is a technique applied to achieve energy efficiency in data centres. It can be realized
via live migration of virtual machines (VMs) between physical servers with the aim to power off idle servers
and thus, save energy. In spite of innumerable benefits, the VM migration process introduces additional costs
in terms of migration time and the energy overhead. This paper investigates the influence of workload as well
as interference effects on the migration time of multiple VMs. We experimentally show that the migration
time is proportional to the volume of memory copied between the source and the destination machines. Our
experiment proves that the VMs, which run simultaneously on the physical machine compete for the available
resources, and thus, the interference effects that occur, influence the migration time. We migrate multiple VMs
in all possible permutations and investigate into the migration times. When the goal is to power off the source
machine it is better to migrate memory intensive VMs first. Kernel-based Virtual Machine (KVM) is used as
a hypervisor and the benchmarks from the SPEC CPU2006 benchmark suite are utilized as the workload.
1 INTRODUCTION
Virtualization of the physical machine allows multi-
ple operating systems to be run on it. These operating
systems are running in VMs, which are logically iso-
lated from each other. Each VM gets its share of the
server’s resources assigned to it by a midleware called
hypervisor, and may run its own application(s). This
allows the physical resources of one server to be effi-
ciently shared between multiple VMs, thus reducing
the amount of needed physical hardware (Kofler and
Spenneberg, 2012). It leads to energy saving in the
IT infrastructure such as big data centres and clouds,
as well as reducing the maintenance costs (Koomey,
2011).
KVM
1
is one of the examples of hypervisors that
in combination with QEMU
2
hardware emulation
program and application programming interface lib-
virt
3
constitute a complete virtualization system.
Another merit of virtualization is that it enables
the live migration of the virtual machines. Live mi-
gration of the VMs is a transparent process of physi-
1
http://www.linux-kvm.org/page/Main Page.
2
QUEMU: source machine emulation program.
http://wiki.qemu.org/Main Page.
3
Libvirt: The virtualization API. http://libvirt.org/.
cally moving a VM from one server to another. Dur-
ing this, the applications continuously run on the
VMs. It allows to consolidate the workload on the
smaller number of physical machines, power off idle
ones, and thus, save energy. Migration can be also
applied for the load balancing policy (Gerofi et al.,
2010) or for the reason of transparent infrastructure
maintenance.
But the live VM migration itself introduces non
negligible overhead to the system, in the literature re-
ferred to as migration costs. Migration time, during
which service execution latency is observed and the
energy overhead are the examples of the migration
costs (Strunk, 2012). The latter occurs because the
migration process requires additional resources such
as CPU cycles and network bandwidth (Wu and Zhao,
2011). And the CPU is the main energy consumer of
the system (Beloglazov et al., 2012).
Moreover, the applications on the co-located VMs
may compete for the resources as they share cashes,
memory channels, network and storage devices (De-
limitrou and Kozyrakis, 2013). This can be under-
stood as interference effects. The hypervisor first
fairly allocates the resources to the running VMs on
the server and then to the migration process. We be-
lieve, if there are not enough free resources (e.g. CPU
590
Rybina K., Patni A. and Schill A..
Analysing the Migration Time of Live Migration of Multiple Virtual Machines.
DOI: 10.5220/0004951605900597
In Proceedings of the 4th International Conference on Cloud Computing and Services Science (CLOSER-2014), pages 590-597
ISBN: 978-989-758-019-2
Copyright
c
2014 SCITEPRESS (Science and Technology Publications, Lda.)
cycles, available bandwidth) on the server due to in-
terference effects the migration time may expand.
In this paper we investigate the migration time of
the VMs and how it is influenced by the workload run-
ning on the VM and the interference effects, caused
by running co-located virtual machines on the server
during migration. This paper makes the following
contribution:
• We show experimentally that when running co-
located VMs on the physical server the interfer-
ence effects occur and investigate how they influ-
ence the migration time of multiple VMs.
Our paper is organized as follows. Section 2 ex-
plains how the live migration of virtual machines is
realized. In Section 3, we present the utilized bench-
marks and the experimental settings for carrying our
live migration. Section 4 goes into the details of the
experiments. Observations and results of the exper-
iments are presented in Section 5. Then, the related
works are discussed in Section 6 and in Section 7 we
make the conclusion and outline the future research
work.
2 PRE-COPY LIVE MIGRATION
TECHNIQUE
Live migration of the VMs is a technique that allows
VMs to be physically moved between servers when
VMs are operating, namely running their workload
without interrupts. Modern virtualization technology
stores the images of the VMs in the network attached
storage (NAS). In this case the migration process is
reduced to copying the in-memory state and the con-
tent of CPU registers between source and destination
physical machines. Thus, it is realized faster and does
not create so much network traffic. KVM applies a
technique for the live migration called pre-copy (Liu
et al., 2011) which is explained in the following (see
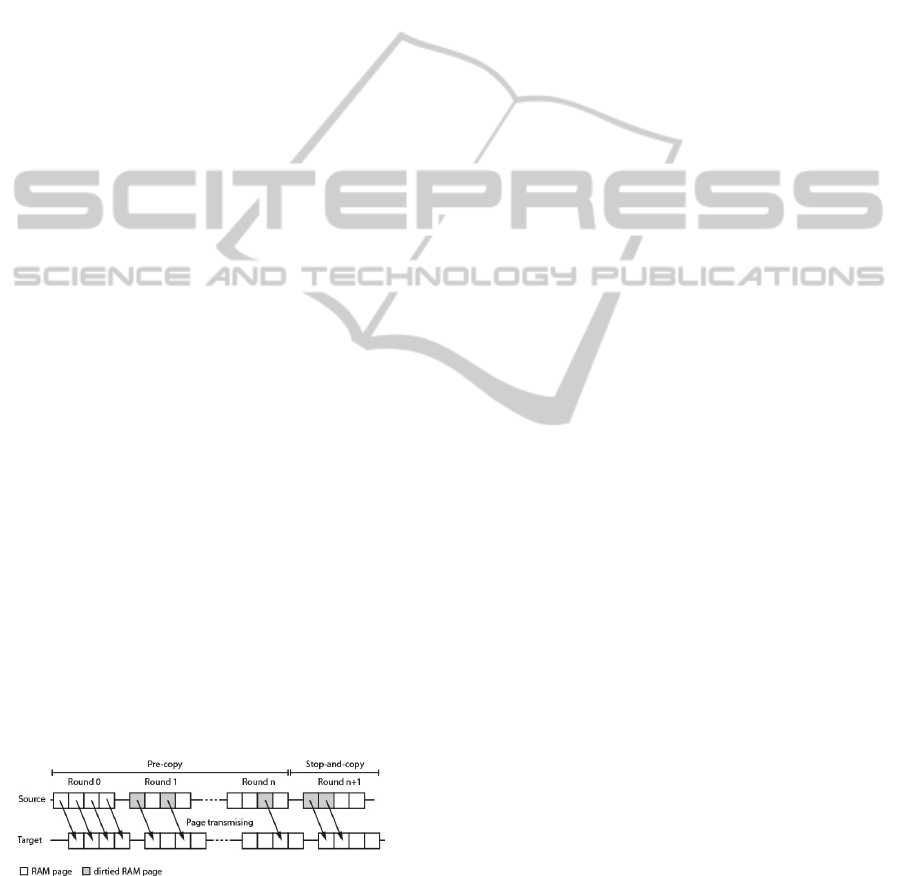
Figure 1). The migration algorithm is realized in sev-
Figure 1: Pre-copy live migration algorithm (Liu et al.,
2011), (Strunk and Dargie, 2013), (Rybina et al., 2013).
eral iterative rounds. At the first round (see Round 0
Figure 1) all memory pages used by the VM are page-
wise copied from the source machine to the destina-
tion host. This is realized while the VM is running
(executing its applications). As this process takes
some time some of the memory pages on the source
machine may be modified (dirtied), and thus no longer
be consistent with the copy version on the destination
host. Only these pages have to be re-sent in the con-
secutive round(s) (see Round 1...n Figure 1) in order
to ensure memory consistency.
In order to prevent the first Pre-copy phase from
executing indefinitely, it is important to introduce
some threshold, so called stop condition. Usually,
one of the following three thresholds (limits) are con-
sidered in the modern hypervisors as well as KVM
(Liu et al., 2011), (Strunk and Dargie, 2013): (1) the
number of iterations exceeds a pre-defined limit value
(n > n
lim
), (2) the total amount of memory that has
already been transmitted exceeds a pre-defined limit
(memory
mig
> memory
lim
), or (3) the number of dirt-
ied pages in the previous round falls below a set limit
value (pages < pages
lim
). After one of the thresholds
is reached, the hypervisor shortly suspends the VM
to prevent further dirtying of the memory pages and
copies the remaining dirtied memory pages as well as
the state of the CPU registers to the destination host
(see Stop-and-copy Figure 1). At this point the mi-
gration process is finished and the hypervisor on the
destination host resumes the VM.
3 CONCEPT
Use case 1: In a scenario of having two underuti-
lized servers, the idea is to migrate the workload (all
VMs) from server one to server two and to power off
the first server in order to save energy. This scenario
would also suffice for the situation when server one
has to be switched off for maintenance reasons. If on
the first server k VMs are running, then the interfer-
ence effects occur and the migration time might be
influenced by it. It is of great interest to investigate
whether the order at which we migrate all VMs in-
fluence the total migration time as well as the power
consumption during migration.
Knowing these two parameters, we will be able
later to define another migration cost factor called en-
ergy overhead. It is the power consumed during mi-
gration duration:
E
overhead
=
P
mig
− P
bmig
× t
mig
(1)
where , the P
mig
is the power consumption of the
system under consideration during migration, P
bmig
stands for the average power consumption of the sys-
tem before a migration process took place, and t
mig
is
the migration duration.
AnalysingtheMigrationTimeofLiveMigrationofMultipleVirtualMachines
591
Use case 2: In M heterogeneous server scenario,
when we have to migrate N VMs with the aim to
make load balancing in the system, the problem of op-
timal resource consolidation becomes more complex
and in the literature often referred to as the multiple
”bin packing” problem (Verma et al., 2008), (Li et al.,
2009). While in this case the bins having different
volume refer to heterogeneous physical machines and
the balls of different size with which we have to fill
these bins refer to VMs.
In both scenarios it will be beneficial to leverage
the knowledge about interference effects of different
VMs running together in order to find later the best
candidates for migration. For the Use case 1, that per-
mutation of VMs which will result in least migration
time, will be considered as the best permutation. As
from the application perspective the migration time
can be also considered as the application performance
degradation time (Wu and Zhao, 2011).
The three goals of our experiment are to investi-
gate:
1. how the migration time of a single as well as mul-
tiple VMs depends on the benchmarks (workload)
running on the VMs;
2. whether interference effects occur in multiple
VMs migration scenario and how they influence
the migration time; and,
3. possible patterns which could indicate the
favourable VMs migration order when we want
to free the server by migrating all VMs from it.
We realize multiple VMs migration in all possible
permutations and investigate into the migration times.
3.1 Benchmarks
As the workload for our experiments four benchmarks
from the SPEC CPU2006
4
benchmark suite were se-
lected. These benchmarks stress the CPU and mem-
ory of the VMs to different extent, thus allowing us
to observe dependence of the migration time on the
applied workload. Two of the benchmarks are CPU
intensive (and have slight memory usage) and another
two are memory as well as CPU intensive. This cre-
ates an environment where the interference effects oc-
cur. For example, the memory intensive processes on
different VMs may use the common data bus, thus
slowing down the access to memory.
These benchmarks were chosen on the basis of
the results from the hardware based profiler called
Oprofile
5
which was used to fetch values recorded
4
SPEC CPU2006: http://www.spec.org/cpu2006
5
OProfile: Profiler for Linux systems.
http://oprofile.sourceforge.net
in the performance counters of the host CPU. The
CPU intensive benchmarks used the maximum CPU
time, implying that they kept the CPU busy most of
the time. The memory intensive benchmarks had the
maximum number of read/writes from/to the mem-
ory subsystem. After determining the highest values
of the aforementioned performance counters the fol-
lowing four SPEC CPU2006 benchmarks were cho-
sen (see Table 1).
For example 464.h264ref and 444.namd are two
CPU intensive benchmarks that cause about 100%
CPU utilization and the former creates a slightly more
memory utilization than the latter. Though, the mem-
ory utilization of both these benchmarks is slight.
429.mcf and 401.bzip are highly memory intensive.
For example it is required to have 1700 MB of mem-
ory free in order to run 429.mcf and it causes 100%
CPU utilization. An extensive analysis of memory
behaviour of SPEC CPU2006 was done by (Jaleel,
2010).
Migration of multiple VMs
in different permutations
Destination
Host
NAS
Measurement
device 1
Measurement
device 2
Client
Fedora 15,
2 Dual Core 3.6 GHz CPUs
RAM: 4 GByte
1 GBit/s ethernet
Source
Host
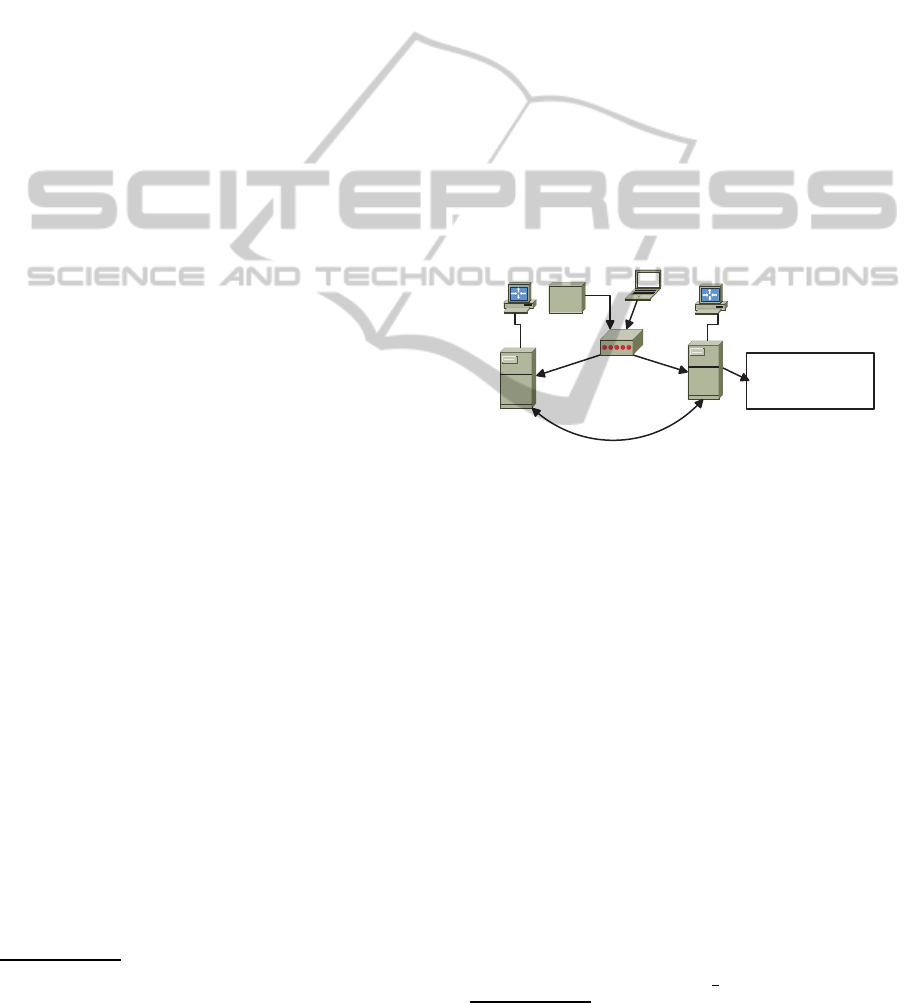
Figure 2: Experimental setup for live migration of multiple
virtual machines in different permutations.
3.2 Settings of the Experiment
The experiment was based on the live migration of
four virtual machines from the source physical ma-
chine (Source host) to the destination physical ma-
chine (Destination host) using network attached stor-
age (NAS), and the client machine to trigger migra-
tion as depicted in Figure 2 .
Two physical machines under test are homoge-
neous with the following parameters: two Intel 15-
680 Dual Core 3.6 GHz processors, 4 GB DDR3-
1333 SDRAM, and with 1 Gbit/s Ethernet NIC. They
are interconnected via a 1 Gbit/s switch. The NAS
on which the VM images are located has the follow-
ing characteristics: Intel Xeon E5620 Quad-Core 2.4
GHz processor, 10 GB DDR3-1333 SDRAM mem-
ory, and 1 Gbit/s Ethernet NIC. NAS is always ac-
cessed by the source and the destination servers.
Both physical machines run under Fedora 15
6
(Linux kernel v. 2.6.38, x86
64) operating system.
6
Fedora 15. http://fedoraproject.org/.
CLOSER2014-4thInternationalConferenceonCloudComputingandServicesScience
592
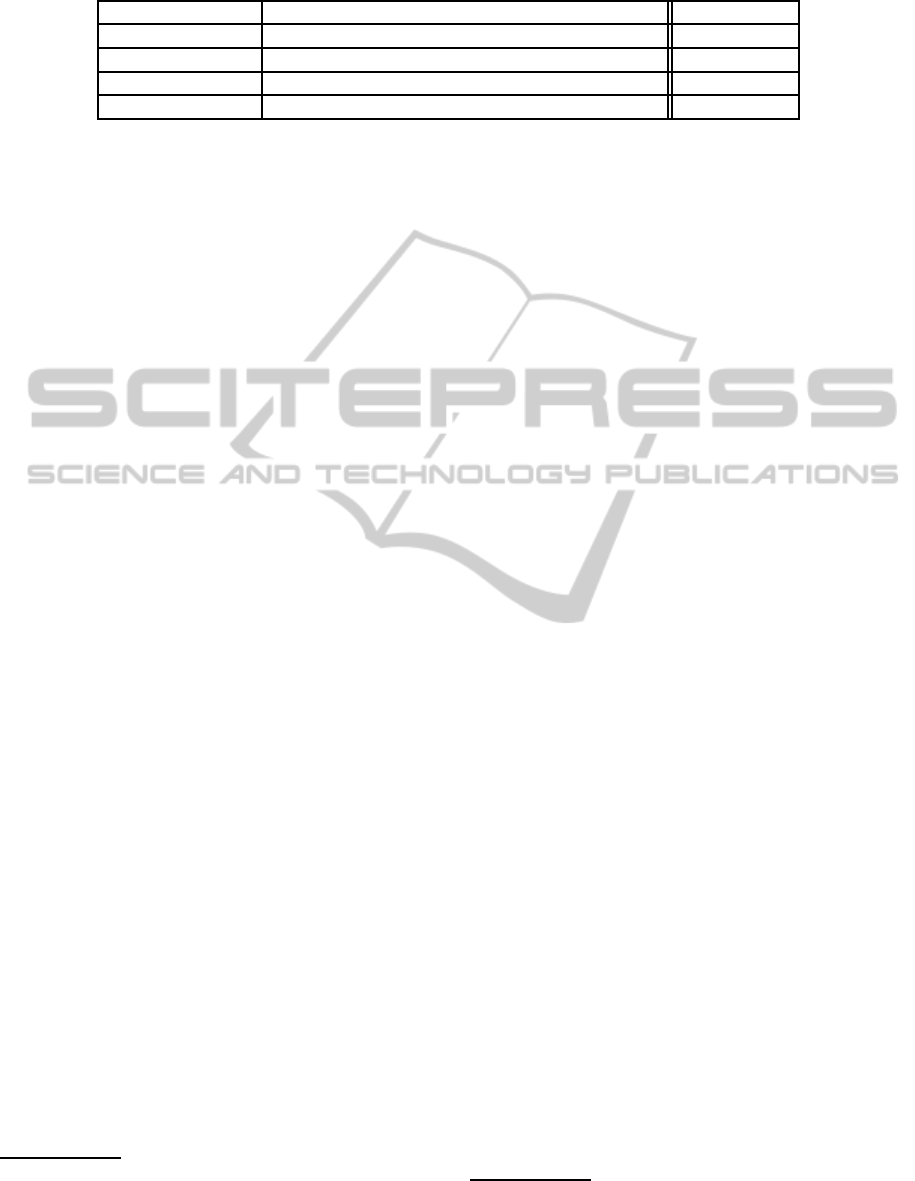
Table 1: Description of the benchmarks used in the experiments.
Benchmark name Description Runs on VM
464.h264ref CPU intensive; Integer benchmark VM1 - C1
444.namd CPU intensive; Floating point benchmark VM2 - C2
429.mcf Memory and CPU intensive; Integer benchmark VM3 - M1
401.bzip2 Memory and CPU intensive; Integer benchmark VM4 - M2
As a hypervisor we use KVM and apply a toolkit lib-
virt, to manage the interaction between the hypervi-
sor and the operating system during migration. Fur-
thermore, we installed a Virtual Machine Manager
7
(VMM). It is a desktop user interface which can be
used to create, configure, and manage VMs through
libvirt. Open source operating system FreeNAS
8
, is
used as the NAS.
All four virtual machines we migrated were al-
located 1 virtual CPU and 30 GB disc space on the
NAS. They run Fedora 15 as their operating system as
well. Two identical measurement devices (Yokogawa
WT210 digital power analyzers) are used to measure
the overall AC power consumption from two physical
machines between which the migration takes place.
These devices are able to measure DC and AC power
consumption at the rate of 10 Hz and a DC current
between 15 µA and 26 A. The four virtual machines
were executing as a workload benchmarks from the
SPEC CPU2006 benchmark suite.
4 EXPERIMENT
We run Spec CPU2006 benchmarks on four virtual
machines and perform the live migration of the VMs
from the source to destination server at the network
bandwidth of 100 MBps. Each VM runs its own
benchmark, is assigned one core, and is executed on
the separate core of the physical server. The bench-
mark 464.264ref is run on VM1. We depict this
VM on figures as C1 (see Table 1). The benchmark
444.namd is run on VM2, is depicted as C2; 429.mcf
is run on VM3 and is depicted as M1; and 401.bzip2
is run on VM4 and is depicted as M2.
In order to be able to reason about interference
effects and their influence on the migration time, we
were migrating all four VMs from the source server to
destination server sequentially one after another till
the source server was running idle (see Use case 1).
We did the experiment for all possible permutations
of four virtual machines, which resulted in (4!) 24
7
Virtual machine manager. http://virt-manager.org
8
Freenas: Storage for open source.
http://www.freenas.org/.
migration permutations (see Table 2).
The benchmarks are continuously running on the
virtual machines during live migration. This means
that during measurements, different functions of the
benchmarks were executing. Hence, there are some
discrepancies in terms of migration times. These have
been minimized by having a higher number of migra-
tion iterations, namely ten repetitions for every per-
mutation of VMs, so that statistical consistency is
maintained. Every experimental run for each permu-
tation was done ten times, in all, there were 240 mi-
grations done for 24 test cases.
During the measurements, we ran the dstat
9
pro-
gram on the source and destination servers, as well as
VMs to observe and record resource utilization (CPU
and memory). The migration data, namely the begin-
ning of migration, migration duration of each VM in
the permutation, and the end time of migration were
saved as .csv files in the client machine to enable fu-
ture analysis. Before the experiments took place all
the servers were time synchronized in order to accu-
rately determine the beginning and the end of a VM
migration.
Besides the resource utilization and migration
times we also recorded the power consumption of the
two servers to enable our future work on the energy
overhead of migration of multiple VMs (see Equa-
tion 1).
5 OBSERVATIONS AND RESULTS
We will step by step address the three goals (1), (2),
(3) set in this paper.
(1) In agreement with other research works (Clark
et al., 2005) we experimentally proved that the mi-
gration time depends on the type of workload running
on the VM. Figure 3 displays the average migration
time of each of the four VMs which were execut-
ing their corresponding SPEC CPU2006 benchmarks
during migration. We can see that virtual machine
C2 needed on average about 50 seconds less for mi-
gration than virtual machine M1. It can be explained
9
dstat: Resource statistics tool.
http://linux.die.net/man/1/dstat
AnalysingtheMigrationTimeofLiveMigrationofMultipleVirtualMachines
593
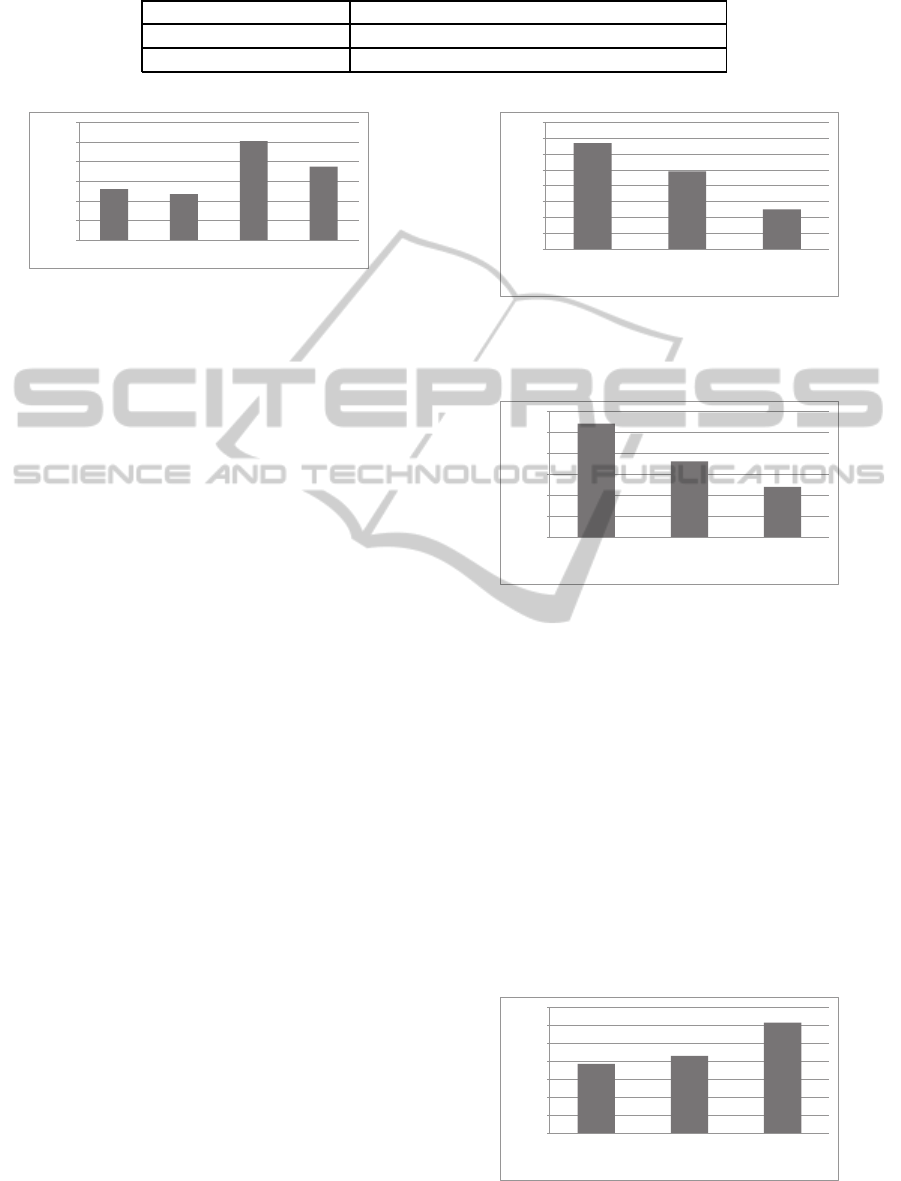
Table 2: Migration settings.
Benchmark name 464.h264ref; 444.namd; 429.mcf; 401.bzip2
Bandwidth 100 MBps
VMs permutations (4!) C1C2M1M2; C1C2M2M1; ... M2M1C2C1
52
47
101
75
0
20
40
60
80
100
120
C1
C2
M1
M2
Average migration time, sec
Figure 3: The average migration times of each VM over
all the experiments. Each VM is running one of prescribed
SPEC CPU2006 benchmarks. Network bandwidth is 100
MBps.
by the nature of workload running on these machines
and the pre-copy migration approach. M1 is the VM,
which is running in this test-case the most memory
intensive benchmark (429.mcf). Thus, more memory
pages have to be copied between two servers and dur-
ing the migration process more pages might be dirtied
and need to be resent. This results in high migration
times. In agreement with the works of (Clark et al.,
2005), (Strunk and Dargie, 2013) we are in a position
to say that the migration time is proportional to the
VM’s memory volume (RAM) which has to be copied
and sent between two servers. On the contrary VM C2
is executing predominantly CPU intensive tasks that
resulted in smaller migration times (47 seconds). VM
C1 is running CPU intensive tasks with slightly higher
memory utilization than C2, that is why C1 needed in
average more time to be migrated.
Thinking about the bin-packing problem (see Use
case 2), where e.g. only one or some of the VMs have
to be migrated from the overloaded to underutilized
servers for load balancing reason, we are in a position
to say that the best VM candidates would be the
• VMs running CPU intensive tasks rather than
memory intensive tasks. As the migration time
for the former is smaller and the services running
on such VMs are less likely to be degraded.
This assumption was confirmed by our experi-
ment, hence VM C2 would be a better candidate to
migrate than VM M1 (see Figure 3).
(2) We migrated four VMs from the source to the
destination server in all 24 possible permutations. Af-
terwards we analysed the total migration time of each
single VM in all the permutations and made the fol-
lowing observations:
• when running multiple VMs on the source server
during migration the interference effects occur
67
49
25
0
10
20
30
40
50
60
70
80
C2_M2_M1_C1
C1_C2_M2_M1
M1_M2_C1_C2
Migration time, sec
Order at which the VMs were migrated
Figure 4: Migration time of the virtual machine C2, ex-
ecuting 444.namd benchmark, when migrated in the three
displayed permutations at the network bandwidth of 100
MBps.
107
98
92
80
85
90
95
100
105
110
M1_M2_C1_C2
C1_M1_C2_M2
C2_M2_C1_M1
Migration time, sec
Order at which the VMs were migrated
Figure 5: Migration time of the virtual machine M1, ex-
ecuting 429.mcf benchmark, when migrated in the three
displayed permutations at the network bandwidth of 100
MBps.
and they significantly influence the migration
time.
For better visibility and presentation of results we se-
lected each time three out of the 24 VM’s migration
permutations in the following-up figures.
At first all four VMs are runningon the source ma-
chine and then they are one by one migrated from it
to the destination machine. Figure 4 displays the av-
erage migration time of the single virtual machine C2
in the three following permutations: C2-M2-M1-C1,
C1-C2-M2-M1, and M1-M2-C1-C2. We can clearly
193
215
307
0
50
100
150
200
250
300
350
M1_M2_C2_C1
M1_C1_C2_M2
M2_C2_C1_M1
Average migration time, sec
Order at which the VMs were migrated
Figure 6: The summed migration time of four VMs in the
described permutations.
CLOSER2014-4thInternationalConferenceonCloudComputingandServicesScience
594

193
246
290
0
50
100
150
200
250
300
350
M1_M2_C1_C2
M1_C2_M2_C1
C1_C2_M2_M1
Average migration time, sec
Order at which the VMs were migrated
Figure 7: The summed migration time of four VMs in the
depicted permutations.
see the influence of the interference effects on the mi-
gration time of C2. In the first permutation the VM
C2 is migrated first from the source machine, namely
when VMs M2, M1 and C1 are normally executing
on the source machine. We can see that the migra-
tion time in this case is the biggest, namely 67 sec-
onds. In this situation the hypervisor fairly allocates
the CPU cycles first to the running VMs and then to
migration process. And as there are not enough free
resources on the source host to cover the migration
overhead, the migration time is high. In the second
displayed permutation virtual machine C2 is migrated
after VM C1 has already been migrated to the desti-
nation server, thus migration process gets more CPU
cycles and the migration now is realized faster. In
the last third depicted permutation C2 is migrated in
the last case from the source machine, thus having
more than enough free resources to cover the migra-
tion overhead, thus the smallest 25 seconds migration
time. This applies also for other VMs (see for ex-
ample Figure 5 for the virtual machine M1). When
M1 is migrated at the first, second and the last place
in permutations its migration time is 107, 98 and 92
seconds correspondingly.
(3) Then, we investigated the time needed to free
the source server e.g. for maintenance reason or with
the aim to power it off and save energy. It is the
summed total migration time needed to migrate four
VMs from the source to the destination server. We
did the experiment for all 24 possible permutations
of four VMs and made the following observations re-
garding migration time patterns:
• It is better to migrate virtual machines running
more intensive benchmarks first for the case when
all VMs have to be migrated from the server (Use
case 1).
Having the knowledge about utilized bench-
marks from Oprofile and resource utilization statis-
tics (dstat), we can conclude that between memory
benchmarks, M1 is running a more intensive bench-
mark compared to M2. The same conclusion can be
made for C1 being more intensive than C2, as besides
being CPU intensive C1 also causes slight utilization
of the memory subsystem.
Figure 6 presents the total migration time of all
four VMs in three depicted permutations. The per-
mutations M1-M2-C2-C1 or M1-C1-C2-M2 need less
time to be migrated than M2-C2-C1-M1. It can be
explained by the fact, that the migration (pre-copy
and stop-and-copy phases) requires additional CPU
cycles.The hypervisor first allocates resources to the
running VMs, and then to the migration process. And
thus, migrating first intensive tasks releases more re-
source for allocating them to the migration process of
other VMs.
• When the goal is to free the server (migrate all
VMs), then it is better to migrate virtual machines
running the memory intensive benchmarks first
rather than machines running CPU benchmarks
(for Use case 1).
In Figure 7, the permutation M1-M2-C1-C2 has
the least migration duration. And the total migration
time is 97 seconds less than for permutation C1-C2-
M2-M1. Which is quite a considerable value, that
would allow to power off the source machine 1,5 min-
utes faster and reduce the total migration time and at
the same time the service degradation time. The VMs
during migration are executing only on the source ma-
chine. The hypervisor labels all memory pages occu-
pied by the VM as read only. When some of the mem-
ory pages were overwritten during the migration (pre-
copy iterations), the exception will be raised that the
memory pages are faulted and have to be resent. Thus,
the more memory intensive benchmarks are running,
the more they modify the memory and use CPU, so
migrating them first reduces the total migration time.
Thus, if one follows the goal to migrate exactly
all VMs from the source host in order to switch it off,
then considering the migration patterns might be ben-
eficial.
6 RELATED WORK
Workload consolidation realized via live VM migra-
tion has been investigated in many research works
(Akoush et al., 2010), (Wu and Zhao, 2011), (Kuno
et al., 2011), (Andreolini et al., 2010), (Mi et al.,
2010), (Orgerie et al., 2010), (Imada et al., 2009).
The costs of migration process considered in the lit-
erature so far, were summarized in a survey paper
(Strunk, 2012). The main migration costs addressed
in research works are the total migration time and the
service downtime. For the services which are running
in VMs the migration time is at the same time their
performance degradation time (Wu and Zhao, 2011).
Clark et al. (Clark et al., 2005) reveals that the migra-
tion process slows down the transmission rate of the
AnalysingtheMigrationTimeofLiveMigrationofMultipleVirtualMachines
595

Apache Web Server by up to 20%. Kuno et al. (Kuno
et al., 2011) analysed the processing speed of CPU-
intensive and the reading speed of IO-intensive appli-
cations during migration process. The performance
of CPU intensive processes reduced by 15%. When
additionally starting memory writing process on the
same VM the performance declined by 40%. So it is
important to minimize migration time and to under-
stand the main parameters that influence it.
Wu et al. (Wu and Zhao, 2011) established a per-
formance model which enables to derive dependency
between the resource allocation (CPU) to the migra-
tion process and VM migration time. They set up four
models for each of the application types (CPU, mem-
ory, disk I/O, and network I/O intensive) running in
isolation on the migrated VM. They proved that the
migration process requires additional CPU cycles and
increasing the CPU share for migration process from
10% to 50% resulted in shorter migration times. But
the VMs were running in isolation, and this scenario
does not account for the interference effects which oc-
cur when several VMs with different workloads are
running on the server when the migration takes place.
In (Rybina et al., 2013) the authors investigated
the migration time and energy overhead of single VM
migration under varying parameters such as available
network bandwidth, size of the VM, and different
CPU intensive workloads. It was revealed that migra-
tion time depends on the size of VM and the network
bandwidth. Migration time decreases with higher net-
work bandwidth and smaller VM size (RAM), which
was also proved by Strunk et al. (Strunk and Dargie,
2013). But the other workloads rather than CPU in-
tensive were not considered and the VMs were run-
ning in isolation which is not usually the case in real
world scenario.
The negative interference effects of co-locating
different workloads on the server have been inves-
tigated (Govindan et al., 2011). The interference
happens even when running workloads on the sepa-
rate processor cores, because the applications share
the same resources such as cashes, memory chan-
nels, networking devices and storage (Delimitrou and
Kozyrakis, 2013), (Govindan et al., 2011). But to the
best of our knowledge the influence of interference
effects on the live migration of multiple VMs was not
addressed for far.
In our work we are going to migrate multiple vir-
tual machines and to run on these VMs different types
of workloads, thus to enable us to investigate into the
interference effects and discover how the total migra-
tion time is influenced by them.
7 CONCLUSION
In this paper, we investigate the VM migration costs,
namely VM migration time. We showed that the
migration time depends on the interference effects
caused by simultaneously running multiple virtual
machines with different workloads on the source
server when the migration was taking place. We mi-
grated four VMs one after another from the source
server to destination server in 24 possible permuta-
tions. Each of these VMs was running memory and/or
CPU intensive benchmark from the SPEC CPU2006
benchmark suite. We migrate VMs at a bandwidth of
100 MBps. During migration we were recording the
migration time, the resource utilization (CPU, mem-
ory) of both servers as well as the the power consump-
tion.
We addressed three main goals with our experi-
ment, namely how the migration time is influenced
by (1) workload running on the VM, (2) interference
effects which occur; and (3) we discovered the mi-
gration patterns which might be applicable when all
VMs have to be migrated from the source server. Our
experiment observations are as follows:
1. The migration time depends on the type of work-
load running on the VM and it is proportional to
the volume of memory which has to be copied
and sent between source and destination server.
This observation is in agreement with other re-
search work results (Clark et al., 2005), (Strunk
and Dargie, 2013);
2. We showed that interference effects occur when
running multiple VMs with different workloads
on the source machine during migration and they
significantly influence the migration time.
3. We discovered the migration patterns, that might
be used in case all VMs have to be migrated from
the source server, in order to repair or to switch it
off.
• It is better to migrate virtual machines running
more intensive benchmarks first. Hence, per-
mutations of VMs M1-M2-C2-C1 or M1-C1-
C2-M2 need less time to be migrated than M2-
C2-C1-M1.
• It is better to migrate virtual machines run-
ning the memory intensive benchmarks first
rather than machines running CPU bench-
marks. Hence, permutation M1-M2-C1-C2 is
better than C1-C2-M2-M1.
In our follow-up experiments, we will go into
details of quantifying the interference effects of co-
located VMs and their influence on the migration
times. We will also continue our work on deriving the
CLOSER2014-4thInternationalConferenceonCloudComputingandServicesScience
596

energy overhead of migration of multiple VMs and
modelling it.
ACKNOWLEDGEMENTS
This work has been partially funded by the German
Research Foundation (DFG) under project agreement:
SFB 912/1 2011.
REFERENCES
Akoush, S., Sohan, R., Rice, A., Moore, A., and Hopper,
A. (2010). Predicting the performance of virtual ma-
chine migration. In Modeling, Analysis Simulation
of Computer and Telecommunication Systems (MAS-
COTS), 2010 IEEE Int. Symposium on, pages 37 –46.
Andreolini, M., Casolari, S., Colajanni, M., and Messori,
M. (2010). Dynamic load management of virtual ma-
chines in cloud architectures. In Avresky, D., Diaz,
M., Bode, A., Ciciani, B., and Dekel, E., editors,
Cloud Computing, volume 34 of Lecture Notes of the
Institute for Computer Sciences, Social-Informatics
and Telecommunications Engineering, pages 201–
214. Springer Berlin Heidelberg.
Beloglazov, A., Abawajy, J., and Buyya, R. (2012). Energy-
aware resource allocation heuristics for efficient man-
agement of data centers for cloud computing. Future
Generation Computer Systems, 28(5):755 – 768.
Clark, C., Fraser, K., Hand, S., Hansen, J. G., Jul, E.,
Limpach, C., Pratt, I., and Warfield, A. (2005). Live
migration of virtual machines. In Proceedings of the
2nd conference on Symposium on Networked Systems
Design & Implementation - Volume2, NSDI’05, pages
273–286, Berkeley, CA, USA. USENIX Association.
Delimitrou, C. and Kozyrakis, C. (2013). Paragon: Qos-
aware scheduling for heterogeneous datacenters. In
Proceedings of the Eighteenth International Confer-
ence on Architectural Support for Programming Lan-
guages and Operating Systems, ASPLOS ’13, pages
77–88.
Gerofi, B., Fujita, H., and Ishikawa, Y. (2010). An efficient
process live migration mechanism for load balanced
distributed virtual environments. In Cluster Comput-
ing (CLUSTER), IEEE Int. Conference on, pages 197–
206.
Govindan, S., Liu, J., Kansal, A., and Sivasubramaniam,
A. (2011). Cuanta: Quantifying effects of shared on-
chip resource interference for consolidated virtual ma-
chines. In Proceedings of the2Nd ACM Symposium on
Cloud Computing, SOCC ’11, pages 22:1–22:14.
Imada, T., Sato, M., and Kimura, H. (2009). Power and qos
performance characteristics of virtualized servers. In
Grid Computing, 2009 10th IEEE/ACM International
Conference on, pages 232–240.
Jaleel, A. (2010). Memory characterization of workloads
using instrumentation-driven simulation. Web Copy:
http://www. glue. umd. edu/ajaleel/workload.
Kofler, M. and Spenneberg, R. (2012). Kvm fuer die server-
virtualisierung - von konfiguration und administra-
tion bis clustering und cloud. In ADDISON-WESLEY,
ISBN 978-3-8273-3149-6.
Koomey, J. (2011). Growth in data center electricity use
2005 to 2010. Technical report.
Kuno, Y., Nii, K., and Yamaguchi, S. (2011). A study
on performance of processes in migrating virtual
machines. In Autonomous Decentralized Systems
(ISADS), 10th Int. Symposium on, pages 567 –572.
Li, B., Li, J., Huai, J., Wo, T., Li, Q., and Zhong, L. (2009).
Enacloud: An energy-saving application live place-
ment approach for cloud computing environments. In
IEEE CLOUD’09, pages 17–24.
Liu, H., Xu, C.-Z., Jin, H., Gong, J., and Liao, X. (2011).
Performance and energy modeling for live migration
of virtual machines. In Proceedings of the 20th int.
symposium on High performance distributed comput-
ing, HPDC ’11, pages 171–182, NY, USA. ACM.
Mi, H., Wang, H., Yin, G., Zhou, Y., Shi, D., and Yuan, L.
(2010). Online self-reconfiguration with performance
guarantee for energy-efficient large-scale cloud com-
puting data centers. In Services Computing (SCC),
2010 IEEE International Conference on, pages 514–
521.
Orgerie, A.-C., Lefevre, L., and Gelas, J.-P. (2010). De-
mystifying energy consumption in grids and clouds.
In Green Computing Conference, 2010 International,
pages 335–342.
Rybina, K., Dargie, W., Strunk, A., and Schill, A. (2013).
Investigation into the energy cost of live migration of
virtual machines. In Sustainable Internet and ICT for
Sustainability (SustainIT), pages 1–8.
Strunk, A. (2012). Costs of virtual machine live migration:
A survey. In Services (SERVICES), 2012 IEEE Eighth
World Congress on, pages 323 –329.
Strunk, A. and Dargie, W. (2013). Does live migration of
virtual machines cost energy? In The 27th IEEE Int.
Conference on Advanced Information Networking and
Applications (AINA-2013).
Verma, A., Ahuja, P., and Neogi, A. (2008). pmapper:
Power and migration cost aware application place-
ment in virtualized systems. In Proceedings of the
9th ACM/IFIP/USENIX International Conference on
Middleware, Middleware ’08, pages 243–264, New
York, NY, USA. Springer-Verlag New York, Inc.
Wu, Y. and Zhao, M. (2011). Performance modeling of
virtual machine live migration. In Cloud Computing
(CLOUD), 2011 IEEE Int. Conference on, pages 492–
499.
AnalysingtheMigrationTimeofLiveMigrationofMultipleVirtualMachines
597
