
Integrating Computers, Science, and Mathematics
A Course for Future Mathematics Teachers
Alfinio Flores
Department of Mathematical Sciences, University of Delaware, Newark, DE, U.S.A.
Keywords: Mathematics Teaching, Integration of Technology, Teacher Preparation, Geogebra, Python, Modeling,
Robotics.
Abstract: A course for prospective secondary mathematics teachers was developed at the University of Delaware,
based on professional recommendations to integrate science, technology, engineering, and mathematics in
the preparation of teachers of mathematics. Students used GeoGebra, Cabri3D, and Mathematica to model
phenomena in the physical, natural and social sciences. They used motion sensors and graphing calculators
to study motion. They wrote Python programs to simulate random phenomena. They built a robot and
controlled it with a computer program, and made explicit the mathematical and scientific concepts involved
in the functioning of the robot. Several forms of formative and summative assessment were conducted
during the course. Teachers learned alternative ways of looking at mathematical concepts, and established
connections in mathematics and with other areas.
1 INTRODUCTION
Technological environments offer opportunities to
students of different skills and levels of
understanding to engage with mathematical tasks
and activities (Hollebrands, 2007). However, the
integration of technology in mathematics teaching
has been slower than anticipated due to multiple
difficulties teachers face (Hohenwarter,
Hohenwarter, & Lavicza, 2008). Having the
technology available in schools is not enough to
guarantee that teachers will know how to use it to
teach mathematics. Future and in-service teachers
need to have opportunities to develop the expertise
and know-how to be able to incorporate the use of
technology in their own teaching (Lawless &
Pellegrino, 2007).
The new course Learning mathematics with
technology offered at the University of Delaware is
geared for first-year prospective secondary
mathematics teachers. The purpose of the course is
to provide future mathematics teachers, early in their
teacher preparation program, with the knowledge
and experience of technology-based activities that
foster mathematical communication, connections,
reasoning, and reflection that help students develop
better understanding in mathematics. The course
integrates modern interactive technologies to
emphasize the learning of concepts, problem
solving, exploration in mathematics, mathematical
modeling, and connections to physics and other
sciences. The course is based on current research
and theories about how students best learn
mathematics (Boaler, 2008), incorporates
professional recommendations on the preparation of
teachers of mathematics and the type of mathematics
they need to experience and learn themselves
(Conference Board of the Mathematical Sciences,
2012; National Council of Teachers of Mathematics,
2000; Common Core State Standards, 2010,
National Research Council, 2002, 2011) and
incorporates best teaching practices. The use of
writing to learn mathematics is an important
component of the course.
2 CONTENT KNOWLEDGE FOR
MATHEMATICS TEACHERS
This course emphasizes pedagogical content
knowledge (Shulman, 1986, 1987) for mathematics
teachers. The students learn new technology,
connections of mathematics with science, and a
richer set of connections among high school
mathematical concepts. The course implements
246
Flores A..
Integrating Computers, Science, and Mathematics - A Course for Future Mathematics Teachers.
DOI: 10.5220/0004942402460251
In Proceedings of the 6th International Conference on Computer Supported Education (CSEDU-2014), pages 246-251
ISBN: 978-989-758-021-5
Copyright
c
2014 SCITEPRESS (Science and Technology Publications, Lda.)
strategies and methodologies to learn and teach
mathematics with technology that could be used by
future teachers in their own classrooms. Students
actively participate in mathematical modeling of
physical, biological, and social phenomena (Gordon
& Gordon, 2010) using a variety of technology
tools, such as TI CBR 2 motion sensors and
GeoGebra (International GeoGebra Institute, 2013).
They also use hands-on materials and the computer
to further develop their own understanding of
mathematics concepts, such as conics. Throughout
the course, students use Python (Enthought, 2013)
and other programming platforms to write their own
short computer programs that involve the use of
loops (FOR or WHILE) and the use of logical
structures such as IF…ELSE.
How to work in cooperative groups was
explicitly discussed several times during the
semester. One students wrote in his end of class
reflection: “At the beginning of class, when we
talked about the concept of working together in a
group, it helped me better understand how to truly
work together and feed off of each other’s ideas.
Communication as they said, is the most important
thing about it and that helped me truly understand
the concept.”
2.1 Motion Sensors, Velocity, and
Acceleration
Students conducted several experiments with
moving objects. They captured data for position vs.
time with motion detectors and analyzed the
corresponding graphs. The very first day they used
constant-velocity vehicles (Printz, 2006). They
followed with the 7 m jump of a small stuffed toy
donkey hanging from a parachute. Students collected
distance vs. time data and described how the
different phases of the fall were reflected on the
graph (before the parachute was completely
deployed and after), and how the corresponding
parts of the graph represented constant positive
acceleration or constant velocity (initial accelerated
motion followed by falling at the terminal velocity).
One student wrote about the parachute activity on
her end of class reflection: “The effect air resistance
has on acceleration and velocity of a falling object
was a concept today’s lesson clarified for me.”
Students also captured distance vs. time data for
a bouncing basketball and analyzed the
corresponding graph (Cory, 2010), to determine
when the velocity was positive or negative, when
was the velocity increasing or decreasing, when was
it zero, etc. Especially challenging for them was to
interpret what was happening to the velocity when
the ball hit the ground.
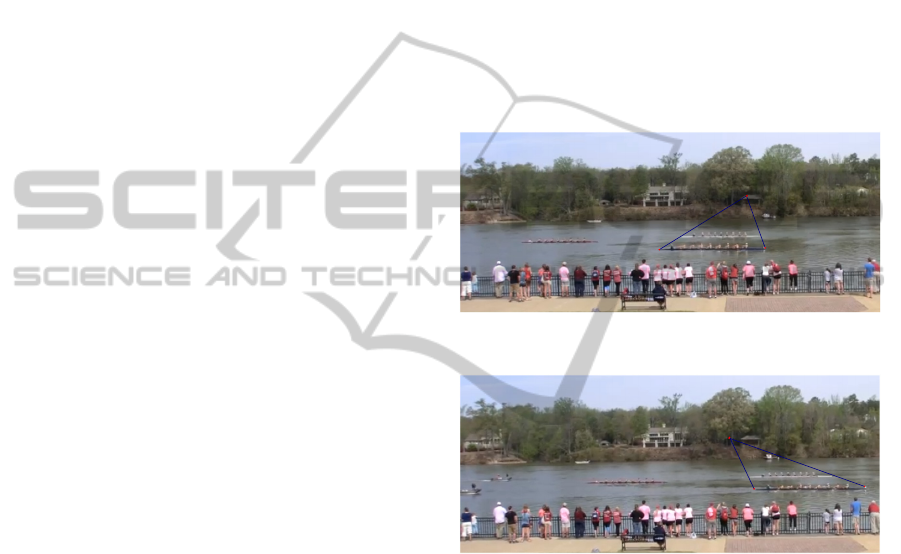
2.2 Vanishing Points in a Rowing
Competition
Students watched a video of a rowing competition
(Allain, 2013) and then used GeoGebra and their
knowledge of perspective and vanishing points
(Figure 1 and Figure 2) to devise a way to determine
who was winning the competition. Then they wrote
a letter to a fictional television producer explaining
the advantages of their method to make it easier for
television viewers to see wheter a scull was moving
faster than another.
Figure 1: Vanishing point at t = 34.
Figure 2: Vanishing point at t = 38.
2.3 Fitting Curves to Sets of Points
Students learned ways in which GeoGebra provides
an alternative point of entry to the topic of fitting
linear and quadratic curves to two or three points.
First they played a game in pairs. One player would
position two or three points on the screen, and the
other player would use sliders corresponding to the
coefficients of linear or quadratic functions and
adjust the value of the slider to hit as many points as
possible. Students expressed that using sliders
allowed them to understand better the role of each of
the coefficients, and the advantages and
disadvantages of using different representations for
quadratic functions, such as using the coordinates (h,
k) of the vertex in the equation y = a(x - h)
2
+ k or
using the general equation y = ax
2
+ bx + c. In
another activity students used sliders to
IntegratingComputers,Science,andMathematics-ACourseforFutureMathematicsTeachers
247
experimentally fit a parabola to a set of data
representing annual growth of redwood trees vs.
rainfall.
Later, students used sliders also to fit other types
of curves such as exponential functions. Sliders were
used in addition to analytical ways to determine the
parameters of the exponential function. One activity
was to fit an exponential model to the growth of the
population in the United States during its first
century.
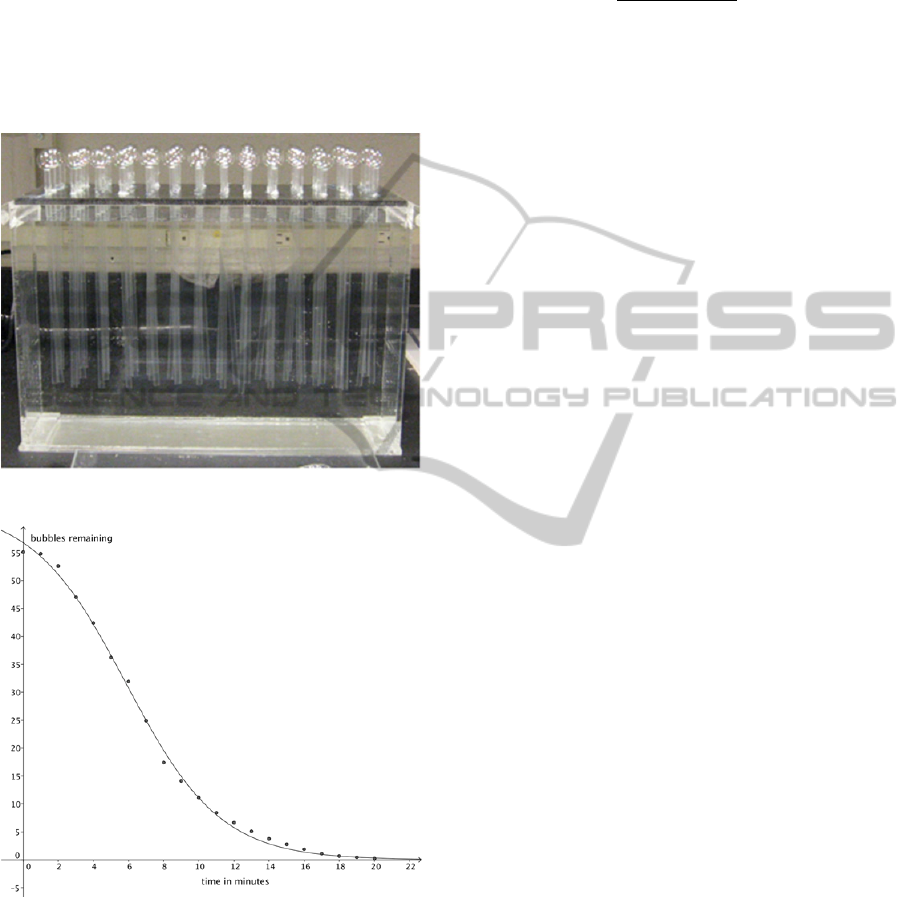
Figure 3: The Bubble Board.
Figure 4: Fitting a logistic curve to the bubble data.
In another activity students generated 56 soap
bubbles simultaneously with a bubble board (see
Figure 3) (Hammons, Flores, Pelesko, Biehl, 2012)
and recorded how many bubbles remained after
intervals of one minute. Then they were given the
data of the averages of nine such experiments and
were asked to use GeoGebra to fit different
mathematical models to the data (linear, quadratic,
polynomial, exponential, and logistic) and discuss
the advantages and disadvantages of each of the
models. Students found that a logistic model
y
63.1
1 0.11e
0.37 x
(1)
fit the data pretty well in the case of the bubbles
(Figure 4).
2.4 Conics
In the United States often students’ first encounter
parabolas and other conics through equations such as
y = x
2
. Although textbooks mention that such curves
can be obtained by slicing a cone, students usually
do not have the opportunity to connect the different
characterizations of conics. For example, for the
ellipse, the curve can be described by the equation;
using the locus definition (the sum of the distances
to two fixed points is constant); by slicing a cone
with a plane such that the angle of cut is bigger than
the angle at the vertex of the cone; or in terms of the
ratio of the distance from a point to a line and to a
fixed point (focus-directrix). In this course students
had the opportunity to establish connections among
the different ways of characterizing conics using
hands-on models, GeoGebra, and Cabri3D. One
student expressed in her exit ticket: “Cabri3D helped
me understand conic sections better. For the
parabola, it helped me see that the distance to the
directrix and focus is equal.”
2.5 Python Programs to Simulate
Random Phenomena
The instructor conducted several short sessions
where a situation was presented, and then the class
as a whole, using plain English, described the steps
that needed to be included in a computer program to
simulate the situation. For example, one die is
tossed 1000 times. The program should keep track of
how many Heads and Tails have occurred. After
each toss the program determines who is in the lead
and keeps track how many times each player has
been in the lead. At the end the total number of
outcome for heads and tails are displayed, and also
how many times each player was in the lead, and
how many times they were tied. The instructor then
shared a program that would simulate the tossing of
the die and keeping track of the outcomes in the
desired way.
Students also did some thought experiments
about situations involving random events and then
CSEDU2014-6thInternationalConferenceonComputerSupportedEducation
248
compared their results with those generated by a
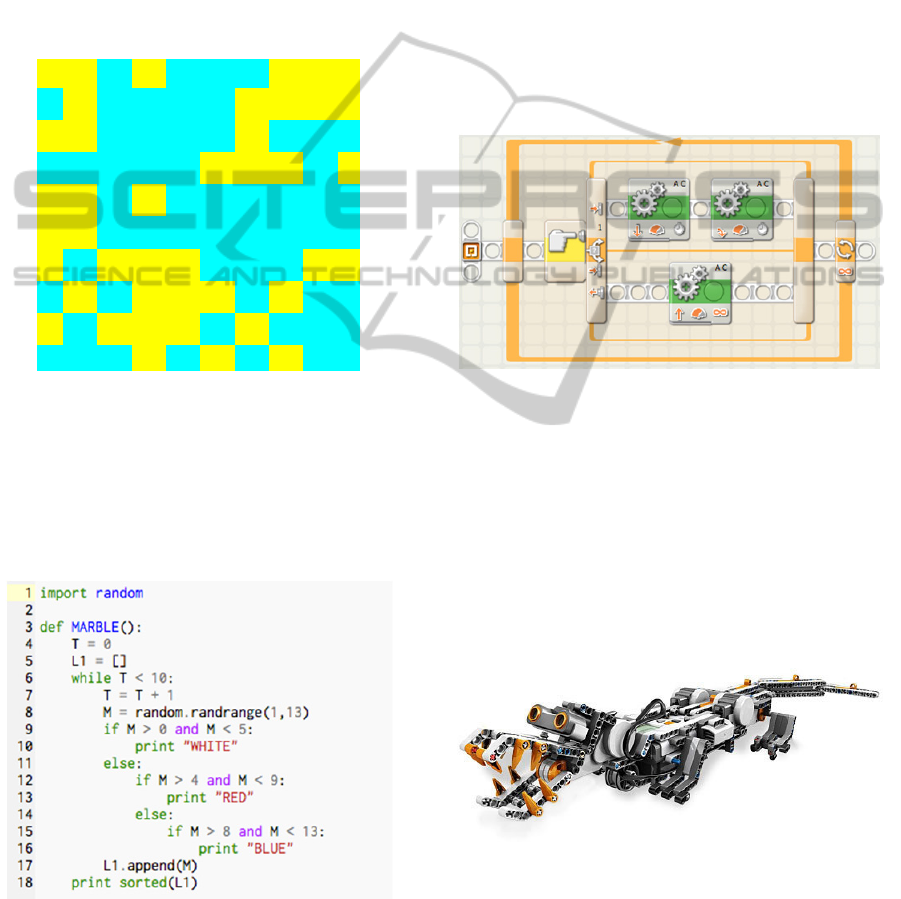
computer. For instance, students were asked to
conduct a thought experiment of tossing a fair coin
100 times and fill a 10 by 10 table with the
outcomes. Students thought simulations resulted in
very fragmented tables, where tails and heads
alternate frequently. Students were then given tables
generated with Mathematica (Figure 5) to compare
the distributions of the number of squares in the
largest “island of randomness” (Flores, 2006) in
their thought experiments and those generated by the
computer.
Figure 5: Islands of randomness.
As one of their projects, students were asked to work
individually or in pairs to write their own program to
simulate a situation involving randomness. Two
students wrote a program to simulate random
sampling with replacement of marbles of three
different colors (Figure 6).
Figure 6: Random sampling with replacement.
2.6 A Robot and a Feedback Loop
The final project for the course is building a robot
controlled by a program that includes a feedback
loop. The instructor demonstrated in class a bumper
car. The bumper car moves forward until it bumps
into a wall. It moves back for one second, and turns
for 1.5 seconds, and then repeats the cycle. Thus,
inside the loop we want the bumper to do either of
two things. Change direction and rotate if it bumps
against an object, else keep moving forward if not.
Programs in Lego Mindstorms are constructed by
dragging icons, rather than typing code. For
example, the switch icon will open the IF…
THEN… ELSE part of the program. If the touch
sensor is pressed, the motor will execute the two
command on the upper part (move in reverse, and
turn). Else, the motor will continue moving forward
(Figure 7).
Figure 7: A program with a feedback loop.
One team of students chose to build a Robogator
(Figure 8). Students described the structure of the
program to control the Robogator in plain English:
IF an object is detected within 60 cm of the
ultrasonic sensor
THEN the legs will move the robot forward
infinitely
ELSE the robot does not move
IF the object is within 30 cm
THEN the jaws will open and close infinitely
Figure 8: Robogator.
Students also made explicit the scientific and
mathematical concepts involved with the robot
functioning: Velocity, speed, normal force,
momentum, friction, centripetal acceleration, torque,
feedback loops in nature depending on sensors. They
HHTHTTTHH
H
THTTTTHHH
H
HHTTTTHTT
T
TTTTTHHHT
H
HHTHTTTTT
T
HHTTTTTTT
T
HTHHHTTTH
H
THTHHHTHT
T
HTHHHTHTT
T
TTTHTHTHT
T
IntegratingComputers,Science,andMathematics-ACourseforFutureMathematicsTeachers
249

unpacked each one of these concepts further, for
example,
“Torque: The Robogator is applying torque in
order to move because its legs apply a force when
rotating around an axis, which would be the leg joint
to the motor. All of these legs are using the same
amount of torque to move at a constant speed.”
3 COURSE ASSESSMENT
Several forms of assessment were used throughout
the course, both formative and summative, ranging
from short answers in “exit tickets”, informal verbal
interviews, to a pre- and post-survey about conics,
and a survey of the class as a whole. Students’
learning was assessed through a midterm exam,
written assignments, and their reports and in-class
presentations of the final projects on Python
programs and Lego robots.
For the most part, students found the use of
technology for modeling exciting and illuminating.
After the first session a student wrote on her
reflection:
“It was surprising to begin experiments on the
first day of class; it set a captivating tone for the rest
of the semester. I was intrigued by the different
approaches each pair of students took. I look
forward to this class in order to improve my analysis
skills. Hands-on activities are an extremely helpful
tool in learning, and I am ready to have this class for
my future teaching career.”
At the end of the course, students were given a
card where they wrote on one side what to keep in
the course, and on the other what needed to be
changed or deleted. Seven out the ten participants
explicitly recommended to keep the use of
GeoGebra.
Students participated actively in cooperative
groups as they tackled complex tasks. Many had not
worked in groups before in mathematics, and found
the experience of learning from each other valuable.
One student stated that the group work and
collaboration with others “was good for learning
how others think and helped me think about math.”
Students found the course directly relevant for
their future as secondary mathematics teachers. In
addition, three peer tutors, more advanced
mathematics education students, who participated in
the course, also found this experience much more
relevant than the required computer science course
they took. Two of the peer tutors conducted an
independent study related to the course. H. Kretz
gave a survey about conics at the beginning of the
course and then again after the topic had been
covered. She found that in the beginning students
described conics using only formulas and equations,
with no mention of actually cutting a cone, or other
geometric properties. For example, one of the
students said “Each conic section is dependent on
the equation.” When asked how they would teach
the topic of conics, most students described also
approaches based on symbols, and only one student
mentioned the use of computers as a tool for
teaching conics. One student wrote “I would draw a
conic on the white board and I would show a
parabola on a calculator with y = x
2
and the textbook
to try looking at different equations for conics”. At
the end of the course, their descriptions of the conics
were more elaborated and they incorporated
additional geometric elements and more
connections. Likewise, at the end, the vast majority
of the students mentioned the use of computers for
teaching conics. A. Restrepo focused on students’
attitudes and dispositions towards the group work,
use of computers, and hands-on activities. After the
midterm she found that 90% of the students thought
that the hands-on activities helped them understand
and recall better.
4 CONCLUSIONS
Our course was quite successful in introducing
prospective teachers to alternative ways of looking
at mathematical concepts, emphasize connections
within mathematics, and with other areas. Van
Voorst (1999) found in a course for in-service
teachers that the use of interactive technology helped
mathematics teachers see mathematics “less
passively, as a set of procedures, and more actively
as reasoning, exploring, solving problems,
generating new information, and asking new
questions” (p. 2). We found similar changes with the
future teachers. Furthermore, our course illustrates a
point emphasized in professional recommendations
on the preparation of prospective teachers, that
teachers should have the opportunity to experience
content courses taught in the same way they are
expected to teach in High School, courses that
provide multiple points of entry to mathematical
concepts through the use of computers, hands-on
materials, and other tools. Students had also the
opportunity to experience the advantages of working
in cooperative groups and start developing their
skills for making the group work more productive.
The course will be taught again in the next
academic cycle.
CSEDU2014-6thInternationalConferenceonComputerSupportedEducation
250

ACKNOWLEDGEMENTS
This course was developed as part of the grant
Integrated Science and Mathematics Education: A
Model Course for Pre-Service Teachers (S.
Bernhardt, PI, A. Flores Co-PI, H. Shipman Co-PI)
funded by the National Science Foundation. All
opinions are of the author and do not necessarily
represent the position of the funding agency.
REFERENCES
Allain, R. (2013). Physics of rowing. Retrieved December
28, 2013, from http://www.wired.com/wiredscience/
2013/04/some-rowing-physics/
Boaler, J. (2008). Promoting ‘relational equity’ and high
mathematics achievement through an innovative
mixed ability approach. British Educational Research
Journal, 34(2), 167-194.
Common Core State Standards Initiative (2010). Common
Core State Standards for Mathematics. Retrieved
December 27, 2013, from http://www.
corestandards.org/
Conference Board of the Mathematical Sciences (2012).
The mathematical education of teachers II.
Providence, RI: American Mathematical Society.
Cory, B. L. (2010). Bouncing balls and graphing
derivatives. Mathematics Teacher, 104(3), 206-213.
Enthought (2013). Canopy Python. Retrieved December
28, 2013, from https://www.enthought.com/
downloads/
Flores, A. (2006). Using graphing calculators to redress
beliefs in the law of small numbers. In G. Burrill
(Ed.), Thinking and reasoning with data and chance
(pp. 291-304). Reston, VA: National Council of
Teachers of Mathematics.
Gordon, S. P. and Gordon, F. S. (2010). Functions, Data,
and Models: An applied approach to college algebra.
Washington, DC: Mathematical Association of
America.
Hammons, A. N., Flores, A., Pelesko, J. A., and Biehl, L.
C. (2012). The “Bubble Board” and curve fitting. Ohio
Journal of School Mathematics, No. 66, 9-16.
Hohenwarter, J., Hohenwarter, M., and Lavicza, Z. (2008).
Introducing dynamic mathematics software to
secondary school teachers: The case of GeoGebra.
Journal of Computers in Mathematics and Science
Teaching, 28(2), 135-146.
Hollebrands, K. F. (2007). The role of a dynamic software
program for geometry in the strategies high school
mathematics students employ. Journal for Research in
Mathematics Education, 38(2), 164-192.
International GeoGebra Institute (2013). GeoGebra.
Available from http://www.geogebra.org/cms/
download.
Kretz, H. (2013). Teaching mathematics with technology.
Unpublished independent study report. Newark, DE:
University of Delaware.
Lawless, K. A. & Pellegrino, J. W. (2007). Professional
development in integrating technology into teaching
and learning: Knowns, unknowns and ways to pursue
better questions and answers. Review of Educational
Research, 77(4), 575-614.
National Council of Teachers of Mathematics. (2000).
Principles and standards for school mathematics.
Reston, VA: National Council of Teachers of
Mathematics.
National Research Council (2002). Learning and
understanding: Improving advanced study of
mathematics and science in U.S. high schools.
Washington, DC: National Academy Press.
National Research Council (2011). Successful K-12 STEM
education: Identifying effective approaches in science,
technology, engineering, and mathematics.
Washington, DC: National Academies Press.
Printz, J. (2006). The buggy lab: Comparing displacement
and time to derive constant velocity. School Science
and Mathematics, 106(5), 261-266.
Restrepo, A. (2013). Research 2013. Unpublished
independent study report. Newark, DE: University of
Delaware.
Shulman, L. S. (1986). Those who understand: Knowledge
growth in teaching. Educational Researcher, 15(2), 4-
14.
Shulman, L. S. (1987). Knowledge and teaching:
Foundations of the new reform. Harvard Educational
Review, 57(1), 1-22.
Van Voorst, C. (1999). Technology in mathematics
teacher education. ICTE Educational Technology
Resource Library. Retrieved February 4, 2014 from
http://www.icte.org/t99_library/t99_54.pdf.
IntegratingComputers,Science,andMathematics-ACourseforFutureMathematicsTeachers
251
