
Exhaust Thermoelements Redundant Strategy to Improve
Temperature Reading Reliability and Serviceability
T. Addabbo, O. Cordovani, A. Fort, M. Mugnaini and V. Vignoli
Department of Information Engineering and Mathematics, University of Siena, 53100, Siena, Italy
Keywords: System Reliability, Availability, Thermal Sensors, Gas Turbine, System Redundancy.
Abstract: Pollution linked to power generation is strictly connected to gas turbine control algorithms and efficiency
performance. Parts life is affected by quality and type of combustion too. The control of the exhaust
temperature is therefore a key parameter to indirectly monitor the effectiveness of the combustion in all the
combustion chamber of an heavy duty gas turbine. Actually due to the high temperature and dynamics of
the combustion chambers the performance measurement of the combustion is achieved through indirect
pressure and temperature monitoring. Moreover, exhaust temperature monitoring may allow to avoid
dangerous situations connected to flame loose in combustion chamber and subsequent gas leak towards gas
turbine high temperature zone. A reliable readout configuration of such sensors may improve the system
overall safety too. In this paper the authors discuss about the best thermoelements configurations in order to
improve the reliability and serviceability performance in gas turbine in order to increase the system
efficiency during power generation.
1 INTRODUCTION
In recent years researchers focussed part of the
research efforts on power generation efficiency
measurement due to the fact that traditional and
renewable power sources have to be qualified not
only in terms of power quality and stability but also
in terms of overall system serviceability.
Therefore the efficiency of a power generation
site has been enhanced through the vision that higher
efficiency can be achieved through a life extension
of power generators parts. Modular (mixed)
generation sites where green power stations coexist
aside with traditional generation structures based on
gas turbine, for example, require outstanding
reliability and availability figures to supply power
baseline and power peak to the end users. Actually
reliability plays an important role to grant a power
plant capability and production over time while the
availability figures are used to estimate the plant
structure to arrange possible plant redundancies and
maintenance. Some authors have extensively studied
both reliability and availability of components up to
complex equipment to evaluate the impact of aging
on subsystem or system operating in a power
generation plant (Hua and Yang, 2011); (Mugnaini
et al., 2002); (Chowdhury and Koval, 2009);
(Ceschini et al., 2002). Traditional approached
exploit reliability block diagrams representations,
fault tree analysis (FTA) and homogeneous Markov
Modelling (MM) (Rao, 2005); (Birolini, 2010). Out
of these studies it is pointed out that even small
components failures like the ones which can take
place at sensor levels like the ones used for lube oil
temperature read out purposes or accelerometrics
sensors in journal bearing vibration monitoring can
lead to meaningful failure of huge parts of the
production site, with the consequent impossibility to
grant the nominal station power generation. Usually,
such studies are performed taking into account
constant failure and repair rates, because this allows
an easier formulation and modelling of the problem.
Some efforts (Mugnaini et al., 2002); (Fort et al.,
2013) have been done in order to improve the
modelling of the components failure rates
representation. For example dynamic changes of
failure rates over time allows to be more adherent to
real mission behaviour. Such researches proved that
this approach is effective with promising results but
its implementation on complex structure may require
an extensive effort for data collection and synthesis.
Some of the parts that have an impact on system
productivity reliability and safety are the
thermoelements used in gas turbine exhaust for
96
Addabbo T., Cordovani O., Fort A., Mugnaini M. and Vignoli V..
Exhaust Thermoelements Redundant Strategy to Improve Temperature Reading Reliability and Serviceability.
DOI: 10.5220/0004941500960100
In Proceedings of the 3rd International Conference on Smart Grids and Green IT Systems (SMARTGREENS-2014), pages 96-100
ISBN: 978-989-758-025-3
Copyright
c
2014 SCITEPRESS (Science and Technology Publications, Lda.)
temperature monitoring (Fort et al., 2013); (Catelani
et al., 2000); (Catelani et al., 2007). Such sensors are
widely exploited to monitor indirectly the behaviour
of the combustion of the gas turbine and to check the
temperature distribution on the high pressure wheel
to extrapolate information on the gas turbine
efficiency and on possible components thermal
stress. Unfortunately designers somehow don’t take
into consideration the impact of the sensor number
connected to the trip and control logics configuration
in assigning to a specific gas turbine a certain
number of thermoelements. This work aims in
providing an analysis on how a selected number of
different sensors configurations may present
reliability and serviceability differences which can
affect the overall system reliability and availability.
2 SYSTEM DESCRIPTION
The gas turbine exhaust temperature is monitored
through a certain number of thermoelements
(generally thermocouples) in order to provide
indication on the combustion gas temperature
distribution as well as on the combustion chamber
and liner performance.
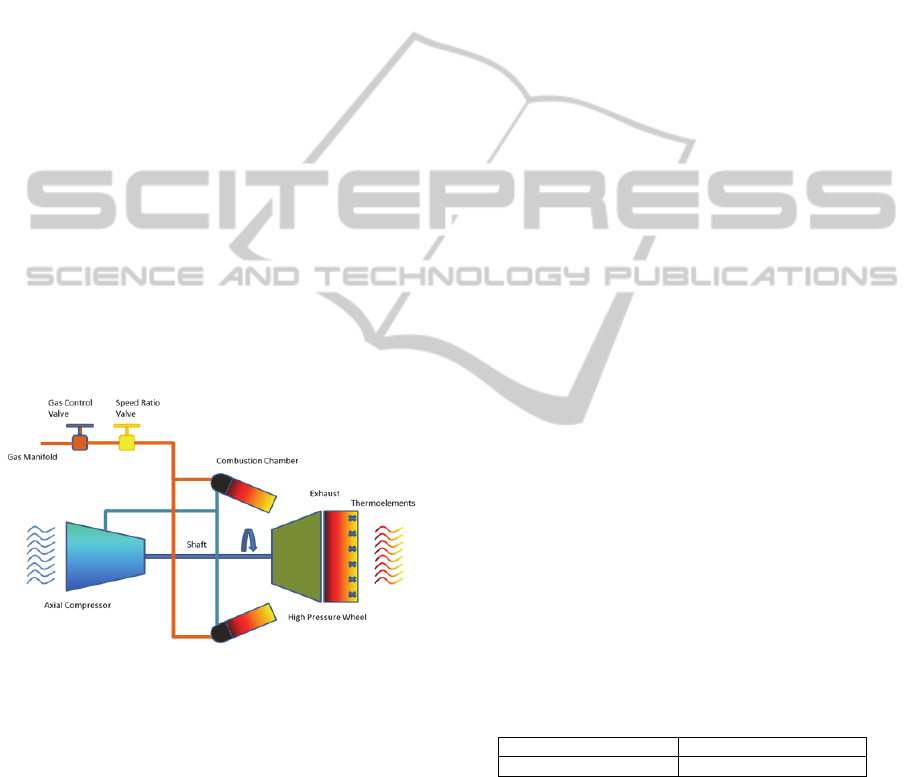
Figure 1: Simplified schematic of a gas turbine system
transversal section.
In Figure 1 a simplified schematic of a gas
turbine system transversal section is presented. It is
possible to identify the main gas manifold which
provides the system with the gas to be burned the
combustion chambers which are roundly and
symmetrically distributed around the gas turbine, a
couple of gas valves named gas control valve which
provides the main gas flow and the speed ration
valve used to control the main wheel speed rotation
respectively, the axial compressor which feeds with
compressed air the combustion chamber, the high
pressure wheel and the exhaust. Thermoelements for
temperature monitoring are usually placed on the
exhaust middle section on a radial geometry in order
to grant the combustion chamber uniformity
monitoring and complete mapping. Such sensors can
be either thermocouples or negative temperature
coefficient sensors dependently by the specific
turbine designer.
The aim of such sensor is to monitor the
temperature distribution of the exhaust and to
support in the diagnosis of anomalous conditions
like combustion malfunction in one of the chambers
with alarm or trip (stop) signals. Of course in case of
failure of one sensor it is barely unlikely to stop the
whole machine comparing the cost versus the
benefits of the operation. Nevertheless more than
one failure can induce a machine trip but this has to
be justified by a proper reliability/availability
analysis.
The number of sensors that are generally present
for temperature monitoring should take into account
at least three factors: the reliability impact of the
configuration according to the selected alarm/trip
logic, the availability considerations and the overall
system safety apportionment.
3 RELIABILITY AND
AVAILABILITY MODELING
Reliability (R(t)) techniques exploit reliability block
diagram modelling (RBD) (Mugnaini et al., 2002)
while availability (A(t)) approaches relying on
homogeneous Markov Modelling (flow state space)
are preferred when dealing with constant failure and
repair rates (Rao, 2005); (Birolini, 2010). With
respect to reliability studies the presented paper will
discuss about the figures of three different
configurations taking into account six
thermoelements, nominally identical, with a constant
failure rate according to Table 1.
Table 1: Single thermoelement failure rate.
Failure Rate [Failures/h]
λ 0.1*10
-6
The purpose is to evaluate which is the
configuration that best fits a new product application
on the reliability standpoint considering also the
availability, serviceability and safety aspects.
The configurations that will be considered are a
2oo6 that means that at least two thermoelement
over six have to be working to let the system
accomplish its mission, the 4oo6 configuration
where at least four element have to work and an
hybrid configuration of 3oo6 plus two consecutive
ExhaustThermoelementsRedundantStrategytoImproveTemperatureReadingReliabilityandServiceability
97
failure. This latter in particular consider that in order
to declare a system failure and therefore a system
trip, 4 or more thermoelements should fail or two
consecutive elements should fail. This additional
condition takes into consideration that fact that in
order to consider the system safety the temperature
control over a large section of the exhaust should not
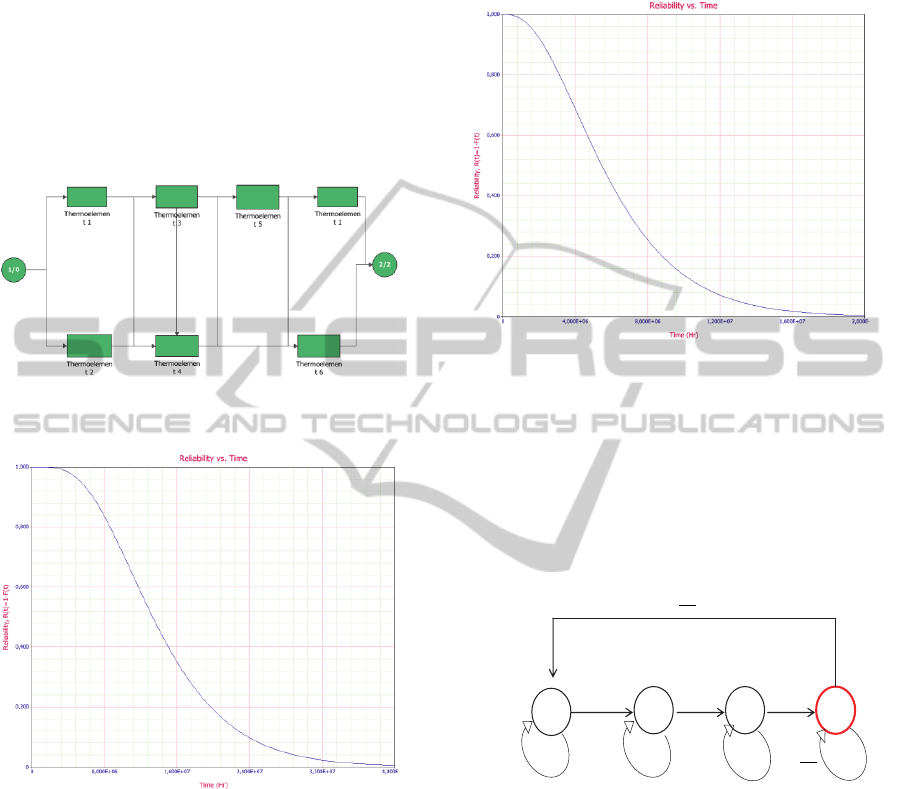
be lost. The system RBD is represented in Figure 2
where on the upper part there are the odd
thermoelements while in the lower part there are the
even ones.
Figure 2: Reliability Block Diagram (RBD) of a 3oo6 +2
consecutive failures configuration.
Figure 3: Reliability behaviour of a 2oo6 configuration
with λ=0.1e-6 F/h and µ=0.
In Figure 3 there’s the reliability behaviour over
time of the 2oo6 configuration, while in Figure 4
and Figure 5 there are the reliability results of the
4oo6 and 3oo6 plus 2 consecutive failures
respectively. It is possible to notice that as could be
expected the 2oo6 configuration has the highest
reliability degree but unfortunately such
configuration does not allow to keep a satisfying
exhaust temperature control. On the opposite site the
behaviour of Figure 5 is very conservative because
the reliability behaviour is not only far below the
one of the other two configurations but also the
slope on the first part of the curve is very high
(negative slope) denoting a high change rate in the
reliability of the system in the first part of its
mission.
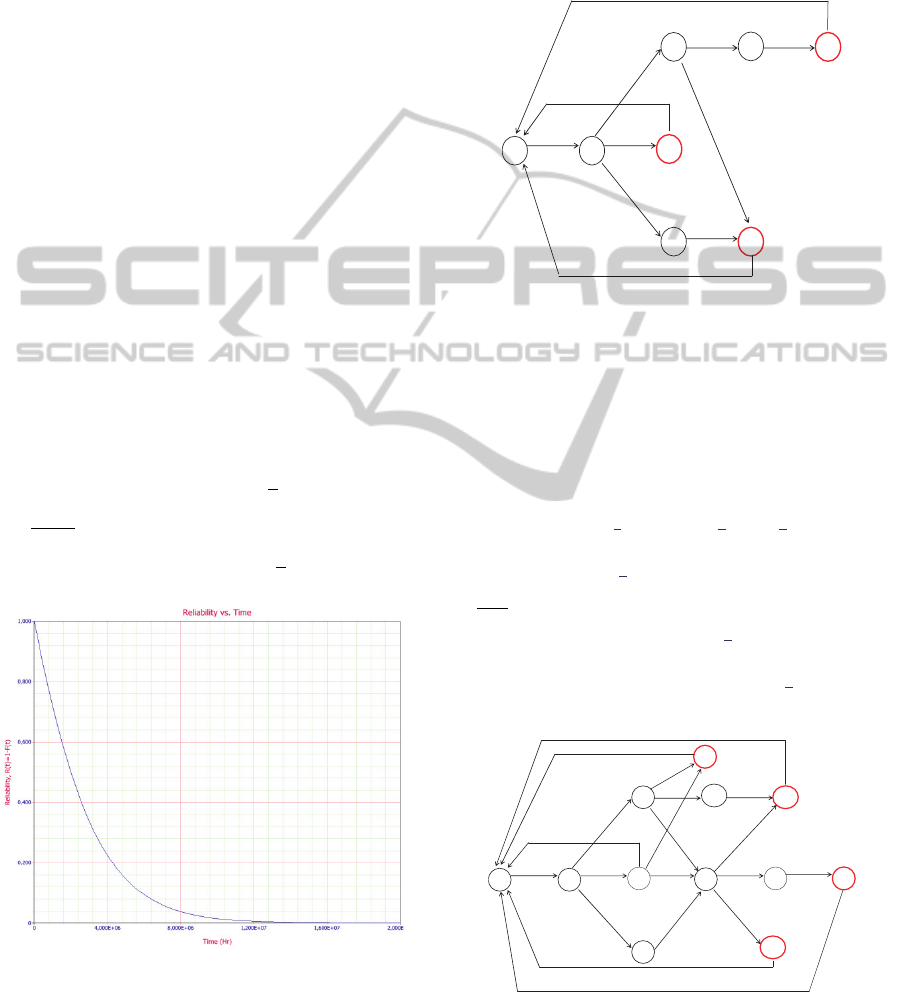
Figure 4: Reliability behaviour of a 4oo6 configuration
with λ=0.1e-6 failures/h and µ=0.
Of course this is the effect of the combination of
the safety requirement (2 consecutive
thermoelements monitoring). Therefore, a good
compromise among the three configurations could
be represented by the 4oo6 placement where a
reasonable reliability and system special covering
can be granted at the same time.
Figure 5: Reliability behaviour of a 3oo6 +2 consecutive
failures configuration with λ=0.1e-6 failures/h and µ=0.
We introduce now the availability analysis
through MM to evaluate such configurations
enhancing the study with the availability
considerations (Rao, 2005), (Birolini, 2010). It is
common to find actual field situations where a
system can be described or condensed as a block
with certain properties in terms of failure rate (λ
[failures/h]) and repair rate (μ [repairs/h]). For such
systems it is possible then to build specific Markov
models and solve them in terms of their availability,
based on the following basics (but not limited)
assumptions depending on the operability conditions
assumed and on the number of states selected.
Δ
3
6Δ5Δ4Δ
16Δ
15Δ
14Δ
1
Δ
3
S3
S0
S1 S2
SMARTGREENS2014-3rdInternationalConferenceonSmartGridsandGreenITSystems
98
1. There are N observable states
2. There is an observable sequence q
1
,q
2
,…,q
T
3. The failure and repair rates are constants over
time (memory less condition) and the process is
stationary
4. Each transition from one state to the other take
place in defined Δt which is constant (sampling
time)
5. In each Δt only one transition take place
6. Every Δt a transition should occur.
7. First order Markov assumption
For such modelling the authors decided to modify to
the 2oo3 configuration adding the constraints of the
three consecutive failed items to include safety
monitoring aspects in such representation. Therefore
we studied the three most promising configurations
(4oo6, 3oo6+2consecutive and 2oo6+3 consecutive)
from an availability perspective. We represented the
state flow diagram as in Figure 6 where S
X
is a
specific transition state corresponding to a physical
sensing arrangement behaviour while one state, the
red one, represents the system failure condition.
Each transition taking place every sampling time is
associate with a probability through the failure and
repair rates. The system dynamics can be expressed
through (1):
(1)
Figure 6: State space representation of the MM of the
4oo6 configuration where S3 represents the failed case.
The availability performance can be measured
through the sum of the probabilities over time of the
states that are not considered failed and the
analytical solution can be obtained. In the same
manner in Figure 7 and 8 there are the modeling of
the two alternative configurations that is the 2oo6 +
3 consecutive and the 3oo6 + 2 consecutive failures
respectively, while (2) and (3) describe again the
system dynamics.
Figure 7: State space representation of the MM of the
3oo6 + 2 consecutive failures configuration where S2, S5
and S7 represent the failed cases.
Such matrices are usually sparse due to the fact
that the system is not repaired until a meaningful
number of failed items are present. This assumption
is reasonable considering the cost of the single item
with respect to a forced stop of power plants.
(2)
Figure 8: State space representation of the MM of the
2oo6 + 3 consecutive failures configuration where S6, S9,
S11 and S12 represent the failed cases.
6 0 0
3
6 5 0 0
0540
004
3
µ∆t/4
λ∆t λ∆t
2λ∆t
µ∆t/2
3λ∆t
6λ∆t
2λ∆t
λ∆t
4λ∆t
Δ/3
S0
S2
S1
S3
S4
S5
S6
S7
6 0
2
00
3
0
4
6500 0000
02
2
0 0000
02040000
0 004000
00034
3
00
000000
000000
4
µ∆t/4
µ∆t/3
λ∆t
λ∆t 3λ∆t
2λ∆t
µ∆t/22λ∆tλ∆t
2λ∆t
6λ∆t
2λ∆t
2λ∆tλ∆t2λ∆t
λ∆tλ∆t
4λ∆t
µ∆t/4
µ∆t/5
S1
S3
S2
S4
S5
S7
S8
S9
S6
S10
S12
S11
ExhaustThermoelementsRedundantStrategytoImproveTemperatureReadingReliabilityandServiceability
99
60000
00
0
650000000000
024000000000
020400000000
00040000000
0020
000000
0 0 2 2 4 0 3 0 0 0 0 0
00000020000
00000002
000
00000000300
000000003
0
0000000000
)
(3)
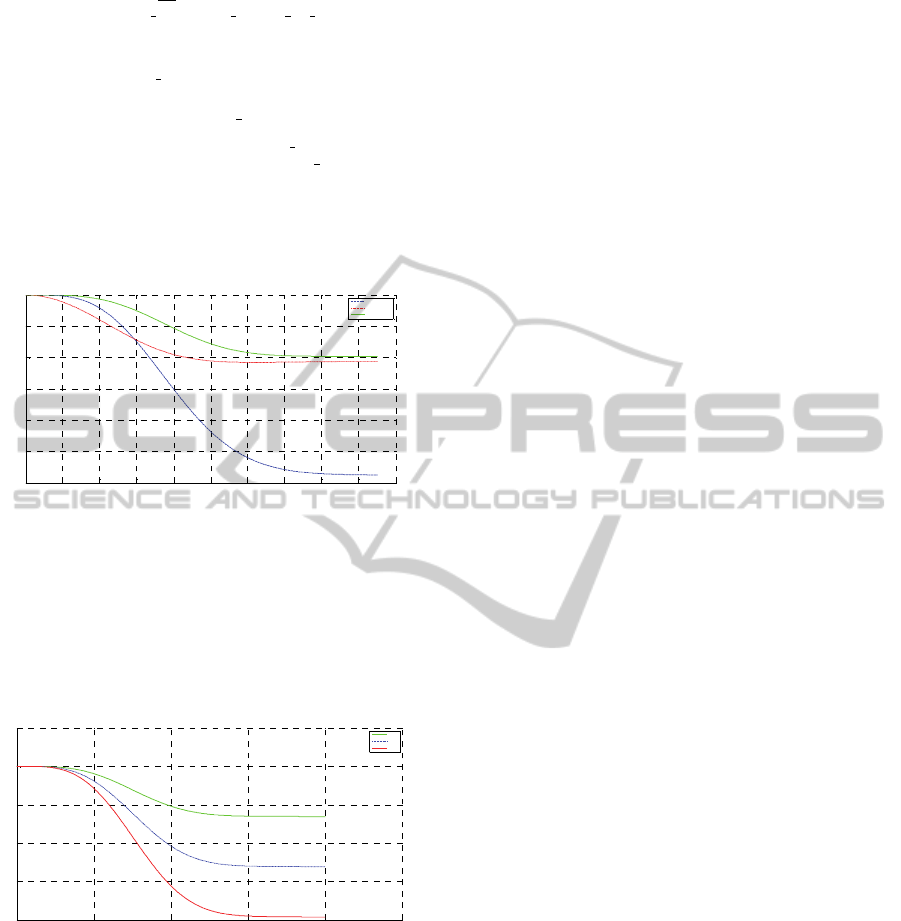
In Figure 9 the comparison among the availability
simulations of the three mentioned configurations
supposing to have a repair rate of 1/48 [1/h] is
sketched.
Figure 9: Availability comparison of the three
configurations considering 48h as the inverse of the repair
rate µ.
Out of the analysis it is evident that the best
configuration representing a reasonable choice
among the three proposed is the 2oo6 + 3
consecutive failures due to the fact that it shows the
best steady state availability behaviour.
Figure 10: Availability behaviour of the 2oo3+3
consecutive failures configuration considering 16, 32 and
48h as the inverses of three different repair rates µ.
Availability modification according to different
repair rates (16, 32 and 48 hours respectively) are
investigated and results are shown in Figure 10.
4 CONCLUSIONS
In this paper the authors propose three different
configurations to evaluate the reliability and
availability of the disposition of six thermoelements
used to monitor the exhaust temperature in a gas
turbine system to enhance system productivity and
efficiency performance over time. The study has
been performed exploiting both RBD and Markov
state flow modelling under the hypothesis of
constant failure and repair rates. Results pointed out
that the best configuration is the 2oo6 + 3
consecutive both in terms of reliability and
availability.
REFERENCES
Hua D., Yang X. H., 2011, Reliability Analysis of Gas
Turbine Based on the Failure Mode and Effect
Analysis Power and Energy Engineering Conference
(APPEEC), Asia-Pacific.
Mugnaini M., Catelani M., Ceschini G., Masi A.,
Nocentini F., 2002, Pseudo Time-Variant parameters
in centrifugal compressor availability studies by means
of Markov models in Microelectronics Reliability, vol.
42, p. 1373-1376, ISSN: 0026-2714.
Chowdhury, A. A., Koval, D. O. 2009, Reliability
Assessment of a Backup Gas Turbine Generation
System for a Critical Industry Load Using a Monte
Carlo Simulation Model Industry Applications, IEEE
Transactions on Volume:45, Issue : 1
10.1109/TIA.2008.2009495, Page(s): 310 – 316.
Ceschini G., Mugnaini M., Masi A., 2002, A reliability
study for a submarine compression application
Microelectronics Reliability, vol. 42, p. 1377-1380,
issn: 0026-2714.
Rao S. S., 2005, Reliability engineering Design McGraw
Hill.
Birolini A., 2010, Reliability Engineering: Theory and
Practice Springer 6th Edition 2010.
Fort A., Bertocci F., Mugnaini M., Vignoli V., Gaggii V.,
Galasso A., Pieralli M., 2013, Availability modeling
of a safe communication system for rolling stock
applications Conference Record - IEEE
Instrumentation and Measurement Technology
Conference , art. no. 6555453 , pp. 427-430.
Catelani M., Mugnaini M., Singuaroli R., 2000, Effects of
test sequences on the degradation analysis in high
speed connectors Microelectronics Reliability, vol. 40,
p. 1461-1465, ISSN:0026-2714.
Catelani M., Ciani L., Mugnaini M., Scarano V.,
Singuaroli R., 2007, Definition of safety levels and
performances of safety: Applications for an electronic
equipment used on rolling stock IEEE Instrumentation
and Measurement Technology Conference, art. no.
4258348, IMTC.
0 200 400 600 800 1000 120 0 1400 1600 18 00 20
0
0.9994
0.9995
0.9996
0.9997
0.9998
0.9999
1
time (h)
Availability(t)
4006
3006+2cons
2006+3cons
0 500 1000 1500 2000 250
0
0.9998
0.9998
0.9999
0.9999
1
1
time (h)
Availability(t)
mu1
mu2
mu3
SMARTGREENS2014-3rdInternationalConferenceonSmartGridsandGreenITSystems
100
