
Exploring the Bitcoin Network
Annika Baumann, Benjamin Fabian
and Matthias Lischke
Institute of Information Systems, Humboldt University Berlin, Spandauer Str. 1, 10178 Berlin, Germany
Keywords: Electronic Cash, Bitcoin, Network Analysis.
Abstract: This explorative paper focuses on descriptive statistics and network analysis of the Bitcoin transaction graph
based on recent data using graph mining algorithms. The analysis is carried out on different aggregations
and subgraphs of the network. One important result concerns the relationship of network usage and
exchange rate, where a strong connection could be confirmed. Moreover, there are indicators that the
Bitcoin system is a “small world” network and follows a scale-free degree distribution. Furthermore, an
example of how important network entities could be deanonymized is presented. Our study can serve as a
starting point in investigating anonymity and economic relationships in Bitcoin on a new structural level.
1 INTRODUCTION
Bitcoin is a decentralized digital currency based on a
peer-to-peer network architecture and secured by
cryptographic protocols. It was originally proposed
by Nakamoto (2009). Anonymity and avoidance of
double spending are realized via a block chain, a
kind of transaction log that contains all transactions
ever carried out in the network. In order to provide
some anonymity, personal, identifiable information
is omitted from the transaction. Therefore, the
source and destination addresses are encoded in the
form of public keys. Every public key, which serves
as pseudonym, has a corresponding private key
which is stored in an “electronic wallet”. Private
keys are used to sign or authenticate any
transactions. To become part of the peer-to-peer
network, one needs to install a client software that
runs either on a local device or at cloud providers
(Ober et al., 2013).
Authorization and verification are conducted by
a complex proof-of-work procedure. Nakamoto
(2009) proposed the use of a timestamp server which
takes the hash of a block of items, timestamps it, and
widely publishes the hash to the network. The proof-
of-work also creates new Bitcoins in the network;
this process is called “mining”. Creation of Bitcoins
is limited to a fixed amount of 21 million Bitcoins
that can be introduced to the system; this limitation
aims at avoiding inflation. Therefore, until that point
is reached around the year 2140, money supply will
increase at a certain rate every year (Drainville,
2012).
Our explorative work applies descriptive
statistics and network analyses to the Bitcoin
transaction graph. The network data was provided
by Brugere (2013) who applied several tools for
downloading and constructing the user network of
Bitcoin. Several aggregations are used to highlight
network characteristics. The research focuses on
global time-varying dynamics within the network.
As a first step of our methodology, qualitative
research was conducted in order to gain an insight
into related work and the transaction graph. Next,
we explored the provided data and undertook
required preprocessing steps for storing it
appropriately in a database. Statistics and network
analyses were conducted using this database; results
were evaluated, interpreted, and compared to recent
research on the transaction graph.
2 RELATED WORK
There are three main related research articles on the
Bitcoin transaction graph that were published within
the last two years. The most recent work carried out
by Ober, Katzenbeisser and Hamacher (2013)
focuses on time-varying dynamics of the network
structure and the degree of anonymity. Using data of
the period 03/01/2009 to 06/01/2013, the authors
discovered that the entity sizes and the overall
pattern of usage became more stationary in the last
12 to 18 months, which reduces the anonymity set.
369
Baumann A., Fabian B. and Lischke M..
Exploring the Bitcoin Network.
DOI: 10.5220/0004937303690374
In Proceedings of the 10th International Conference on Web Information Systems and Technologies (WEBIST-2014), pages 369-374
ISBN: 978-989-758-023-9
Copyright
c
2014 SCITEPRESS (Science and Technology Publications, Lda.)

The authors also show that the number of dormant
coins is important to quantify anonymity. Inactive
entities hold many of these dormant coins and thus
further reduce the anonymity set (Ober et al., 2013).
Reid and Harrigan (2013) focus on anonymity in
the Bitcoin network, analyzing the topology of the
transaction and user network based on data of the
time interval from 03/01/2009 to 12/07/2011. The
authors adopt a preprocessing step to construct the
user network. In order to improve the anonymity
analysis, the researchers propose several methods
including the integration of external information that
is mainly held by businesses and other services
which accept Bitcoin as payment. They show that it
is possible to associate IP addresses from a public
service with the recipient’s public keys and link it to
previous transactions.
In the third paper by Ron and Shamir (2013) the
main focus lies on non-dynamic statistical properties
of the transaction graph. The authors analyzed data
of the period from 03/01/2009 to 13/05/2012, using
various statistics such as distributions of addresses,
incoming BTCs, balances of BTCs, number and size
of transactions, and most active entities. They found
that the majority of Bitcoins is not in circulation and
that most of the transactions amount to a rather
modest sum (less than 10 BTC). The researchers
also analyzed the largest transactions in the network
(greater than 50,000 BTCs) and determined their
flows. They showed that most of these transactions
are successors of the initial ones. Another interesting
finding is that the transaction flows reveal some
characteristic behaviors such as long chains, fork
merge, and binary tree-like distributions (Ron,
Shamir, 2013).
3 DATA MANAGEMENT
The data of the Bitcoin transaction graph is publicly
available in order to enable the proof-of-work
concept for verification of transactions. Sites such as
blockchain.info or blockexplorer.com can be crawled
for deriving the entire transaction graph. The data
used by our work was collected and to some extent
preprocessed by a project of the University of
Illinois at Chicago (Brugere, 2013). It contains the
time horizon from 01/03/2009 until 04/10/2013. We
applied tools developed by Martin Harrigan and
Gavin Andresen for extracting data from the
Bitcoin.dat files in order to construct a user network
according to the method introduced by (Reid and
Harrigan, 2013). This procedure results in several
raw text files (Brugere, 2013). The latest available
data for download at the time of writing contained
230,686 blocks with around 37.4 million edges and
6.3 million nodes. The text files were transformed
into a specific target format of two tab-separated
files, one relationship file and one node file. Once
the data had an appropriate structure, it was
imported into a relational database. For analyzing
the dynamics and topological characteristics of the
graph structure, NetworkX was used
(http://networkx.github.io/) (Hagberg et al., 2008).
4 ANALYSIS METHOD
In the first step of the analysis several descriptive
statistics were calculated. Some of our results were
earlier established by Katzenbeisser and Hamacher
(2011) and at the Chaos Communication Congress in
2013. Characteristics such as user activity and
transaction volume were linked to the Bitcoin
exchange rate provided by Mt.Gox, which provides
services for exchanging Bitcoins
(https://www.mtgox.com/).
The second part of the analysis regards the
network structure and topology. Since financial
transaction networks are always evolving and not
static, all measures were applied for different time
horizons in order to investigate the dynamics. In the
following the network measures are briefly
introduced.
The Degree distribution captures the structure of
networks in terms of the individual connectivity of
nodes. The in-degree of a node i is the total number
of connections to the node i and is the sum of the
ith-column of the adjacency matrix. For the out-
degree, the sum of the ith-row of the adjacency
matrix is calculated (Gross and Yellen, 2004). One
characteristic, often revealed by real networks, is
that the degree follows a power law (Clegg, 2006),
e.g., as shown by Barabasi, Albert and Jeong (2000)
for the World Wide Web and by Inaoka, et al.
(2004) in cases of financial transaction networks.
The Average Clustering Coefficient measures the
global cliquishness on the graph. Watts and Strogatz
(1998) applied the clustering coefficient in order to
discover the small world phenomenon within several
networks. The Average Shortest Path Length is
defined as the average number of steps along the
shortest paths for all possible pairs of nodes and
measures the efficiency of information or mass
transport in the network (Mao and Zhang, 2013).
According to network theory one can determine how
efficient Bitcoin is with respect to transactions.
Eigenvector Centrality measures the influence of
WEBIST2014-InternationalConferenceonWebInformationSystemsandTechnologies
370
one node on other nodes. For each node it is defined
as the value of the corresponding component of the
principal eigenvector of the adjacency matrix
defining the network. Accordingly, a node with a
high eigenvector score is one that is adjacent to
nodes that also have high eigenvector scores
(Borgatti, 2005). This measure is essential for
discovering central hubs such as exchanges, miners,
or “laundry services” that are important nodes in the
Bitcoin network.
5 ANALYSIS AND RESULTS
The descriptive statistics were applied over the
entire time horizon from 01/03/2009 until
04/10/2013. The transaction value per day has a
wide range beginning with the initial transaction of
50 BTC up to a daily amount of nearly 30 million
BTC (19th September 2012).
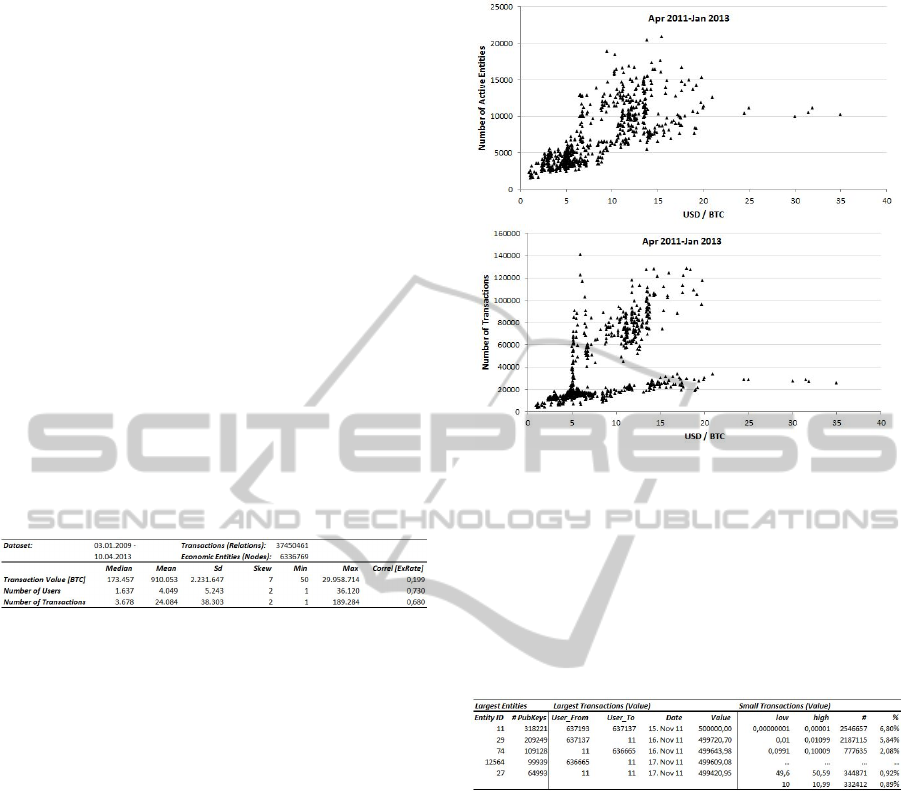
Table 1: Statistics of the Bitcoin network.
The distribution of the transaction values is strongly
skewed to the left. Another notable result is the high
correlation between the number of active users, the
number of transactions, and the MtGox exchange
rate (BTC/USD), see Figure 1.
There are cutoffs at the beginning of trades when
the dollar parity was achieved and maintained with
negligible changes on 04/13/2011, and at the end
when an extremely high exchange rate of around
237 BTC/USD was reached. Both figures show a
high heteroscedasticity of the data. This indicates a
highly speculative behavior in the network. The
relationship will be investigated more thoroughly
later on.
Table 2 shows the five largest entities in the
network according to their number of public keys.
The largest one has the entity ID 11 with over
318,221 public keys. One can also see that this entity
is involved in the biggest transactions within the
network. All the largest transactions are likely
related to each other as indicated by the close time
horizon and the entities involved.
Ron and Shamir (2013) conducted an analysis of
these Bitcoin flows and came to the conclusion that
nearly all major transactions are related. Another
interesting result regards the huge amount of tiny
transactions. The highest percentage of transactions
(6.80%) according to their trade volume corresponds
Figure 1: Correlations of user activity (left) and number of
transactions (right) to exchange rate.
to the transactions of the range from 0.00000001 to
0.00001 BTC. Figure 2 shows the transaction values
in a histogram, indicating the peaks of the highest
transactions occurring.
Table 2: Transactions and users in the network.
There is a strong relationship between the exchange
rate of Bitcoin and the activity in the network. User
activity increases immediately after a peak was
reached by the exchange rate. A rolling window was
constructed to investigate the relationship for
different time windows. The user activity was
measured for the last day, last 10 days, last 30 days
and the last 100 days. Every rolling window shows a
strong relationship but shrinks when extending the
time horizon. The correlation coefficient for the last
day is 0.736, last 10 days – 0.710, last 30 days –
0.671, and for the last 100 days – 0.641.
Figure 3 shows the BTC/USD exchange rate
provided by the Bitcoin exchange Mt.Gox. There is
a cutoff at the end of the time series due to a
tremendous increase up to $237. In the following,
some events are noted that might explain several of
the strong movements in the exchange rate and the
respective attention by more potential users of
Bitcoin:
ExploringtheBitcoinNetwork
371
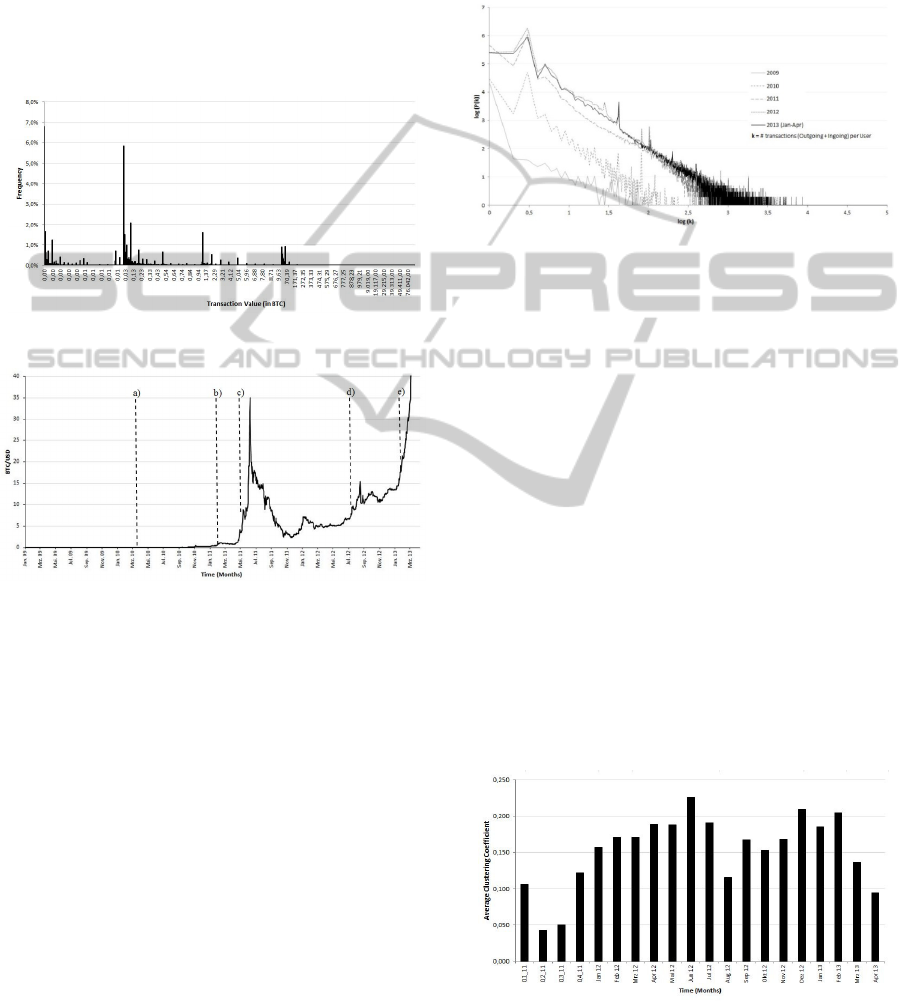
a) Start of the public trading of Bitcoins.
b) First time reaching dollar parity on 10th
February 2011.
c) Several articles and media attention on Bitcoin,
e.g., Forbes, Businessweek, or Bloomberg.
d) Abandonment of Paypal on Cyberlocker sites
due to privacy concerns (Dotson, 2012).
e) Cyprus financial system about to collapse,
Bitcoin is considered as new safe haven (see
Mey, 2013).
Figure 2: Histogram of the transaction value.
Figure 3: BTC/USD exchange rate and events.
Such a strong relationship can also be seen for
the number of transactions carried out on the
network. This is not surprising since higher activity
of users leads to more transactions. The increasing
number of transactions follows the exchange rate
movements. The correlation coefficient to exchange
rate is 0.680 and to user activity 0.928. Between
transaction value and exchange rate there is a rather
low correlation coefficient with 0.198.
In the following, the focus is placed on network
structure. For this, the degree
distribution was
constructed. For every year since the start of Bitcoin
in 2009, the degree k was calculated for every user
entity by counting and summing ingoing and
outgoing transactions (in- and out-degree). The
resulting total degree distribution is drawn on a
double logarithmic scale. The distribution also gives
an insight into the network usage over time. In the
beginning of network activity in 2009, there have
been a lot of fluctuations. With increasing network
usage the degree distribution seems to converge over
time to a scale-free behavior that is also shown by
many other real networks. In case of the Bitcoin
network this means that the majority of users have a
low degree while a small but non-negligible amount
of users have a high degree k.
Figure 4: Degree distribution of the Bitcoin network.
Another important metric in the network analysis
is the average clustering coefficient. In order to find
evidence for a small world network, one can
compare the Bitcoin graph to a random network with
the same amount of nodes and edges like Watts and
Strogatz (1998) did in their analysis. This measure
was calculated on a monthly basis for the years 2012
and 2013. For 2011 the calculation was done
quarterly. The years 2009 and 2010 were omitted
from the analysis due to rather low activity in the
network and lots of transactions between the same
entities. Over time, the average clustering coefficient
is rather high, indicating a small world network.
It can be seen that clustering decreases with
increasing activity within the network. In quarter
two and three of 2011 the lowest measure was
calculated, while the user activity increased in that
time period. The same effect can be noted for
August 2012 and March 2013. Hence, higher user
activity in the network reduces the global
cliquishness in the graph.
Figure 5: Average clustering coefficient over time.
Due to restrictions on computing power, the metrics
average shortest path and the eigenvector centrality
WEBIST2014-InternationalConferenceonWebInformationSystemsandTechnologies
372

are calculated just on the subgraph containing all
transactions equal to and higher than 50,000 BTC.
Since the average shortest path is only applicable on
connected graphs, this metric is calculated for every
connected subgraph within the network. In the large
transaction network there are 11 disjoint subgraphs.
The largest average path length is 125.083 and the
lowest is 1.0. The first high value indicates a rather
inefficient transfer of Bitcoins through the network
according to a common interpretation of this
measure. But since users are in control of
transferring Bitcoins, this kind of inefficiency might
be intended to obfuscate financial transactions.
The eigenvector centrality calculation did not
converge to a solution within a reasonable time
frame (on convergence see Hagberg et al. (2008))
thus only the degree centrality measure was used.
The highest value occurs for the entity 11, which is
also confirmed by the visualization of the largest
hub in the graph. Degree centrality measures the
importance of nodes within a network; the results
show that the large transaction network node 11 is
the most important node and can be considered as a
hub for the others.
Table 3: Average shortest path length and degree
centrality of the largest transaction graph.
6 DEANONYMIZING ENTITIES
To demonstrate the possibility of deanonymizing at
least some users in the Bitcoin network, the largest
entity in terms of the number of public keys was
selected. This entity 11 is also involved in the largest
transactions that were carried out on the network.
The first approach was to investigate the IP address
belonging to the public key that initiates the
transaction which is available from the site
blockchain.info. It needs to be conceded that many
IP addresses just reveal information (via Whois)
about the last gateway before entering the block
chain and thus cannot directly be associated with the
real user. But one can receive information on the
regional distribution of hosted services and their
transactions. Users or business services accepting
Bitcoins that are not using hosting services could be
uncovered with this approach by using
getaddr.bitnodes.io.
Another finding is that large and highly active
entities providing exchange, laundry, mining,
gambling services such as Mt.Gox, SatoshiDice, or
BTC Guild are publicly known on the
blockchain.info, and entity 11 could be identified as
the exchange service Mt.Gox. To confirm this result,
several transactions until April 10, 2013, in which
Mt.Gox was involved were investigated using
blockchain.info and could be linked to entity 11.
Another method is to look up a particular public key
of Mt.Gox in the dataset and show that it belongs to
the public key pool of entity 11.
7 CONCLUSIONS AND
OUTLOOK
Our research can serve as an exploratory starting
point for the application of several techniques,
descriptive statistics, and network analysis of the
Bitcoin transaction graph. Recent results on the
transaction graph were introduced. Standard
descriptive statistics and more advanced methods in
the field of network analysis were applied.
The results of the descriptive analysis show
strongly skewed data series, especially for the
transaction value. Another finding is the strong
relationship between user activity, transaction
volume, and the exchange rate of Bitcoin. One could
also see that the largest entity is also involved in the
largest transactions carried out in the network, and
that the highest amount of transactions is of the
smallest possible transaction size. Furthermore, the
exchange rate was investigated and related to some
events explaining its volatility. A strong relationship
of user activity within different time horizons and
the exchange rate could be demonstrated.
The network analysis revealed some new
findings compared to previous research. We
confirmed that the network degree distribution
seems to converge to a scale-free network over time.
A new contribution was the analysis of the average
clustering coefficient, which is an indication for
Bitcoin being a small world network as described by
Watts and Strogatz (1998). The analysis of the
average path length and degree centrality was
conducted on a subgraph containing the largest
transactions (>= 50,000) in the network. The results
ExploringtheBitcoinNetwork
373

show a very large average shortest path of around
125 for the largest connected subgraph, indicating
inefficient user-driven transactions possibly aimed at
hiding Bitcoin flows. Using the degree centrality
measure, the largest hub in the subgraph, entity
number 11 (also the largest entity in the entire
network), could be found. Future work could aim for
deanonymizing other major hubs of the network
possibly by external information and experimental
transactions.
The analyses conducted in this work could also
be extended by further network measurements. One
could investigate the small world character more
thoroughly by advanced methods. Also further
analysis on centrality can be conducted such as
betweenness centrality or current flow betweenness
centrality in order to get more insights on important
hubs in the network. Further clique and clustering
analysis can be used to expose social interaction
characteristics
of users.
One could also extend the data set with IP
address and geo-location data in order to conduct
novel research on the geographic characteristics of
the network. Then it would be possible to analyze
the network structure in different regions and how
transactions occur between them. This can lead to a
more thorough picture of structures and topology of
the Bitcoin transaction graph. All of these analyses
can also serve as a starting point in investigating
anonymity and economic relationships in Bitcoin on
a new structural level.
REFERENCES
Barabási, A-L; Albert, R; Jeong, H (2000): Scale-free
Characteristics of Random Networks: the Topology of
the World Wide Web. Physica A: Statistical
Mechanics and its Applications 281(1–4): 69–77.
Borgatti, S (2005): Centrality and Network Flows. Social
Networks 27(1): 55-71.
Brugere, I (2013): Bitcoin Transaction Network
Extraction. https://github.com/ivan-brugere/Bitcoin-
Transaction-Network-Extraction. (Access Dec 2013).
Clegg, R (2006): Power Laws in Networks.
http://www.richardclegg.org/networks2/SpecialLectur
e_06.pdf. (Access Dec 2013).
Dotson, K (2012): Paypal’s Abandonment of Major
Cyberlockers May Become Bitcoin’s Big Win.
http://siliconangle.com/blog/2012/07/11/paypals-
abandonment-of-major-cyberlockers-may-become-
bitcoins-big-win/. (Access Dec 2013).
Drainville, D (2012): An Analysis of the Bitcoin
Electronic Cash System. https://math.uwaterloo.ca/
combinatorics-and-optimization/sites/ca.combinatorics
-and-optimization/files/uploads/files/Drainville,
Danielle.pdf. (Access Dec 2013).
Hagberg, A; Schult, D; Swart, P (2008): Exploring
Network Structure, Dynamics, and Function Using
NetworkX. In: Varoquaux, G; Vaught, T; Millman, J
(Eds), Proceedings of the 7th Python in Science
Conference: 11-15. Project documentation:
http://networkx.lanl.gov/.
Inaoka, H; Ninomiya, T; Taniguchi, K; Shimizu, T;
Takayasu, H (2004): Fractal Network Derived from
Banking Transaction – An Analysis of Network
Structures Formed by Financial Institutions. Bank of
Japan Working Papers 04(04).
Katzenbeisser, S; Hamacher, K (2011): Bitcoin – An
Analysis [28C3]. http://www.youtube.com/watch?v=-
FaQNPCqG58. (Access Dec 2013).
Mao, G; Zhang, N (2013): Analysis of Average Shortest-
Path Length of Scale-Free Network. Journal of
Applied Mathematics, Vol. 2013, Article ID 865643.
Mey, S (2013): Bitcoin Rallye: Hackerwährung als
sicherer Hafen für Sparer? http://blog.zdf.de/
hyperland/2013/03/bitcoin-rallye-hackerwaehrung-als-
sicherer-hafen-fuer-sparer/. (Access Dec 2013).
Nakamoto, S (2009): Bitcoin: A Peer-to-Peer Electronic
Cash System. http://bitcoin.org/bitcoin.pdf. (Access
Dec 2013).
Gross, J; Yellen, J (Eds) (2004): Handbook of Graph
Theory, CRC Press.
Ober, M.; Katzenbeisser, S; Hamacher, K (2013):
Structure and Anonymity of the Bitcoin Transaction
Graph. Future Internet 5(2): 237-250.
Reid, F; Harrigan, M (2013): An Analysis of Anonymity
in the Bitcoin System. In: Security and Privacy in
Social Networks, Springer: 197-223.
arXiv:1107.4524v2 [physics.soc-ph]
Ron, D; Shamir, A (2013): Quantitative Analysis of the
Full Bitcoin Transaction Graph. Lecture Notes in
Computer Science 7859: 6-24.
Watts, D; Strogatz, S (1998): Collective Dynamics of
Small-World Networks, Nature, Vol. 393, June 1998:
440-442.
WEBIST2014-InternationalConferenceonWebInformationSystemsandTechnologies
374
