Spectroscopic Characteristics of the Cationic Dye Basic Orange 21 in
Leukocytes
Z. Eizig
1
, D. T. Major
2
, H. L. Kasdan
3
, E. Afrimzon
1
, N. Zurgil
1
and M. Deutsch
1
1
The Biophysical Interdisciplinary Jerome Schottenstein Center for the Research and the Technology of the Cellome,
Physics Department, Bar Ilan University, Ramat Gan, Israel
2
Department of Chemistry, Bar-Ilan University, Ramat-Gan, Israel
3
IRIS Diagnostics Division, IRIS International Inc., Chatsworth, CA, U.S.A.
1 STAGE OF THE RESEARCH
A comprehensive literature review regarding BO21
and other metachromatic dyes has been completed
and yields many open questions regarding the cause
for BO21 metachromasia. Recognizing the need for
a more satisfactory basis for machine interpretation
of leukocytes, Kass (Kass, 1986) found useful,
reaction properties of Basic Orange #21 (BO21),
which acts supravitally to induce metachromasia in
leukocytes.
However, surprisingly, and most probably due to
the low quantum yield of BO21, reference to its
florescence characteristics and polarization is
missing.
Therefore, the spectroscopic aspect of BO21 is
extensively investigated in our work. First, the
dependency of BO21 metachromasia upon a variety
of factors (pH, viscosity, salts, proteins temperature,
etc.) have been investigated. In all experiments,
phosphate buffered saline buffer (PBS) was used as
the hosting medium in order to retain a constant pH
level.
At first, the influence of these factors upon BO21
was assessed by changes (red or blue shift) in the
absorption spectrum of BO21. Practically, the ratio
between the absorption (A) measured within the
wavelength windows 481 – 490nm and within 461 –
470nm was calculated for suspending media without
(S) and with reagent (R), after which the Absorption
Ratio (AR) was calculated (Equation 1).
(481 490) (461 470)
(481 490) (461 470)
S
R
AA
AR
AA
(1)
Though some influence of the acidity level and the
viscosity could be observed via the ARs ratio, they
were negligible in respect to that obtained with
heparin, an anion organic molecule which exists in
some types of leukocytes. It has been found that
heparin induces a blue shift in the absorption
spectrum (AR ~ 0.84), yielding a red hue BO21
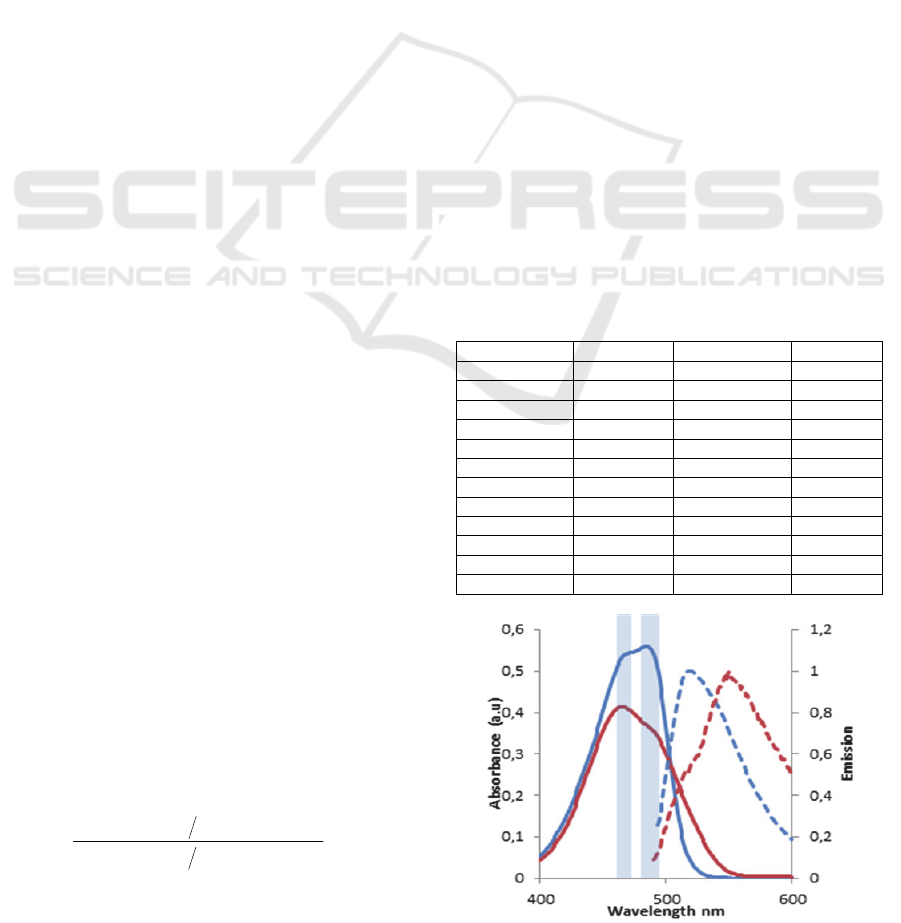
solution. Results are summarized in Table 1.
The absorption (solid line) and emission dashed
line) spectra of BO21 in the absence (blue curves),
and in the presence (red curves) of heparin, are
shown in Figure 1. The measured absorption
wavelength windows are indicated by the blue
blocks.
Table 1: Influence of factors upon BO21 absorption
spectra.
Variable Reference Variable density Abs. Ratio
Concentration 10uM BO21 50uM 1.00
pH pH 7.4 pH 5 0.99
pH pH 7.4 pH 9 1.00
Viscosity 1cP 219cP 1.07
CaCl
2
BO21 in H2O 0.09 uM 1.00
CuSO
4
BO21 in H2O 1.35 nM 1.00
KCl BO21 in H2O 600 mM 1.00
MgCl
2
BO21 in H2O 70 mM 1.00
NaCl BO21 in H2O 300 mM 1.00
BSA/PBS BO21 in PBS 100 uM 1.04
BSA/H2O BO21 in H2O 100 uM 1.01
heparin BO21 in H2O 0.8 uM 0.84
Figure 1: absorption (solid line) and emission (dashed
line) spectra of BO21 (10uM) in the absence (blue) and in
the presence (red) of 0.8uM heparin. The two orthogonal
blocks represent the said wavelength windows.
82
Eizig Z., T. Major D., L. Kasdan H., Afrimzon E., Zurgil N. and Deutsch M..
Spectroscopic Characteristics of the Cationic Dye Basic Orange 21 in Leukocytes.
Copyright
c
2014 SCITEPRESS (Science and Technology Publications, Lda.)
Next, it was found that in the presence of heparin
the emission peak of BO21 was extremely red
shifted; from 519 to 550nm for excitation of BO21
at 490nm.
Finally, Fluorescence polarization (FP)
measurements of BO21 in water yielded, contrary to
all expectations, FP ~ 0.450. However, the presence
of heparin produced a dramatically lower FP; about
0.200.
1.1 Mechanism
Changes in absorption spectrum might evolve from
electrostatic bonds between BO21 molecules
(formation of dimers, trimers, etc.), as well as the
presence of heparin, on which the dye cation
aggregates, occupying adjacent sites on the poly-
anion. In order to distinguish between the two
possible mechanisms, two types of experiments were
performed. First, the electrostatic bonds between
BO21 and heparin were neutralized by replacing the
heparin with small anion molecules. Results are
listed in Table 2. As can be seen, no influence of the
salts upon BO21 absorbance could be observed; the
control (BO21 in water or in PBS) values (~ 0.59)
were, for all practical purposes, the same as with
salts (3
rd
column from left). Moreover, the presence
of heparin caused no noticeable change as well (4th
column from left).
Table 2: Influence of anion and cation salts upon BO21
absorption spectra with and without heparin.
Absorbance at 484nm
Sub. Concentration BO21+ Sub.
BO21+ Sub.+
heparin
H2O control
0.59 0.49
PBS control 0.57 0.57
(NH
4
)SO
4
0.2M 0.58 0.59
NaAC 0.2M
0.58 0.59
NaCl 0.2M
0.58 0.58
Sub.- Substance
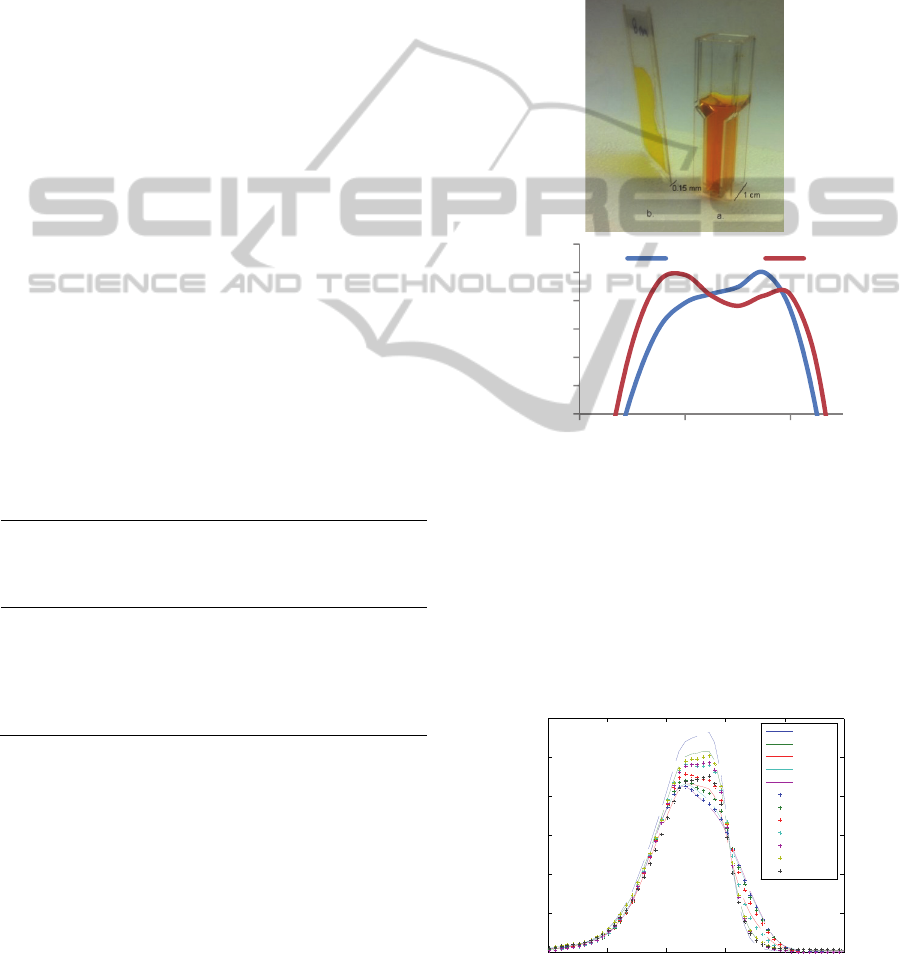
Next, the role of BO21 aggregation in
metachromasia was examined independently by
tracing the dependency of BO21 absorption upon its
concentration. In order to avoid measurement errors
due to inner filter effects, a special cuvette was
designed with an optical path of 0.15mm. In Figure
2, two cuvettes are shown, each containing the same
BO21 concentration. Nevertheless, with the regular
1cm cuvette (item a in the figure) a red shift is
evident due to enhanced inner filter effect, while
with the 0.15mm cuvette (item b in the figure),
either no shift at all is evident, or a significantly
smaller shift can be seen. Results of absorption
measurements with the latter are given in the lower
panel of Figure 2. As can be seen, the higher the
BO21 concentration, the more significant the blue
shift is – a finding which supports BO21 aggregation
(which generates dimers, trimers and more complex
formations of BO21) as the main cause of
metachromasia.
Figure 2: BO21 absorbance at high concentration. Upper
panel: 8mM dye concentration in 10mm (a) and in
0.15mm (b)
cuvettes. Lower panel: absorption spectra of
0.05mM BO21 (blue curve) and 8mM (red curve), as
measured in the 0.15mm cuvette.
The level of blue shift was also found to be
heparin concentration dependent, i.e. the higher the
heparin concentration the greater the blue shift is
(see Figure 3).
Figure 3: Absorption spectra of 10uM BO21 at various
concentrations of heparin.
0,9
0,92
0,94
0,96
0,98
1
1,02
450 470 490
NormalizedAbs.
Wavelength(nm)
0.05mM 8mM
350 400 450 500 550 600
0
0.1
0.2
0.3
0.4
0.5
Wavelenght
Abs.
0.00 uM
0.10 uM
0.20 uM
0.41 uM
0.81 uM
1.63 uM
3.26 uM
6.51 uM
13.03 uM
26.05 uM
39.08 uM
45.59 uM
SpectroscopicCharacteristicsoftheCationicDyeBasicOrange21inLeukocytes
83
However, a close look into Figure 3 shows that
the shift has a maximum at 0.8uM heparin, after
which it decreases.
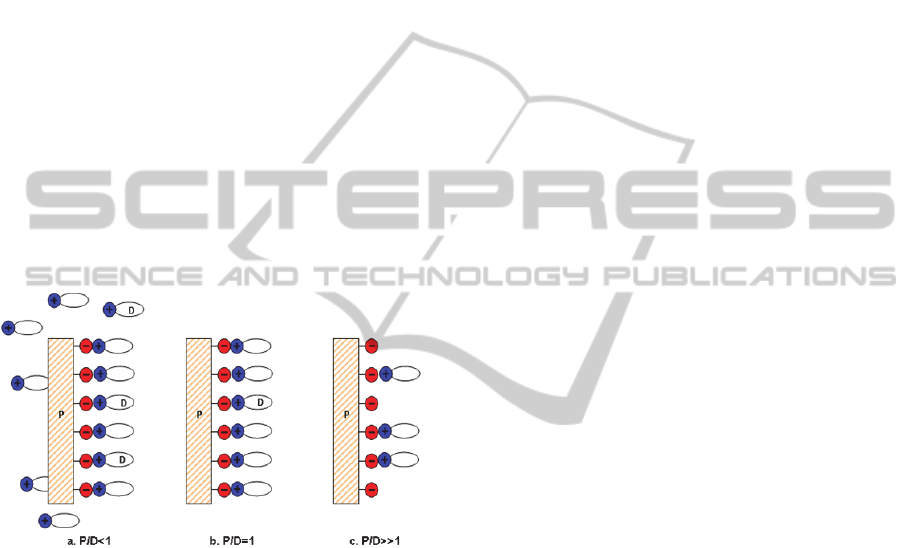
Our interpretation of these results follows
Bradley’s and Wolf‘s (1959). The idea is illustrated
in Figure 4. Denoting BO21 as D and heparin
binding site as P, we propose that at low heparin
concentrations, namely P/D<1,
the heparin binding
sites are completely occupied with BO21 and the
surplus BO21 remains unbound in the solution
(Figure 4a). In the case where P/D~1 (Figure 4b), all
BO21 molecules are expected to occupy all heparin
binding sites and consequently, to yield maximum
metachromasia. With further increase of the heparin
concentration, P/D>1 (Figure 4c), the competition
between heparin molecules on BO21 molecules will
finally lead to an equilibrium state where the BO21
molecules only partially occupy heparin binding
sites, hence lessening the proximity between BO21
molecules attached to each of the heparin molecules
and consequently lowering the chance for BO21
aggregation to occur on a single heparin.
Figure 4: Aggregation schematic of the dye (D) on the
anionic binding site of the polymer (P). a) Low polymer
concentration leaves free dye molecules in the hosting
solution. b) At an equal number of polymer binding sites
and dyes, the dye molecules occupy all polymer binding
sites. c) The number of polymer anionic binding sites is
larger than that of dye molecules, hence yielding partial
occupancy of the binding sites by the dye.
The experimental results and proposed
mechanism was further strengthened by the use of
computational chemistry. BO21 molecules is a
multi-bodied electronic structure containing 47
nuclei and 169 electrons (despite the chlorine that
dissolves in water), and therefore, the Schrödinger
equation is impractical as a modelling method,
hence, the Density Functional Theory (DFT)
approach was applied (Hohenberg and Kohn 1964).
DFT is a quantum mechanical modelling method
which investigates the electronic structure
(principally the ground state) of many-body systems.
With this theory, instead of using N wave function
that depend on 3N coordination for x,y,z, the
properties of a many-electron system can be
determined by using the charge density ρ. This
method is based on two Hohenberg-Kohn theorems
(H-K). The first H-K theorem demonstrates that the
ground state properties of a many-electron system
are uniquely determined by an electron density that
depends on only 3 spatial coordinates, while the
second H-K theorem defines energy functional for
the system, and proves that the correct ground state
electron density minimizes this energy functional.
We calculated the electric dipole of the BO21
molecule. This molecule is cation due to a positive
charge surrounding the nitrogen atom connected to
the methyl group. Based on density function, a 3-d
MEP (Molecular Electrostatic Potential) was
produced in Figure 5a.
The molecule electric dipole moment µ was
estimated by the formula:
1
nucl
N
dZ
rr r
(2)
Where ࣋
ሺ
࢘
ሻ
is the density function, Z is atomic
number and α is the nuclei index. The integral is
above the electron coordinates and the summation
yields the nucleus contribution to the dipole
moment. The dipole moment vector of BO21 was
found to be
29
21
1.43 10
BO
Cm
, which is twice
the water molecule (
2
30
6.2 10
HO
Cm
).
21BO
is indicated in Figure 5a by a light blue
arrow in respect to the molecule axis. In order to
support the aggregation theorem that causes the blue
shift, we test the feasibility of dimer or trimer
formation of BO21 molecules. In the tested model,
the molecular electrical dipoles of dimers and
trimers of BO21 are oriented in a parallel fashion as
shown in Figure 5b. Surprisingly, the related binding
energies were found to be even lower than those
calculated for anti-parallel arrangements, a fact
which explains the blue shift in the absorption
spectrum.
2 OUTLINE OF OBJECTIVES
To study the spectroscopic characteristics of
BO21 in bulk solution in the presence and in the
absence of biomolecules in general, as well as
those which exist in leukocytes, in particular.
To explore unique spectroscopic features of
BO21 stained leukocytes, if they exist
BIOSTEC2014-DoctoralConsortium
84

To correlate via the MCR, on same cell basis,
between the explored spectroscopic features of
BO21 stained sub types of leukocytes, and
between traditional methods for differential
leukocyte counts.
a)
b)
Figure 5: Molecular Electrostatic Potential from most
negative (blue) to positive (red). a) BO21 monomer,
electric dipole moment direction marked in light blue
arrow. b) Parallel (dipoles) BO21 dimer.
3 RESEARCH PROBLEM
Overcoming inner filter problem by the
construction of unique cuvettes which will allow
high concentration fluorescence and absorption
measurements
Development of theoretical tools for the
examination of correctness level of the above
unique cuvette performance
Preparation of upright epifluorescence
microscope for spectroscopic measurement of
BO21-stained cells in a single cell resolution,
while preserved within the MCR.
Development of DFT-based algorithm for the
investigation of dye-dye and dye-heparin
interactions (primary results discussed above).
Development of protocols for treatment of
leukocytes within the MCR, e.g. cell loading,
cell staining with BO21, fixation, Giemsa/Wright
staining, etc.
Evaluation of the diagnostic potential of BO21.
4 STATE OF THE ART
Presently, the leukocyte differential count test is
mainly
based on measuring individual cell electrical
impedance, fluorescence and light scattering, which
are all methods based on signals from an entire cell
and not from the detailed image of a cell. Signals are
acquired using flow cytometer and hematology
analyzers that require large amounts of reagent and
blood samples. Cell analysis on flow cytometers
typically involves two steps: first, labeling target
cells with detection assays, e.g. fluorophore-
conjugated antibodies, and second, detecting target
cells by corresponding optical signals, e.g.,
fluorescence assays (Yun et al., 2010) of
fluorophore-conjugated antibodies for leukocyte
analysis on the microflow cytometers. However, the
low temperature needed for reagent storage makes
this assay less than ideal for point-of-care
applications. In comparison, assays of fluorescent
dyes, have been proven as useful alternatives in cell
analysis (Shi et al., 2013). Shi used the combination
of FITC, PI and BO21 for classifying four types of
leukocytes, though the spectroscopic aspect of BO21
was barely studied in respect to both FITC and PI.
Furthermore, to the best of our knowledge, studies
of BO21 fluorescence and its polarization do not
exist.
5 RESEARCH METHODOLOGY
5.1 Bulk Spectroscopy of BO21
In this chapter we intend to further investigate
spectroscopic features (Absorbance, FI and FP,
fluorescence lifetime-FLT and polarization decay-
PD) of BO21 in general, and at high concentrations
in particular, in the absence and in the presence of
heparin, in a variety of concentrations. This will be
realized via our Cary UV spectrophotometer and
Cary eclipse spectrofluorometer (Agilent, USA). In
addition, FLT and PD and the evaluation of the
rotational relaxation time of BO21 in solution will
be realized via the DCS-120 confocal FLIM system
(Becker and Hickl GmbH Berlin, Germany).
Especially with the last type of measurements,
which are time dependent, the extremely low
quantum yield of fluorescence of BO21 (about 1000
times less than that of fluorescein), should be
SpectroscopicCharacteristicsoftheCationicDyeBasicOrange21inLeukocytes
85

carefully considered in order to improve the
expected low S/N ratio.
Further investigation of the complexes: BO21
dimers (trimers) and BO21-heparin will be realized
via Density Functional Theory (DFT). Initial
computational quantum chemistry based calculations
teache that the molecular electrical dipoles of BO21
in dimers and trimers tends to be parallel oriented.
Moreover, and quite surprisingly, the related binding
energies are even lower than those calculated for
anti-parallel arrangements. The BO21-heparin
complexes formed, seem to be governed by
electrostatic interactions, wherein the positive
charge of BO21 interacts with the negative charge
located in the heparin sites. Additionally, the π-
cation interaction between stacked BO21 molecules
stabilizes the complexes. Quantum calculations were
performed with the DMol3 module in Material
Studio (Accelery, USA).
5.2 Bulk Spectroscopy of BO21-stained
Leukocytes Suspension
In this chapter we intend to repeat the bulk
measurement discussed above, but in suspension of
BO21 stained leukocyte, utilizing the Cary UV
spectrophotometer and the Cary eclipse
spectrofluorometer (Agilent, USA).
5.3 Single Cell Resolution Spectroscopy
of BO21-stained Leukocytes
In this chapter we intend to measure the
spectroscopic characteristics of intra leukocyte
BO21 at a single-cell resolution. This will be carried
out by loading the leukocytes in a Microtiter plate
Cell Retainer (MCR). MCR is a high throughput
Microtiter plate that has been developed in our
Center (Deutsch et al., 2006) to enable high-content,
time-dependent analysis of the same single non-
adherent and non-anchored cells in a large cell
population while bio-manipulating the cells. The
identity of each cell in the investigated population is
secured, even during bio-manipulation, by cell
retention in a specially designed concave microlens
(Figure 6), acting as a picoliter well. The MCR
technique combines micro-optical features and
microtiter plate methodology.
While solutions for fluorescence measurement at
a single cell resolution is quite common, solutions
for single cell absorption (1nm spectral resolution) is
slow to appear. Hence, for the realization of the
latter in a single cell resolution, we intend to
extensively upgrade our Olympus upright BX61
microscope (Tokyo, Japan) to enable medium
throughput absorption measurements of BO21
stained cell.
Figure 6: An SEM image of Jurkat T cells in MCR. Scale
bar: 20.
In short, to the existing Olympus upright BX61
microscope, which is equipped with a sub-micron
Marzhauser–Wetzlar motorized stage (types SCAN,
with an Lstep controller, Wetzlar–Steindorf,
Germany), a xenon lamp, 1nm spectral resolution
monochromator, and a CCD camera will be added,
adjusted and calibrated. The entire system will be
controlled by designated / software. The captured
images will be processed using Matlab (MathWorks,
USA) to produce spectral quantile (SQ) maps, which
present a surface plot showing absorption quantile
amplitudes as a function of wavelength (see Figure
7).
Neutrophil Lymphocyte
Monocyte Eosinophil
Figure 7: Spectral-Quantile (SQ) plots for four of the five
normal leukocyte subtypes showing how BO21
metachromasia allows easy identification of the subtypes.
Axis from left to right is the Quantile axis (50 quantiles).
Axis from right to left is the wavelength axis (51
wavelengths from 400nm through 650nm at 5nm
increments).
BIOSTEC2014-DoctoralConsortium
86

Finally, in order to explore possible identifying
features which might be used for differentiating
between types of leukocytes and between leukocytes
and other type of cells, pre- versus post-fixation
(with Wright Giemsa staining) correlation of BO21
stained cells will be performed.
6 EXPECTED OUTCOME
Evaluating the ability of a single dye BO21 to
classify types of leukocytes via maps of
absorption, FI and FP spectra.
Exploring the mechanism of BO21-Heparin
interactions/structures in general, and that which
stands behind the measured high FP of BO21 in
water in particular.
REFERENCES
Deutsch, M., Deutsch, A., Shirihai, O., Hurevich, I.,
Afrimzon, E., Shafran, Y., and Zurgil, N. (2006) ‘A
Novel Miniature Cell Retainer for Correlative High-
Content Analysis of Individual Untethered Non-
Adherent Cells’. Lab on a Chip 6 (8), 995–1000
Hohenberg, P. and Kohn, W. (1964) ‘Inhomogeneous
Electron Gas’. Physical Review 136 (3B), B864–B871
Kass, L. (1986) Individual Leukocyte Determination by
Means of Differential Metachromatic ... 4581223.
available from <http://www.google.co.il/patents?id=
RHk8AAAAEBAJ> [3 February 2013]
Shi, W., Guo, L., Kasdan, H., and Tai, Y.-C. (2013) ‘Four-
Part Leukocyte Differential Count Based on
Sheathless Microflow Cytometer and Fluorescent Dye
Assay’. Lab on a Chip [online] available from
<http://pubs.rsc.org/en/content/articlelanding/2013/lc/
c3lc41059e> [25 February 2013]
Yun, H., Bang, H., Min, J., Chung, C., Chang, J. K., and
Han, D.-C. (2010) ‘Simultaneous Counting of Two
Subsets of Leukocytes Using Fluorescent Silica
Nanoparticles in a Sheathless Microchip Flow
Cytometer’. Lab on a Chip 10 (23), 3243.
SpectroscopicCharacteristicsoftheCationicDyeBasicOrange21inLeukocytes
87
