
Development of a Safest Routing Algorithm for Evacuation
Simulation in Case of Fire
Denis Shikhalev
1
, Renat Khabibulin
1
and Armel Ulrich Kemloh Wagoum
2
1
The State Fire Academy of EMERCOM of Russia, 129366, B. Galushkina 4, Moscow, Russia
2
Jülich Supercomputing centre, Forschungszentrum Jülich GmbH, 52428 Jülich, Germany
Keywords: Pedestrians Dynamics, Criticality, Evacuation System, Re-routing.
Abstract: Route choice of pedestrians during an emergency evacuation can be influenced by many factors. In this
contribution we elaborate three criteria to consider during an evacuation with a fire hazard. The criteria are
combined in an objective function which is minimized during the simulation. The function defines the safe-
ness of a route. In addition an algorithm is presented which evaluates and redirects the pedestrians to the
safest path during the simulation. The algorithm shows a positive impact on the evacuation time and overall
on the safety during an evacuation simulation. A long term goal of the presented algorithm could be the in-
tegration in an evacuation system that gives instructions or recommendations during the evacuation process
using dynamic indicators.
1 INTRODUCTION
Remembering the location of emergency exits cer-
tainly plays an important role during an emergency
evacuation. Some empirical studies have shown that
in some cases almost 80% of adult visitors were not
able to recall the finding of at least one of an emer-
gency exit. The survey was conducted in a shopping
mall in the city of Fiume Veneto in Italy by inter-
viewing people (Carattin, 2011). It is also known
that the availability of safe escape routes during an
evacuation constitutes one of the most critical as-
pects of a building’s safety in case of fire (Kobes,
Helsloot et al, 2010). Moreover the analysis of some
existing escapes route systems from different coun-
tries (Shikhalev and Khabibulin, 2013) shows that
only one third of the systems were able to determine
the direction of the escape route using a scientifical-
ly well founded method. This way, there is a prob-
lem of calculating the safest escape route for people
in case of fire. This problem is related on one hand
to the difficulty in finding the best escape route
(from the point of view of people’s safety) to outside
and on the other hand to the limited functionality of
escape route system.
Considering these factors some thought should
be given on decisions support systems that are able
to determine the safest route during an emergency
evacuation. In this paper we propose an escape route
assessment algorithm. Based on actual input data
(the numbers of pedestrians, the value of fire haz-
ards), the algorithm computes the safest route for
people out of the danger zone. The algorithm can be
integrated into escape route systems. This work is
structured as follow: the second section presents
some related works in the area of computing safe
routes during evacuations. The newly introduced
criteria are presented in the third section. This is
followed by a case study and analysis. Some con-
cluding remarks are given in the last section.
2 RELATED WORKS
The problem of calculating the safest escape route
has been considered from various points of view (Pu
and Zlatanova, 2005; Jalali and Noroozi, 2009; Fil-
ippoupolitis, Gorbil et al, 2011). The main similarity
between those approaches is the fact that they oper-
ate on a graph-based structure. Generally, the Dijks-
tra or the Floyd-Warshall’s algorithms are used to
compute the paths (Evans and Minieka, 1992). The
choice of the algorithm depends on the features of
the problem to be solved (for example, in some
cases the weight of edges is negative and this cannot
directly be handled by the Dijkstra algorithm). The
685
Shikhalev D., Khabibulin R. and Ulrich Kemloh Wagoum A..
Development of a Safest Routing Algorithm for Evacuation Simulation in Case of Fire.
DOI: 10.5220/0004919706850690
In Proceedings of the 6th International Conference on Agents and Artificial Intelligence (ICAART-2014), pages 685-690
ISBN: 978-989-758-015-4
Copyright
c
2014 SCITEPRESS (Science and Technology Publications, Lda.)

main differences in the approaches are the definition
of the weights of the edges in the constructed evacu-
ation graph. (Filippoupolitis, Gorbil et al, 2011)
expresses the weight of the edges as the effective
length which gives indications about the threat level
of a part of the escape route. This metric consists of
two variables. The first variable is the physical
length of the escape route section. The second varia-
ble is the intensity of the hazards. The presented
results of their simulation show a reduction in the
percentage of fatally injured evacuees. (Jalali and
Noroozi, 2009) defined a certain elapsed time used
as the weight of the edges in their model. They in-
vestigated the evacuation of an underground mine
and calculated the elapse time as a function of the
length of a mine escape route coupled with a passage
simplicity factor. Other authors focused on the
quickest path taking into account different factors
like queue size at exits (Kemloh Wagoum et al.,
2012; Kretz, 2009). These approaches however did
not include a direct threat source, a fire for instance.
The first steps to address this shortcoming is al-
ready taken by some simulation tools, for instance
FDS+Evac (K., Simo Hostikka, S. et al., 2007)
which combines a pedestrian evacuation model with
a fire spreading model. While the presented ap-
proaches are very promising, we think that other
factors need to be considered while calculating al-
ternative routes during evacuation under imminent
danger.
3 THE SAFEST PATH
CRITERION
While assessing the safety of a route during an evac-
uation under imminent danger, a fire hazard for
instance, the focus has to be on the building as a
whole and on some of its sections in particular
(Predtechenskii and Milinskii, 1978). A section can
be the portion between two crossings of escape
routes for example. So the very first step is to identi-
fy the different segments of the evacuation routes
network. There are two different sources of hazards.
The primary source is the imminent danger (e.g.
fire) and the second sources is the process of the
evacuation itself, where jamming at bottlenecks may
cause severe injuries or even be fatal, and excessive
speed may cause tripping related injuries even with-
out jamming. Also the physical length of the escape
route should be considered. Thereby, at least three
parameters (fire, evacuation, length) should be taken
into account to objectively assess people’s safety
during evacuation.
3.1 Obstruction
The first criterion gives information about the usage
of the current section. The obstruction criterion is
determined by the ratio of the people’s density on a
section of the escape route network to the maximum
people’s density that does not cause adverse effects
to humans. Usually, the density is expressed as the
ratio between the number of people and the area of
the escape route section. The value of the obstruc-
tion is given in Equation 1. D
cur
is the current density
on the considered section of the escape route. D
max
is
the maximal density on a section of the escape route.
The value for D
max
can be retrieved from different
empirical studies (Kholsgevnikov et al, 2008; Ger-
man Fire Protection Association, 2012; Huang et al,
2013).
(1)
3.2 Timeliness
The second factor is directly linked to the fire haz-
ard. During a fire in shopping mall people can be
damage by fire hazards (high temperature, a large
amount of smoke, low visibility, toxic products of
combustion etc.) due to long pre-evacuation time for
instance. A criterion of timeliness leads away from
routes where fire hazards will be reached. The time-
liness is defined in Equation 2. X
cur
is the current
value of one of the fire hazards on section of an
escape route. X
cr
is the critical value of one of the
fire hazards on the section of the escape route. K
s
is
a safety coefficient. The values of X
cur
are obtained
from fire detectors. X
cr
is obtained from various
empirical studies (Gann, R., Babrauskas et al., 1994;
Raj, 2008).
∙
(2)
3.3 Length
The third criterion is the relative physical length of
the current section. It is defined in Equation 3. l
cur
is
the current length of the section and l
max
is the max-
imal length of a section found in the complete net-
work of the investigated structure.
(3)
ICAART2014-InternationalConferenceonAgentsandArtificialIntelligence
686

3.4 Multi-objective Optimization
Due to the aforementioned criticality criteria should
be taken into account together to solve an optimiza-
tion problem which is characterized by the following
features:
- the impact factor of the different criteria is not
known and their real influence on the assessment
of the escape routes is uncertain;
- it is hard to find good compromise when each
criterion has its own minimal value;
- best values of each criterion are located as closer
to zero as possible.
Based on these features we built the following opti-
mization strategy: firstly we calculate a node in 3 -
dimensional space which is obtained by the criteria.
Secondly, we find the distance between the obtained
node and zero because we have the constraint that all
values of each criterion should be minimal. So the
distance is a complex criterion which is named as
the safest path criterion.
The first task is solved by getting value of the
criteria from different sources described in the pre-
vious section. The second task is to find the shortest
distance between two nodes in an n-dimensional
space. The Euclidean distance is applied to this pur-
pose (Marler and Arora, 2004; Deza and Deza,
2013). This is explained in Equation 4. q
i
and p
i
are
the nodes in the n-dimensional space.
,
(4)
Applying equation (4) for our task we combine the
criteria (1), (2), (3) in one φ - safest path criterion
(Figure 1). The process of combining is presented in
Figure 1.
Figure 1: The process of combining.
The problem can then be formulated as:
Calculate the safest escape route for person N
1
,
N
2
,…,N
i
from the starting positions m
1
, m
2
,…,m
i
to
the safety areas s
1
, s
2
,…,s
i
. The constraint is that the
value of each criterion (1), (2), (3) should be mini-
mal. As an optimization criterion we use the safest
path criterion φ:
∙
∙
∙
(5)
at:
a
i
→ min, i=1,…,n ;
b
i
→ min, i=1,…,n ;
l
i
→ min, i=1,…,n .
where:
α, β, γ – the weight coefficient at a
i
, b
i
, l
i
.
The coefficients (α, β, γ) are added to regulate the
importance of the individual criterion. Besides a
length the safest path criterion provides important
information about people’s density and fire hazards
spreading on an escape route section.
3.5 Routing Algorithm
The criteria presented in the previous section are
incorporated in a route choice algorithm, which
evaluates the safest path during the evacuation. The
algorithm is described in Figure 2. The Re-routing is
triggered when a better route than the current is
identified. The necessary input data for the algo-
rithm (the numbers of pedestrians, the value of fire
hazards on the escape route sections) are updated
every 10 seconds.
Once the safest path criterion φ is calculated, the
optimal escape route is determined using the Floyd-
Warschall algorithm. It is suitable to use the algo-
rithm of Floyd-Warschall in this case (Evans and
Minieka, 1992) since the location of the fire is un-
predictable and it is always necessary to compute all
possible paths. This algorithm finds the shortest path
between between all pairs of edges in a graph.
Normally, the means of the algorithm are expressed
by following equation (Evans and Minieka, 1992):
min
,
(6)
where:
– the shortest distance from i – vertex to
j-vertex.
m – intermediate vertices of path.
For our task we used the safest path criterion φ in-
stead of the shortest distance. Actually our criterion
Length
Timeliness
a
b
l
φ
i
l
i
b
i
a
i
0
Obstruction
a
i
→ min
b
i
→ min
l
i
→ min
DevelopmentofaSafestRoutingAlgorithmforEvacuationSimulationinCaseofFire
687
has already contained information related to distance
(see section 3.3).
For our task we used the safest path criterion φ as
the weight of the edges. At each time step the algo-
rithm evaluate the need for a re-routing on the sec-
tion. The directions of the pedestrians are updated in
the case that they are not already on the safest route.
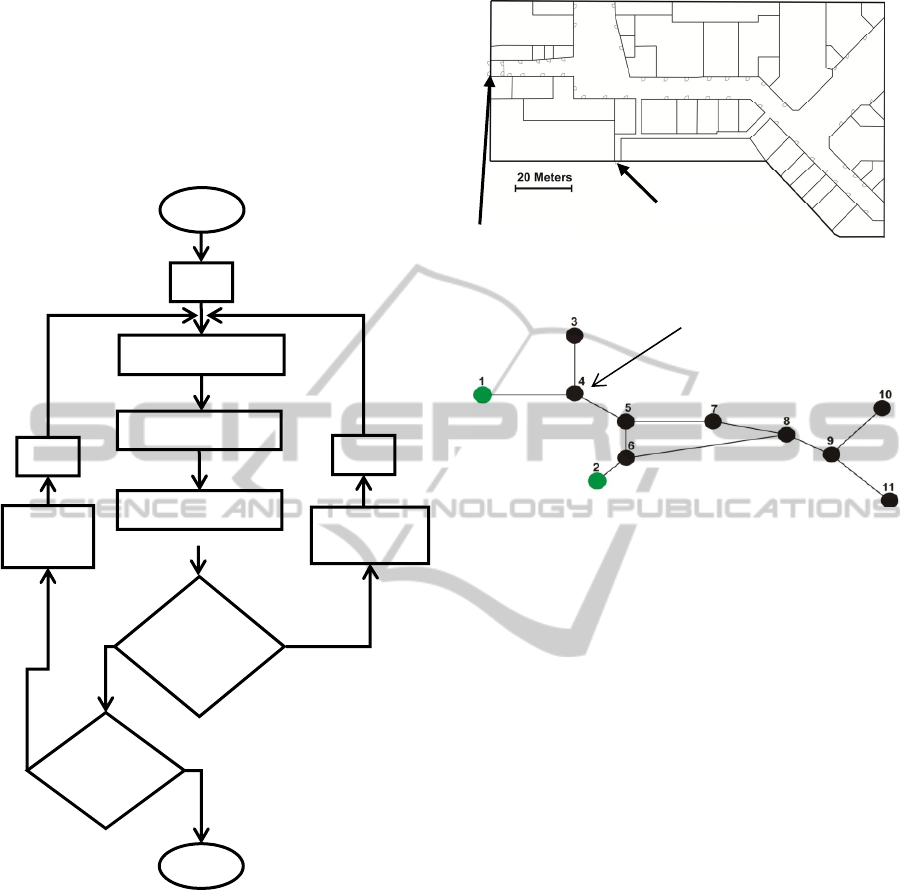
Figure 2: Safest route algorithm. t
k
is the current
evacuation time and t
g
the step time (10 seconds)
4 CASE STUDY
We investigate a section of a shopping mall in the
centre of Moscow. Figure 3 shows the plan of the
simulated object. The two exits are annotated on the
plan.
Figure 3: Plan of the simulated shopping mall.
Figure 4 shows the structure of the graph extracted from
the plan. The vertices of the graph are located at the cross-
ing of escape routes and represented by dark circles. The
rescue areas are represented by the green circles. The
edges are weighted by the safest path criterion φ defined in
the previous section.
5 SIMULATION
The simulation is conducted in two scenarios. In the
first scenario we did not used the safest route algo-
rithm therefore the evacuated people did not change
their current route. After simulating the first scenario
we got evacuation and fire hazard spreading’s data
which would be compared with data of the second
scenario.
In the second scenario we used the
safest route
algorithm described in Figure 2. For both scenarios
we used a flow model for people movement
(Kholsgevnikov, Shields, et al., 2003) and FDS (K.,
Simo Hostikka, S. et al., 2007) for the simulation of
the fire hazards spreading. Also, pedestrians are in
both scenarios first directed to the shortest route to
the outside. In the second scenario however, they
change their initial route after some time.
The following constraints were used in the simu-
lations:
- 1323 persons were randomly distributed in the
plan presented in Figure 3;
- The pre-evacuation time is set to 60 seconds;
Yes
No
Yes
No
Start
Next simulation step
Getting data from
detecto
r
s on sections
Re-routing
needed?
Evacuation
completed?
Direction people
by the newly
defined
p
ath
t
к
= t
к
+t
g
t
к
= t
к
+t
g
Calculating
the safest direction
The End
t
к
=0
Direction
people by the
current path
Cross of escape routes
Exit 2
Exit 1
ICAART2014-InternationalConferenceonAgentsandArtificialIntelligence
688

- All people were healthy and the initial space occu-
pied by each person is 0,125 m
2
.
For the simulations the maximum density D
max
is
chosen 9 persons/m
2
based on the following sources
(Kholsgevnikov et al, 2008; German Fire Protection
Association, 2012; Huang et al, 2013), the maximal
length of a section measured is 58 meters (section 6-
8, figure 4).
Scenario 1
The simulation results from scenario 1 are presented
in table 1. The percentage use of each exit gives
information about how long this exit was effectively
used during the entire evacuation. It is calculated as
the ratio of the evacuation time through the consid-
ered escape to the total evacuation time.
Table 1: Simulation results of simulation by scenario 1
without the safest path algorithm.
Exit
ID
N
umber of
evacuated
p
ersons
Evacua-
tion time,
[s]
Percentage
use (%)
1 395 124,6 25,2
2 928 316,8 100,0
From the results presented in Table 1 it can be in-
ferred that 30% of people are evacuated during the
first minute (from the start moving). The remaining
70 % of people are evacuated during the last 4
minutes. The escape 1 had been available for 145
seconds, but people were still going to the escape 2.
A section is avoided in the simulation only if the fire
hazards reach its critical value on that section. Dur-
ing the process of evacuation the fire hazards did not
spread as fast as the pedestrians were evacuated and
therefore did not reach its critical value in the places
where pedestrians were going. By the end of evacua-
tion the fire hazards spread up to the node 8.
Scenario 2
In this scenario, the safest route algorithm described
in Figure 2 is used. The following weight coeffi-
cients were used in (5): a – 0,7; b – 0; l – 0,3. Those
coefficients values were chosen because from our
point of view the a-criterion (which reflects people
density) is more important than l-criterion. The val-
ue of b is zero because the fire hazards did not reach
a critical value. Actually, the definition of the coef-
ficients is another task which can be investigated in
future work. The simulation results from scenario 2
are presented in Table 2.
The results of people evacuation show that evac-
uation time is reduced. Moreover, re-routing for
pedestrians take place at time 120 sec in the node 5.
The re-routing of evacuation flows happened when
Table 2: Simulation results of simulation by scenario 2
using the safest path algorithm.
Exit
ID
N
umber of
evacuated
p
ersons
Evacua-
tion time,
[s]
Percentage
use (%)
1 707 190,5 82,8
2 616 230,6 100,0
section 5-4, 4-1 were empty and section 5-6, 6-2 had
a density of approximately 3 persons/m
2
.
6 ANALYSIS
The comparison of the results of simulation leads to
several conclusions. Firstly, the pedestrians were
directed to the shortest path (scenario 1) and as the
result the non-evenly distribution evacuation flows
through exits took place. Also there are many evi-
dences about non-evenly distribution evacuation
flows through exits during evacuation (Kobes et al,
2010; Benthorn and Frantzich, 1996). However,
application of the safest route algorithm distributed
the pedestrians more evenly and reduced the overall
time of evacuation.
Secondly, the main criteria of the evacuation
process such as the time of evacuation and distribu-
tion of people through the exits depend on the re-
routing time. Thus, the re-routing time happened
when the people’s density reached 3 persons/m
2
in
the second scenario. It is still not a critical density
that could affect people’s safety. Nevertheless it has
an influence on people’s velocity and on the evacua-
tion time. It means that the optimal balance between
the weight coefficients in (5) should at least aims at
reducing the evacuation time.
7 CONCLUSIONS AND FUTURE
WORK
The presented algorithm computes the optimal safest
route based on input data from smoke detectors and
other sources. The results are therefore influenced
by the quality of the input data. We also
acknowledge that the algorithm must be coupled to
an evacuation system to give the instructions during
the evacuation process using dynamic indicators.
This could be very useful for guiding impaired per-
sons for instance. A major problem is to give a guid-
ance that will be accepted by the evacuees. In the
further work we plan to improve the algorithms and
integrate them within a pedestrian simulator. In
addition proper validation criteria must also be in-
DevelopmentofaSafestRoutingAlgorithmforEvacuationSimulationinCaseofFire
689

vestigated. In this contribution we limit ourselves to
the evacuation time.
ACKNOWLEDGEMENTS
The performed researches are in the framework of
an internship supported by the scholarship of the
President of the Russia Federation in 2013/2014
academic year.
We would like to thank the anonymous review-
ers for their helpful comments.
REFERENCES
Carattin E., 2011. Proceedings of international confer-
ences. Wayfinding architectural criteria for the design
of complex environments in emergency scenarios.
Advanced research workshop proceedings. Santander,
Universitad de Cantabria.
Kobes, M., Helsloot, I., et al., 2010. Research Article.
Building safety and human behaviour in fire: A litera-
ture review. Fire Safety Journal, Volume 45, Issue 1.
Predtechenskii, V., Milinskii, A., 1978. The Book. Plan-
ning for the foot traffic flow in buildings. – National
Bureau of Standards, USA, New Delhi.
Raj, P., 2008. Research Article. A review of the criteria
for people exposure to radiant heat flux from fires.
Journal of Hazardous Materials, Volume 159, Issue 1-
15.
Gann, R., Babrauskas, V., et al., 1994. Research article.
Fire Conditions for Smoke Toxicity Measurement.
Fire and Materials, Volume 18.
Marler, R., Arora, J., 2004. Review article. Survey of
multi-objective optimization methods for engineering.
Struct. Multidisc. Optim. 26.
Deza, M., Deza, E., 2013. The book. Encyclopedia of
Distances. Second edition, Springer, 2nd ed.
Filippoupolitis, A, E. Gelenbe, E., 2009. Proceedings of
conferences. A distributed decision support system for
building evacuation. Proc. 2nd IEEE Int. Conf. on
Human System Interaction.
Evans, J., Minieka, E., 1992. The book. Optimizatisimoon
algorithms for networks and graphs. Dekker, 2
nd
edi-
tion.
Huang, L., Liu, D., et al., 2013. Research Article. Dynam-
ics-Based Stranded-Crowd Model for Evacuation in
Building Bottlenecks. Mathematical Problems in En-
gineering. Volume 2013.
Kholsgevnikov, V., Shields, et al., 2008. Research Article.
Recent Developments in Pedestrian Flow Theory and
Research in Russia. Fire Safety Journal 43.
German Fire Protection Association, 2012. Technical
Report vfdb TB 13-01. Lippetal.
Filippoupolitis, A, E. Gelenbe, E., 2011. Proceedings of
conferences. An Emergency Response System for In-
telligent Buildings.Proceedings of the 3rd Internation-
al Conference in Sustainability in Energy and Build-
ings (SEB’11).
Jalali, S., Noroozi, M., 2009. Research article. Determina-
tion of the optimal escape routes of underground mine
networks in emergency cases. Safety Science Journal.
Volume 47, Issue 8.
T. Kretz, 2009. Research Article. Pedestrian traffic: on the
quickest path. Journal of Statistical Mechanics: Theory
and Experiment, vol. P03012.
A. U. Kemloh Wagoum, A. Seyfried, et al., 2012. Re-
search article. Modelling dynamic route choice of pe-
destrians to assess the criticality of building evacua-
tion. Advances in Complex Systems, vol. 15, no. 3.
Pu, S., Zlatanova, S., 2005. Proceedings of the confer-
ences. Evacuation Route Calculation of Inner
Buildings. Geo-information for Disaster Manage-
ment.
Shikhalev, D., Khabibulin, R., 2013. Research article.
Escape route systems at shopping malls. Fire and ex-
plosion safety journal, vol. 6.
Simo, K., Hostikka, S., et al., 2007. Technical Reference
Guide. NIST Special Publication 1018-5. Fire Dynam-
ics Simulator (Version 5).
Kholsgevnikov, V., Shields, et al., 2003. Book of ab-
stracts. Pedestrian flow modeling. Book of abstracts
of the 4th International Seminar on Fire and Explosion
Hazards, University of Ulster.
Benthorn, L., Frantzich, H., 1996. Report. Fire alarm in a
public building: How do people evaluate information
and choose evacuation exit? Department of fire safety
engineering, Lund institute of Technology.
ICAART2014-InternationalConferenceonAgentsandArtificialIntelligence
690
