
Detection of Software Anomalies Using Object-oriented Metrics
Renato Correa Juliano
1
, Bruno A. N. Travençolo
2
and Michel S. Soares
3
1
Institute of Exact and Human Science, University of Araxá, Araxá, Minas Gerais, Brazil
2
Faculty of Computing, Federal University of Uberlândia, Uberlândia, Minas Gerais, Brazil
3
Computing Department, Federal University of Sergipe, Aracajú, Sergipe, Brazil
Keywords:
Software Anomalies, Software Metrics, CK Metrics, Object-oriented Programming, Error Proneness.
Abstract:
The development of quality software has always been the aim of many studies in past years, in which the
focus was on seeking for better software production with high effectiveness and quality. In order to evaluate
software quality, software metrics were proposed, providing an effective tool to analyze important features
such as maintainability, reusability and testability. The Chidamber and Kemerer metrics (CK metrics) are
frequently applied to analyze Object-Oriented Programming (OOP) features related to structure, inheritance
and message calls. The main purpose of this article is to gather results from studies that used the CK metrics
for source code evaluation, and based on the CK metrics, perform a review related to software metrics and the
values obtained. Results on the mean and standard deviation obtained in all the studied papers is presented,
both for Java and C++ projects. Therefore, software anomalies are identified comparing the results of software
metrics described in those studies. This article contributes by suggesting values for software metrics that,
according to the literature, can present high probabilities of failures. Another contribution is to analyze which
CK metrics are successfully used (or not) in some activities such as to predict proneness error, analyze the
impact of refactoring on metrics and examine the facility of white-box reuse based on metrics. We discovered
that, in most of the studied articles, CBO, RFC and WMC are often useful and hierarchical metrics as DIT
and NOC are not useful in the implementation of such activities. The results of this paper can be used to guide
software development, helping to manage the development and preventing future problems.
1 INTRODUCTION
Development of software is a difficult, complex and
time consuming activity, in which creativity and
rigour have to be balanced. Complexity of devel-
oping, deploying and maintaining software is well-
recognized and has been widely studied in past years
(Glass, 1999; Berry, 2004; Boehm, 2006; Wirth,
2008). It is not uncommon that a number of problems
arises during the development of a software project,
such as extrapolated costs and deadlines and uncon-
trolled changing of requirements. Software failures
have been responsible for financial losses and disas-
ters (Bar-Yam, 2003; Charette, 2005).
In order to minimize these problems, some prac-
tices can be useful to analyze the error proneness dur-
ing development phases, such as extracting software
metrics (Fenton and Pfleeger, 1998). A number of
characteristics of software, such as maintainability,
testability, and understandability can be evaluated us-
ing software metrics (Olbrich et al., 2009). Many dif-
ferent software metrics were proposed in past years to
evaluate object-oriented software (Lorenz and Kidd,
1994; Harrison et al., 1998; Chidamber and Kemerer,
1994). Among those, the CK metrics were well-
applied in many projects since their introduction(Chi-
damber and Kemerer,1994; Subramanyam and Krish-
nan, 2003; Zhoua et al., 2010).
Chidamber and Kemerer (Chidamber and Ke-
merer, 1994) proposed six metrics focused in object-
oriented software: Depth of Inheritance Tree (DIT),
Number of Children (NOC), Response for a Class
(RFC), Lack of Cohesion in Methods (LCOM), Cou-
pling Between Object Classes (CBO) and Weighted
Methods per Class (WMC).
These metrics were created in order to verify and
to analyze how the development is being accom-
plished and prevent, in advance, future errors. The
CK metrics and other software metrics with focus on
evaluating programming have been widely applied in
past years. Johari and Kaur (Johari and Kaur, 2012)
analyzed the applicability of object-oriented metrics
241
Correa Juliano R., A. N. Travençolo B. and S. Soares M..
Detection of Software Anomalies Using Object-oriented Metrics.
DOI: 10.5220/0004889102410248
In Proceedings of the 16th International Conference on Enterprise Information Systems (ICEIS-2014), pages 241-248
ISBN: 978-989-758-028-4
Copyright
c
2014 SCITEPRESS (Science and Technology Publications, Lda.)

in estimation of maintenance effort. They conduct an
empirical study, using open source software, to check
the applicability of metrics to estimate effort of re-
vision per class. In (Dallal, 2012), the abilities of
several quality metrics considered individually and in
combination to predict the classes in need of refactor-
ing by extracting subclass are studied. Systematic re-
views proposed by Kitchenham (Kitchenham, 2010)
describes the importance of evaluating software using
metrics described in the literature. According to the
author, although there is a large body of research re-
lated to software metrics, researchers still need to re-
fine their empirical methodology before they can an-
swer useful empirical questions (Kitchenham, 2010).
In another review (Radjenovi et al., 2013), new in-
sights into how metrics are used in different environ-
ments were obtained through the assessment of the
context. The authors found that object-oriented met-
rics (49%) are used nearly twice as often as traditional
source code metrics (27%), and the most popular OO
metrics are the CK metrics. In addition, according to
Subramanyam and Krishnan (Subramanyam and Kr-
ishnan, 2003), the relationship between software met-
rics and defects varies depending on different pro-
gramming languages. Therefore, evaluation of soft-
ware metrics is sensitive to the specific programming
language.
In this context, the key contributions of this arti-
cle are a review of experimental works based on the
CK metrics and a suggestion of “software anomalies”
based on empirical studies and statistic analysis and
a study about which metrics are useful (or useless) in
activities such as to predict proneness error, to ana-
lyze impact of refactoring on metrics or examine the
facility of white-box reuse. Only papers where the
CK metrics were used are considered. The choice
was made because CK metrics are well-known and
frequently applied. Metrics for both Java and C++,
currently two of the most used object-oriented pro-
gramming languages, are used. It is described, for
each metric, an empirical database relating CK soft-
ware metrics and the mean value. With these anoma-
lies described, one can infer about the probabilities of
failures for software.
2 METHODOLOGY
In order to establish what can be considered an
anomaly in a software based on CK metrics, we
started by searching among several conferences and
journals for papers describing experimental results on
software analyzed using CK metrics. Then, the ex-
perimental data were extract from these works, tabu-
lated and further analyzed using statistical methods.
Finally, a classification based on the metrics values is
proposed followed by an analysis of the usefulness of
CK metrics in detection of error proneness.
In the first step adopted in our methodology, we
have searched through various conferences and jour-
nals, using scientific databases provided by ACM,
ScienceDirect and IEEE. These journals and confer-
ences were chosen because of their scopes, which in-
cludes maintenance, refactoring and software metrics.
The chosen journals were: JSS (Journal of System
and Software), SCP (Science of Computer Program-
ming), IST (Information and Software Technology),
TOSEM (ACM Transactions on Software Engineer-
ing Methodology), TSE IEEE (IEEE Transactions on
Software Engineering), EMSE (Empirical Software
Engineering) and Information Sciences.
The chosen conferences were: CSMR (European
Conference on Software Maintenance and Reengi-
neering), WCRE (Working Conference on Reverse
Engineering), OOPSLA (International Conference
on Object Oriented Programming), ICSE (Interna-
tional Conference on Software Engineering), ICSM
(International Conference on Software Maintenance),
ECOOP (European Conference on Object-Oriented
Programming) and ICPC (International Conference
on Program Comprehension).
The range of the search was between 2003 and
2013. This criteria was chosen so that informa-
tion provided by this article can be the most current.
Queries used were: software AND metrics, CK AND
metrics, design AND defects, proneness AND error
and proneness AND faults.
The titles of the articles were the basis for selec-
tion of relevant studies. Then, abstract of the papers
were analyzed and, based on their contents, the stud-
ies related to software metrics and anomalies were
chosen for further investigation.
Papers that presented the mean and standard de-
viation of CK metrics of the software that they dis-
cussed were selected. The values obtained from
these papers were gathered in a table, separating Java
projects from C++ projects. Thereon, the mean and
standard deviation of each metric was computed. In
this computation, discrepant values (outliers) were
discarded. The considered outlier values were those
in the extremities (the 25% highest and the 25% low-
est values). This type of mean is known as “Interquar-
tile Mean” (IQM) (Huck, 2012).
A metric classification, based on the work pro-
posed by (Lanza and Marinescu, 2006) is defined.
The model proposed by this work is often used in soft-
ware visualization models. Works as CodeCrawler
(Lanza, 2003) and CodeCity (Wettel and Lanza, 2007)
ICEIS2014-16thInternationalConferenceonEnterpriseInformationSystems
242
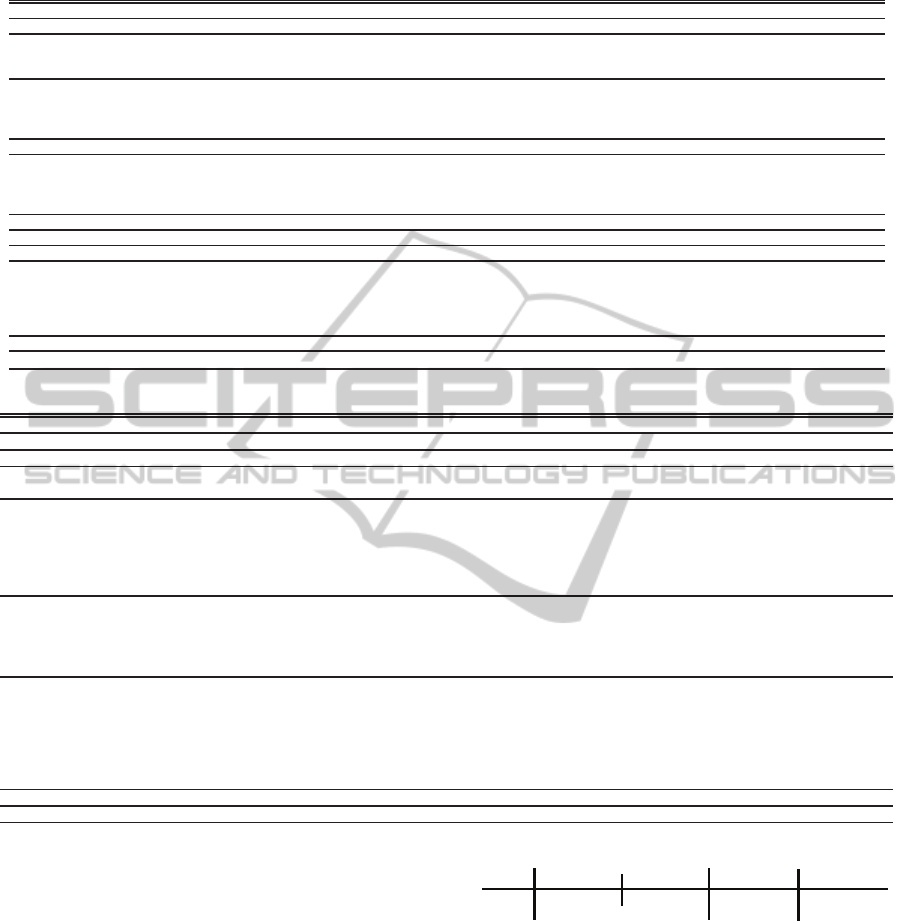
Table 1: Metrics obtained in Java projects.
Software – Article DIT NOC CBO RFC LCOM WMC
AVG STDEV AVG STDEV AVG STDEV AVG STDEV AVG STDEV AVG STDEV
Java (Eclipse 2.0) – (Shatnawi and Li, 2008) 1.98 1.37 1.39 8.85 9.72 11.4 41.8 71.3 85.3 476
Java (Eclipse 2.1) – (Shatnawi and Li, 2008) 1.97 1.37 1.35 8.91 10.3 12.1 45.1 79.2 102 561
Java (Eclipse 3.0) – (Shatnawi and Li, 2008) 1.59 1.25 1.00 6.71 8.31 10.1 40.0 71.5 102 652
— (Benestad et al., 2006) 0.46 0.50 0.46 2.75 6.9 11.2
— (Benestad et al., 2006) 0.59 0.81 0.59 2.37 7.8 10.3
— (Benestad et al., 2006) 0 0 0 0 11.4 12.5
— (Benestad et al., 2006) 0.76 0.54 0.76 3.81 4.9 4.5
— (Subramanyam and Krishnan, 2003) 1.02 1 2.94 3.45 12.2 15.8
Hibernate – (Stroggylos and Spinellis, 2007) 1.32 0.36 16.6 64.8 538 23.2
Connector/J – (Stroggylos and Spinellis, 2007) 0.30 0.15 12.2 60.7
Log4J/ckjm – (Stroggylos and Spinellis, 2007) 1.16 0.11 6.95 32.7 46.3 12.7
Log4J/CCCC – (Stroggylos and Spinellis, 2007) 1.08 0.13 12.4 18
jHotDraw – (Johari and Kaur, 2012) 1.23 1.61 0.31 1.27 6.18 7.61 36.7 36.5 11.7 11.7
jEdit – (Abuasad and Alsmadi, 2012) 0.44 2.351 15.0 24.5 32.7 48.7
29 Softwares – (Kakarontzas et al., 2012) 2.46 1.78 0.51 5.8 6.54 10.1 30.9 44.2 174 2820 10.4 18.5
(1) java commercial – (Nair and Selvarani, 2011) 2.48 1.16 0.08 0.28 10.6 5.42 14.3 15.9 0.90 0 8.60 7.88
(2) java commercial – (Nair and Selvarani, 2011) 1.65 0.75 0.05 0.22 15.4 5.34 18.6 18.4 0.86 0 10.2 9.18
(3) java commercial – (Nair and Selvarani, 2011) 1.83 0.75 11.8 11.2 0 0 6.50 3.51 0.90 0 7.00 4.89
(4) java commercial – (Nair and Selvarani, 2011) 3.55 1.60 19.8 11.9 0.27 0.47 10.8 6.75 0.92 0 7.45 4.53
(5) java commercial – (Nair and Selvarani, 2011) 2.60 1.35 43.5 27.8 0.20 0.42 14.0 8.33 0.74 0 32.0 20.0
Interquartile mean 1.4 1.1 1.3 5.1 8.4 6.6 28.9 35.8 56.9 241 11.7 10.7
Mean 1.5 1.1 4.4 6.3 8.3 7.6 29.9 36.8 95.6 501 15.3 10.9
Table 2: Metrics obtained in C++ projects.
Software – Article DIT NOC CBO RFC LCOM WMC
AVG STDEV AVG STDEV AVG STDEV AVG STDEV AVG STDEV AVG STDEV
— (Zhou and Leung, 2006) 1.00 1.26 0.21 0.70 8.32 6.38 34.4 36.2 68.7 36.9 17.4 17.5
Firefox 3.0 – (Singh and Kahlon, 2012) 2.14 2.02 1.08 16.4 10.4 14.2 26.9 48.9 226 1451 40.0 116
Firefox 2.0 – (Singh and Kahlon, 2011) 1.97 1.93 0.97 16.0 9.26 13.9 25.2 50.1 255 2264 36.8 125
14R3 – (Olague et al., 2007) 0.41 0.69 0.32 1.65 2.33 3.58 13.6 18.3 2.13 2.23 41.8 72.9
15R1 – (Olague et al., 2007) 0.42 0.70 0.32 1.55 2.78 4.34 14.2 20.1 2.22 2.38 47.4 86.4
15R2 – (Olague et al., 2007) 0.49 1.05 0.25 1.08 2.23 3.93 13.4 18.6 2.42 2.27 43.6 80.3
15R3 – (Olague et al., 2007) 0.49 1.05 0.25 1.09 2.28 4.05 13.48 19.15 2.44 2.27 44.3 81.6
15R4 – (Olague et al., 2007) 0.47 1.01 0.24 1.07 2.42 4.19 13.24 19.59 2.37 2.12 42.8 80.1
15R5 – (Olague et al., 2007) 0.49 0.99 0.25 1.13 2.25 3.86 13.28 19.21 2.47 2.27 44.1 83.5
A – (Janes et al., 2006) 0.90 1.27 0.27 1.39 11.7 12.2 24.6 25.9 59.4 116
B – (Janes et al., 2006) 0.97 1.12 0.16 0.62 4.17 8.02 17.6 35.4 87.9 235
C – (Janes et al., 2006) 0.97 0.96 0.16 1.20 23.2 24.1 67.5 71.9 1041 3198
D – (Janes et al., 2006) 0.25 0.44 0.14 0.63 11.1 18.2 33.2 52.4 256 702
E – (Janes et al., 2006) 0.26 0.55 0.05 0.32 17.8 22.7 17.8 22.7 1606 3585
Firefox 1.0 – (Gyimothy et al., 2005) 2.89 2.97 6.52 7.95 59.1 86.0 322 1755 15.9 23.7
Firefox 1.1 – (Gyimothy et al., 2005) 2.88 2.98 6.55 7.99 59.2 86.2 325 1777 15.9 23.8
Firefox 1.2 – (Gyimothy et al., 2005) 2.76 3.03 6.92 8.05 61.5 88.5 333 1604 16.8 24.3
Firefox 1.3 – (Gyimothy et al., 2005) 2.75 3.16 7.13 8.14 61.4 89.0 332 1627 16.6 24.3
Firefox 1.4 – (Gyimothy et al., 2005) 2.75 3.25 6.98 7.98 60.6 90.6 315 1609 16.0 23.8
Firefox 1.5 – (Gyimothy et al., 2005) 2.77 3.25 6.97 7.99 61.1 93.8 319 1727 16.0 24.0
Firefox 1.6 – (Gyimothy et al., 2005) 2.76 3.42 0.92 21.7 6.99 8.10 60.8 92.4 322 1752 16.0 24.1
Interquartile Mean 1.44 1.73 0.34 3.42 6.63 8.57 35.1 50.7 190 980 29.0 52.4
Mean 1.5 1.8 0.4 4.4 7.5 9.5 35.8 51.7 280 1117 29.5 57.0
uses this method to guide the visualization model. In
this work, a classification modified from the original
proposition with regard to the “High values” is pro-
posed.
For each metric, we define three classes of val-
ues: low value, high value and anomaly. The low
values were estimated by computing, for each metric,
the IQM of the mean values of the metric subtracted
by the IQM of the respective SD values. In a simi-
lar manner, high values were estimated by adding the
IQM of the mean values of the metric with the IQM of
the respective SD values. Finally, the anomaly value
is defined as 30% of the high value of the metric. The
illustration presented in Fig.1 summarized these lim-
its.
The purpose of this work is to suggest anomaly
IQM(AVG) - IQM(SD)
LOW
VALUE
IQM(AVG) + IQM(SD)
HIGH
VALUE
ANOMALY
IQM(AVG)
(IQM(AVG) + IQM(SD))*1.3
Figure 1: Classification methodology.
values according to the following hypothesis H1: In-
crease thirty percent (30%) in sum of AVG and SD.
These values would indicate higher possibilities for
software errors (proneness error). The increase of
30% of the value from “High values” to “Anomaly
values” was chosen based on previous analysis and
on the values obtained in other studies. Although
(Lanza and Marinescu, 2006) used 50%, we analyzed
the hypotheses H1, 30%, in an attempt to be the most
similar as possible with other studies about software
DetectionofSoftwareAnomaliesUsingObject-orientedMetrics
243

anomalies. For example, the work by (Kakarontzas
et al., 2012) uses the method proposed by (Lanza and
Marinescu, 2006) to define thresholds in reusability
of classes.
Thereafter, we compared the result of metrics val-
ues for different softwares (both for Java and C++) in
order to find possible discrepant values in anomalies
classification and the reasons of their occurrence.
A second study performed in this work is an anal-
ysis of the literature CK metrics referring activities
in software engineering as predicting error prone and
analyze the impact of refactoring on metrics. Articles
found in conferences and journals cited earlier were
selected and analyzed.
3 RESULTS
The results of the analysis of the reviewed articles are
summarized in Tables 1 and 2. These tables show the
mean and standard deviation of the CK metrics values
obtained from the softwares described in the analyzed
articles. The mean and the interquartile mean from
these values are also shown. It is important to note
that the analyzed softwares are originated from indus-
trial or academic projects, open source or proprietary
softwares, making this research the widest possible.
For Table 1, eight articles describing Java
softwares were considered: (Shatnawi and Li,
2008);(Benestad et al., 2006);(Subramanyam and Kr-
ishnan, 2003);(Stroggylos and Spinellis, 2007); (Jo-
hari and Kaur, 2012); (Abuasad and Alsmadi, 2012);
(Kakarontzas et al., 2012); (Nair and Selvarani,
2011).
In total, these articles describe 20 softwares de-
veloped in Java. The article (Stroggylos and Spinellis,
2007) did not use all metrics, however it was still con-
sidered due to its importance. In (Kakarontzas et al.,
2012), there are 29 open source softwares summa-
rized as one.
In Table 2, six articles describing 21 softwares de-
veloped in C++ were considered: (Zhou and Leung,
2006); (Singh and Kahlon, 2011); (Singh and Kahlon,
2012); (Olague et al., 2007); (Janes et al., 2006); (Gy-
imothy et al., 2005).
In addition, two other tables (Tables 3 and 4) were
created, classifying the metric values in Low, High,
and Anomaly with reference to hypothesis H1. Ta-
ble 1 contains the values obtained from articles that
analyzed Java projects and Table 4 shows the values
obtained for softwares written in C++. The Low, High
and Anomaly (H1) values were computed using the
formulas presented in the previous section. The neg-
ative values were changed to zero, since it is not pos-
sible to have negative values on CK metrics.
Table 3: Metrics values of softwares developed in Java.
DIT NOC CBO RFC LCOM WMC
Low 0 0 0 0 0 230
High 2.5 6.4 13.6 35.5 92.7 253.1
H1 3 8 18 46 120 329
Table 4: Metrics values of softwares developed in C++.
DIT NOC CBO RFC LCOM WMC
Low 0 0 0 0 0 0
High 3.2 3.8 15.2 85.8 1170.3 81.4
H1 4 5 20 112 1521 106
4 DISCUSSION
In order to facilitate the understanding of Tables 1 and
2, a brief summary of the papers used to create the ta-
bles is presented. All these papers used CK metrics
applied to software developed in Java and C++, re-
spectively.
(Stroggylos and Spinellis, 2007) analyzed the im-
pact of refactoring activities for quality improvement
in four open source softwares developed in Java: Hi-
bernate, Log4J, MySQL, and Connector/J. They con-
cluded that, over the years, the valuesof metrics wors-
ened and some metrics such as RFC and LCOM lost
cohesion, and therefore, became more important to
the software.
Software metrics and proneness errors in Eclipse
projects were related in (Shatnawi and Li, 2008). One
advantage of this paper is that the analysis is realized
during the software development phase. The authors
also mentioned that, as soon as possible, the metrics
values must be used to guide the development and in-
crease time and costs of the project. Although some
metrics have significant association with error prone-
ness, efficiency is questionable, since other problems
can also increase proneness errors such as team expe-
rience and time to conclusion of the project.
The article (Nair and Selvarani, 2011) discussed
about the proneness errors in software projects and
the impact in quality. To realize this activity, five
commercial projects using the six CK metrics were
analyzed. According to this work, some conclusions
are substantial to this paper. For instance, when NOC
is greater than five, there is 95% probability of the
class to present defects. In addition, when DIT is
greater than five, there is 81% probability of the class
to have defects, and when CBO has a value between
20 and 24, there is 78% - 98% probability of the class
to present defects. These numbers are compared with
the results presented in tables of this paper.
ICEIS2014-16thInternationalConferenceonEnterpriseInformationSystems
244

(Benestad et al., 2006) investigated the impact of
structural metrics on assessing the maintainability and
proposed some strategies to analyze the level of main-
tainability. One of the strategies showed “very high”
values for some CK metrics, such as WMC (>23),
DIT (>3) and NOC (>3).
(Subramanyam and Krishnan, 2003) analyzed CK
metrics in industrial softwares and how it can be as-
sociated with defects. This association is different ac-
cording to each programming language. This conclu-
sion comes to reinforce the results we obtained.
(Johari and Kaur, 2012) discussed about the im-
pact caused by modifications during open source soft-
ware life cycle. They found a high significance in
WMC, RFC and CBO to predicting the fault prone-
ness and number of revisions made in class. The met-
rics LCOM and DIT show least significance. Fur-
thermore, NOC showed no significance in identifying
fault proneness.
(Abuasad and Alsmadi, 2012) created a tool to an-
alyze various software metrics and how these metrics
can be useful as indicators of software quality and
what is the correlation between design and code cou-
pling metrics. The tool is based on empirical knowl-
edge of historical data.
(Zhou and Leung, 2006) discussed about the
severity impact of the fault, based on object-oriented
metrics values. They concluded that low metrics val-
ues could be more predictable than high metrics val-
ues. Another conclusion is that CBO, WMC, RFC
and LCOM are statistically significant and DIT is not
significant.
(Singh and Kahlon, 2012) analyzed values of met-
rics and how they can predict faulty classes identified
as bad smells in open source software. They con-
cluded that some metrics can be predicted with high
accuracy, helping to increase software maintainabil-
ity, testability and refactoring. They created a met-
ric model to detect “bad smells” in softwares and
validated the model by investigating Mozilla Firefox
(Versions 2.0 and 3.0) (Singh and Kahlon, 2011).
(Olague et al., 2007) compared and validated three
object-oriented metrics suits. They concluded that
CK metrics are better and more reliable to predict
fault-proneness, in special WMC and RFC, than the
others proposed in the article. Another conclusion is
that metrics are not effective in early phases of soft-
ware development. Therefore, when development is
agile or high iterative, metrics may not be effective.
(Janes et al., 2006) analyzed the relation between
object-oriented metrics and systems faults, focused
on real-time systems in the telecommunication do-
main. They concluded that the communication be-
tween classes (i.e, RFC) increases the probability of
defects to appear. The more the classes are coupled,
higher will be the chance of defects to appear.
(Gyimothy et al., 2005) analyzed fault predic-
tion in Open Source Software, among seven versions
of Mozilla (1.0 to 1.6). They conclude that some
metrics, as NOC, can not be used for some fault-
proneness predictions. This conclusion is similar to
(Zhou and Leung, 2006; Moser et al., 2006; Shatnawi,
2010) and others but different from (Benestad et al.,
2006; Nair and Selvarani, 2011). This variation of re-
sults indicates that the NOC metric needs additional
studies to show if it can predict fault-proneness or it
can variate according to projects.
(Kakarontzas et al., 2012) propose a new metric to
facilitate white-box reuse. This new metric is based
on CK metrics. They concluded that coupling met-
rics are very significant to limiting white-box reuse of
classes. LCOM is the least influential factor and NOC
has not a good use. In normal-scale projects, DIT has
a good influential too but in large projects DIT is re-
placed by RFC.
Thus, analyzing the anomalies suggested by hy-
potheses H1, some values matched, others did not.
The values of each metric is discussed in the follow-
ing. In addition to the suggested values for anomaly,
an additional analysis of the usefulness of each met-
ric is presented. Table 5 summarizes this analysis.
The result of this analysis can guide future activities
in software engineering.
DIT – DIT has the value 3 for softwares developed
using Java and 4 for softwares developed using C++.
This value is very close to (Nair and Selvarani, 2011)
(greater than 5) and (Benestad et al., 2006) (greater
than 3). However, high values of DIT may not be sig-
nificant in some cases as described in Table 5. Only
20% of articles discussed ((Gyimothy et al., 2005;
Benestad et al., 2006; Nair and Selvarani, 2011)) in
this paper uses DIT with success to predict proneness
error. This conclusion need to be improved to check
if this metric can be useful. However, the DIT metric
is an important way to analyze the degree of special-
ization of a class, at least in theory.
NOC – NOC has value 8. It does not match with
any other works, such as (Nair and Selvarani, 2011)
(greater than 5), and (Benestad et al., 2006) (greater
than 3). Within the C++ metrics values, the value is 5,
being very close to the studies. One important issue
that could be checked is that as C++ provides multi-
ple inheritance, the NOC value should be higher than
Java, which does not natively support multiple inher-
itance. This issue can be explained given the number
of softwares analyzed during the research. We found
that 33% of studies concluded that NOC can be use-
ful. In (Zhou and Leung, 2006), it was observed that
DetectionofSoftwareAnomaliesUsingObject-orientedMetrics
245

NOC is inversely proportional to error proneness. In
most of the cases, the metric NOC is not useful. This
conclusion is similar to the one related on DIT. Hier-
archical metrics can support some tasks such as pro-
gram comprehension but in some activities as predict
proneness error they are useless.
CBO – The CBO has value 18 for softwares de-
veloped using Java and 18 for softwares developed
using C++. These values are very close to the ones
in (Nair and Selvarani, 2011), in which classes that
have 20-24 CBO have 78%- 98% probability of con-
taining defects. In (Shatnawi, 2010), CBO has value
9. Independently of programming language and their
specific features, as multiply inheritance, CBO has
similar values. The CBO is considered the most rel-
evant metric to perform activities as proneness error,
analyze impact of refactoring on metrics or facility
of white-box reuse. In 100% of the studies, CBO is
useful. It is a valuable information that shows the im-
portance of coupling metrics in software.
RFC – The RFC has the value 46 for softwares
developed in Java and 112 for C++. (Shatnawi, 2010)
found the value 40 as outlier to RFC and it has a sim-
ilar value to our work. (Nair and Selvarani, 2011)
found a defect proneness of (82%) when RFC is
greater than 160. This value is very different from
our hypothesis. However, even as CBO, softwares de-
veloped in Java and C++ have similar values. About
the usefulness of this metric, RFC is useful as well as
CBO. All of the studies that use RFC obtained good
results to realize their activities.
WMC – The WMC has the value 329 to softwares
developed in Java and 106 to softwares developed in
C++. These values are higher than the ones presented
in (Benestad et al., 2006) (greater than 23) and (Shat-
nawi, 2010) (greater than 29). One reason for this
could be the type selected to measure WMC. Accord-
ing to (Chidamber and Kemerer, 1994), the WMC can
be measured in different forms. As well as RFC and
CBO, WMC is considered useful in all studies.
LCOM – The LCOM has the value 120 for soft-
wares developedin Java and 1521 in C++. There were
no works to compare the result of this metrics with
any other works that used similar statistics method.
(Gyimothy et al., 2005) conclude that LCOM has
good correctness, but its completeness value is low.
Some works as (Kakarontzas et al., 2012; Moser et al.,
2006; Johari and Kaur, 2012; Janes et al., 2006) con-
cluded that LCOM is not effective to realize some ac-
tivities as proneness error, impact on refactoring or
facilitate white-box reuse.
Table 5: Representation of metrics in objectives of studies.
Article CBO DIT LCOM NOC RFC WMC
(Subramanyam and Krishnan, 2003) + o +
(Gyimothy et al., 2005) + + + o + +
(Benestad et al., 2006) + + +
(Zhou and Leung, 2006) + o + - + +
(Janes et al., 2006) + o +
(Moser et al., 2006) + o o o + +
(Stroggylos and Spinellis, 2007) + o + o + +
(Olague et al., 2007) + o + o + +
(Shatnawi and Li, 2008) + o o + +
(English et al., 2009) + o o +
(Shatnawi, 2010) + o o + +
(Nair and Selvarani, 2011) + + + + + +
(Singh and Kahlon, 2011) + o + +
(Johari and Kaur, 2012) + o o o + +
(Abuasad and Alsmadi, 2012) + + +
(Singh and Kahlon, 2012) + o + +
Analyzing the Effectiveness of Metrics
Table 5 depicts the articles studied and representation
of metrics towards the aim of discovering the error-
prone classes, analyze impact of refactoring on met-
rics and facility of white-box reuse. The following
caption exemplifies table items:
+ Denotes that metric is significant according to
the objective of the article;
- Denotes that metric is significant but inversely
proportional to the objective of the article;
o Denotes that metric is not significant to the ob-
jective of the article;
blank Denotes that metric was not studied.
It is worth mentioning that the use of data from
other software metrics is a nontrivial task. Accord-
ing to (Kocaguneli et al., 2010), there are many fac-
tors that hampers the analysis of softwares based on
metrics of another softwares. Features as team de-
velopment experience, available time and cost af-
fects the metric values (Subramanyam and Krishnan,
2003). Even the geographic localization of develop
team have an affect on analysis (Kocaguneli et al.,
2010).
(Menzies et al., 2011) found that the use of global
data for effort estimation and prediction defect may
ICEIS2014-16thInternationalConferenceonEnterpriseInformationSystems
246

be ineffective in most cases. Often, the use of local
data on software is more efficient to perform such ac-
tivities.
Thus, finding thresholds for metrics software is
a complex and difficult task. On the other hand, it
should be noted that even with all the features (team
experience, location, development methodology, pro-
gramming language, architecture, time and cost) that
affect the construction of software, some studies indi-
cate values very close to detect faults or error prone-
ness.
5 CONCLUSIONS AND FURTHER
WORKS
Proposing values to software anomalies is an arduous
task, especially when results are trying to be the most
comprehensive possible. As described in this article,
some proposed values for anomalies differ from other
publications. This is understandable, since one of the
goals of this article is to be broad, helping any kind
of projects. Moreover, the results of this paper can be
used to guide software development, helping to man-
age the development and preventing future problems.
The relationship between software metrics and
probability of software errors has been the subject of
study of many authors. This article contributes by
suggesting values for software metrics that, accord-
ing to the literature, can present high probabilities of
failures. For this, the CK metrics were considered.
The coupling metrics values (CBO and RFC) are
greater in C++ than in Java. In this case, multiple in-
heritance of C++ and single inheritance of Java has
impact in coupling metrics. Other interesting conclu-
sion is coupling metrics are used with success in oth-
ers studies to detect error proneness.
Another contribution of this paper is to show that
mean and standard deviations can be used to set up
values of metrics that represent anomalies in soft-
ware development. These anomalies can be mon-
itored among the releases of software and identify
some problems.
Furthermore, coupling (CBO, RFC) and complex-
ity (WMC) metrics have been successfully used to
predict error proneness. In studies that used CBO and
RFC metrics as a measure for analysis, all have suc-
ceeded. In other words, the coupling between classes
of a system can indicate various features of software
such as proneness error or in analyzing the impact of
refactoring. Hierarchical metrics were not very effi-
cient and, therefore, need more studies to verify in
which environments they are effective. Although CK
metrics are widely used to measure software, choos-
ing the right metrics in certain situations is essential.
Future works will focus on verifying if the val-
ues obtained in this article may indicate classes with
high probabilities of defects. Another activity is to
separate, according to the type of software (libraries,
interfaces, domain) and check the different values of
metrics that could be called “anomalies”. Further re-
search is needed in order to validate this research and
check if values suggested in this paper are applicable
in different environment of softwares as commercial,
industrial or academical, and how these results can be
useful to improve software development.
REFERENCES
Abuasad, A. and Alsmadi, I. (2012). Evaluating the Corre-
lation between Software Defect and Design Coupling
Metrics. In International Conference on Computer,
Information and Telecommunication Systems (CITS),
pages 1–5.
Bar-Yam, Y. (2003). When Systems Engineering Fails - To-
ward Complex Systems Engineering. In Proceedings
of the International Conference on Systems, Man &
Cybernetics, volume 2, pages 2012–2028.
Benestad, H., Anda, B., and Arisholm, E. (2006). Assess-
ing Software Product Maintainability Based on Class-
Level Structural Measures. In Product-Focused Soft-
ware Process Improvement, volume 4034 of Lecture
Notes in Computer Science, pages 94–111. Springer.
Berry, D. M. (2004). The Inevitable Pain of Software Devel-
opment: Why There Is No Silver Bullet. In Radical
Innovations of Software and Systems Engineering in
the Future, Lecture Notes in Computer Science, pages
50–74.
Boehm, B. W. (2006). A View of 20th and 21st Century
Software Engineering. In ICSE ’06: Proceedings of
the 28th International Conference on Software Engi-
neering, pages 12–29.
Charette, R. N. (2005). Why Software Fails. IEEE Spec-
trum,, 42(9):42–49.
Chidamber, S. R. and Kemerer, C. F. (1994). A Metrics
Suite for Object Oriented Design. IEEE Transactions
on Software Engineering, 20(6):476–493.
Dallal, J. A. (2012). Constructing Models for Predict-
ing Extract Subclass Refactoring Opportunities using
Object-Oriented Quality Metrics. Information and
Software Technology, 54(10):1125–1141.
English, M., Exton, C., Rigon, I., Brendan, and Cleary
(2009). Fault Detection and Prediction in an Open-
source Software Project. In Proceedings of the 5th
International Conference on Predictor Models in Soft-
ware Engineering, PROMISE ’09, pages 17:1–17:11,
New York, NY, USA. ACM.
Fenton, N. E. and Pfleeger, S. L. (1998). Software Metrics:
A Rigorous and Practical Approach. PWS Publishing
Co., Boston, MA, USA, 2nd edition.
DetectionofSoftwareAnomaliesUsingObject-orientedMetrics
247

Glass, R. L. (1999). The Realities of Software Technology
Payoffs. Communications of the ACM,, 42(2):74–79.
Gyimothy, T., Ferenc, R., and Siket, I. (2005). Empir-
ical Validation of Object-Oriented Metrics on Open
Source Software for Fault Prediction. IEEE Transac-
tions on Software Engineering, 31(10):897–910.
Harrison, R., Counsell, S., and Nithi, R. V. (1998). An
Investigation into the Applicability and Validity of
Object-Oriented Design Metrics. Empirical Software
Engineering, 3(3):255–273.
Huck, S. W. (2012). Reading Statistics and Research. Pear-
son, Boston, MA, USA.
Janes, A., Scotto, M., Pedrycz, W., Russo, B., Stefanovic,
M., and Succi, G. (2006). Identification of Defect-
Prone Classes in Telecommunication Software Sys-
tems Using Design Metrics. Information Sciences,
176(24):3711 – 3734.
Johari, K. and Kaur, A. (2012). Validation of Object Ori-
ented Metrics Using Open Source Software System:
An Empirical Study. SIGSOFT Software Engineering
Notes, 37(1):1–4.
Kakarontzas, G., Constantinou, E., Ampatzoglou, A., and
Stamelos, I. (2012). Layer assessment of object-
oriented software: A metric facilitating white-box
reuse. Journal of Systems and Software, 86:349–366.
Kitchenham, B. (2010). Whats up with Software Metrics?
A Preliminary Mapping Study. Journal of Systems
and Software, 83(1):37–51.
Kocaguneli, E., Gay, G., Menzies, T., Yang, Y., and Ke-
ung, J. W. (2010). When to Use Data from Other
Projects for Effort Estimation. In Proceedings of the
IEEE/ACM International Conference on Automated
Software Engineering, ASE ’10, pages 321–324, New
York, NY, USA. ACM.
Lanza, M. (2003). CodeCrawler - Lessons Learned in
Building a Software Visualization Tool. In In Pro-
ceedings of CSMR 2003, pages 409–418. IEEE Press.
Lanza, M. and Marinescu, R. (2006). Object Oriented Met-
rics in Practice. Springer, Berlin.
Lorenz, M. and Kidd, J. (1994). Object-Oriented Software
Metrics: A Practical Guide. Prentice-Hall, Inc., Up-
per Saddle River, NJ, USA.
Menzies, T., Butcher, A., Marcus, A., Zimmermann, T.,
and Cok, D. (2011). Local vs. Global Models for Ef-
fort Estimation and Defect Prediction. In Proceedings
of the 2011 26th IEEE/ACM International Conference
on Automated Software Engineering, ASE ’11, pages
343–351, Washington, DC, USA. IEEE Computer So-
ciety.
Moser, R., Sillitti, A., Abrahamsson, P., and Succi, G.
(2006). Does Refactoring Improve Reusability? In
Morisio, M., editor, Reuse of Off-the-Shelf Compo-
nents, volume 4039 of Lecture Notes in Computer Sci-
ence, pages 287–297. Springer Berlin Heidelberg.
Nair, T. G. and Selvarani, R. (2011). Defect Proneness
Estimation and Feedback Approach for Software De-
sign Quality Improvement. Information and Software
Technology, 54(3):274–285.
Olague, H., Etzkorn, L., Gholston, S., and Quattlebaum,
S. (2007). Empirical Validation of Three Software
Metrics Suites to Predict Fault-Proneness of Object-
Oriented Classes Developed Using Highly Iterative or
Agile Software Development Processes. IEEE Trans-
actions on Software Engineering, 33(6):402–419.
Olbrich, S., Cruzes, D. S., Basili, V., and Zazworka, N.
(2009). The Evolution and Impact of Code Smells:
A Case Study of Two Open Source Systems. In Pro-
ceedings of the 2009 3rd International Symposium on
Empirical Software Engineering and Measurement,
ESEM ’09, pages 390–400.
Radjenovi, D., Heriko, M., Torkar, R., and Zivkovic, A.
(2013). Software Fault Prediction Metrics: A Sys-
tematic Literature Review. Information and Software
Technology, 55(8):1397–1418.
Shatnawi, R. (2010). A quantitative investigation of the ac-
ceptable risk levels of object-oriented metrics in open-
source systems. IEEE Transactions on Software En-
gineering, 36(2):216–225.
Shatnawi, R. and Li, W. (2008). The Effectiveness of Soft-
ware Metrics in Identifying Error-Prone Classes in
Post-Release Software Evolution Process. Journal of
Systems and Software, 81(11):1868–1882.
Singh, S. and Kahlon, K. (2011). Effectiveness of Encapsu-
lation and Object-Oriented Metrics to Refactor Code
and Identify Error Prone Classes using Bad Smells.
SIGSOFT Software Engineering Notes, 36(5):1–10.
Singh, S. and Kahlon, K. S. (2012). Effectiveness of Refac-
toring Metrics Model to Identify Smelly and Error
Prone Classes in Open Source Software. SIGSOFT
Software Engineering Notes, 37(2):1–11.
Stroggylos, K. and Spinellis, D. (2007). Refactoring – Does
It Improve Software Quality? In Fifth International
Workshop on Software Quality, 2007. WoSQ’07.
Subramanyam, R. and Krishnan, M. S. (2003). Empirical
Analysis of CK Metrics for Object-Oriented Design
Complexity: Implications for Software Defects. IEEE
Transactions on Software Engineering, 29(4):297–
310.
Wettel, R. and Lanza, M. (2007). Visualizing Software Sys-
tems as Cities. In 4th IEEE International Workshop on
Visualizing Software for Understanding and Analysis,
2007. VISSOFT 2007., pages 92–99.
Wirth, N. (2008). A Brief History of Software Engineering.
IEEE Annals of the History of Computing,, 30(3):32–
39.
Zhou, Y. and Leung, H. (2006). Empirical Analysis of
Object-Oriented Design Metrics for Predicting High
and Low Severity Faults. IEEE Transactions on Soft-
ware Engineering, 32(10):771–789.
Zhoua, Y., Xua, B., and Leung, H. (2010). On the Ability
of Complexity Metrics to Predict Fault-Prone Classes
in Object-Oriented Systems. Journal of Systems and
Software, 83(4):660–674.
ICEIS2014-16thInternationalConferenceonEnterpriseInformationSystems
248
