
A Collaborative Platform for Software Evolution Visualization
Leveraging Meta-model Driven Measurements with Big Data Strengths
João Carlos Caldeira
ISCTE - University Institute of Lisbon, Avenida das Forças Armadas, Lisbon, Portugal
1 STAGE OF THE RESEARCH
This document describes a preliminary PhD thesis
proposal that will hopefully lead to a collaborative
framework and platform for Software Evolution
Visualization (SEV).
Currently, most of the time is being dedicated to
review related works and deeply analysing gaps for
further research.
We sustain our decision to follow this research area
by evaluating recent works which have shown that
there is a need for multi-metrics, multi-perspective
and multi-strategy approaches to SEV as
summarized by (Novais, et al., 2013). The authors
identify some research niches such as missing case
studies, tool comparisons and experiments with the
aim of predicting defects, improve software quality
and development processes. Another missing aspect
relates to the presentation of real scalable
visualization and dependency impact among
projects. It is also recognized that there is little
formal validation and collaboration in this area, most
likely because the data is scarce, dispersed and not
widely shared by each individual researcher. The
lack of empirical studies is a real constraint to allow
the community to perform benchmarking and
compare methodologies and results. In other words,
the SEV community has failed to provide sound
evidences, through empirical validation studies, of
the impact of using the technology they created. In
fact SEV research deliverables provide visual
insights that are expected to help understand
complex software artefacts and ultimately contribute
to improve their quality and the maintenance process
itself. Failing to provide adequate justification, may
explain the reduced adoption of SEV tools in
industry as evidenced by a small percentage of job
offerings in industry related to software
visualization, when compared to software analysis,
and software metrics as represented in Table 1.
Table 1: Job offerings per area.
Software
metrics
Software
visualization
Software
analysis
www.dice.com
2085 427 13217
www.monster.com
1000+ 432 1000+
www.careerbuilder.com
4349 441 22846
2 OUTLINE OF OBJECTIVES
The goals of our research consist on proposing a
structured approach to (i) collect data from public
domain software repositories, (ii) extract complexity
and quality metrics using a meta-model driven
measurement approach (M2DM), (iii) store and
eventually transform those metrics by adopting big
data technologies for scalability sake, (iv) visualize
software evolution, along the corresponding metrics,
in a collaborative fashion, allowing to identify
patterns and trends. The aforementioned approach is
expected to scaffold exploratory activities on top of
the collected data, allowing the community to do
benchmarking, evaluate software engineering best
practices and assess software engineering research
questions by means of empirical studies (Goulão, et
al., 2012).
While (Sakamoto, et al., 2012) present a service
oriented framework to visualize software evolution
using Google charts and (Gonzalez-Torres, et al.,
2011) develops a tool for providing insights into
software evolution based on Eclipse, our work will
adopt some concepts from both works but will be
more oriented to understanding metric relationships
and impacts between components over time, and
also on producing consolidated predictions,
presumably using time series analysis. In addition,
we expect to explore an agile time navigation
paradigm based on the non-seasonal delivery of
software versions. Besides, we plan to use rendering
techniques to combine sequential static snapshots to
produce dynamic software visualization.
12
Carlos Caldeira J..
A Collaborative Platform for Software Evolution Visualization - Leveraging Meta-model Driven Measurements with Big Data Strengths.
Copyright
c
2014 SCITEPRESS (Science and Technology Publications, Lda.)

3 RESEARCH PROBLEM
There are several strategies, approaches and ways to
visualize software evolution (Alam & Dugerdil, s.d.)
(Lanza & Ducasse, 2002) (Balzer, et al., 2005)
(Beyer & Hassan, 2006) (Burch, et al., 2005). Most
of the methods used to achieve this are based on
proprietary applications and/or plugins developed
mainly for Eclipse. Some plugins render data related
with source code management activities like check-
ins, check-outs and conflict detections, whilst some
others plot information related with source code
metrics such as number of lines of code, number of
classes and interfaces, complexity and quality
related metrics, amongst others (Hanakawa, 2007).
Although Eclipse is a very flexible and powerful
IDE, and great achievements have been obtained
with it to progress SEV techniques, most of the
developments and results are limited to a standalone
environment with lack of collaboration between
community peers. Data sharing and teamwork is
indeed needed for results comparison, software
quality analysis and finally to trigger improvement
processes. Like in any other improvement procedure
a critical resource required is to have data on which
to apply basic statistics methods, operations research
algorithms or simulation techniques.
When we leverage the statistics domain, a huge
challenge faced by researchers is the lack of enough
and/or accurate data in order to perform the desired
experiences and related studies. This is also true in
the experimental software engineering and mainly in
SEV where data collection is critical for a
quantitative and qualitative analysis to produce valid
results. Meanwhile, development teams and
individual programmers aim to have near real-time
understanding of software quality metrics about the
progress of their projects (Holten, et al., s.d.), (Lanza
& Ducasse, 2002).
Based on this, the main research problems in
software visualization are, (i) lack of clear
identification of metrics and uncertainty about the
format on how to store the information, (ii) no
public domain repository exists on where to easily
store, represent and share the metrics and, (iii) there
are some tools in the community, but in their
essence, they are standalone components with lack
of integration, collaboration and visualization
functionality, which makes it hard to perform
exhaustive analysis related with the software
development lifecycle.
Some of the existing limitations cause
tremendous constraints in using SEV as an
integrated approach to combine quantitative source
code analysis (SCA), source code management
(SCM) activities and bug tracking (BT).
4 STATE OF THE ART
This section describes the important topics to be
addressed within the whole research and also the
gaps that this research can fulfil within SEV.
4.1 Software Engineering
Software engineering (SE) is the application of a
systematic, disciplined, quantifiable approach to the
design, development, operation, and maintenance of
software, and the study of these approaches; that is,
the application of engineering to software.
4.1.1 Software Evolution
Software evolution sometimes also identified as
maintenance refers to maintaining software
components by finding and fixing defects and
introducing new functionalities to an existing
system. The perception is that more time is spent in
bug fixing rather than in adding new features. This
turns out to be incorrect as most of reported defects
are related with the need for functionality
enhancements. This points us to the fact that
software development is an evolutionary process
rather than a contained and well defined set of
components and functionalities. As all evolutionary
systems, the complexity and maintainability efforts
increase over time and the need to understand
software through the use of visual resources is of
much help mainly when the development is made in
a collaborative way, by diverse people in disjointed
geographies. Therefore, visualizing software
evolution related data in a project context and timely
oriented is a fundamental goal for software
development teams and individuals.
4.1.2 Visualization
In the context of software development, software
visualization is used to understand the components
being develop through the use of visual resources.
There are several proposals in the community to
address this need and the majority of them render
software related information either in specific
applications or as views mainly within the Eclipse
platform. Our goal is to decouple the visualization
layer from the IDE platform but allowing a cross
reference link between both. This approach gives
ACollaborativePlatformforSoftwareEvolutionVisualization-LeveragingMeta-modelDrivenMeasurementswithBig
DataStrengths
13
more flexibility to the developers as they are not
dependent of one specific environment to be able to
visualize software evolution.
4.1.3 Meta-model Driven Measurement
Several approaches have been used as the basis for
the research on software measurement. This has
resulted in the design of measurement techniques
and software metrics to assess software quality. The
term meta-model driven measurement (M2DM) was
initially described by (Abreu, 2001) and is used by
applying meta-models to detail both the components
to be measured and the metrics by which they are
measured with.
Several Eclipse plugins existed but they were not
leveraging the MD2M approach. Recently (Coimbra,
2013) made available a plugin to mine software
metrics using a M2DM concept and we plan to use it
to perform the initial extraction of code related
metrics.
4.1.4 Source Code Management
Another important source of data to SEV is code
repositories, mainly Git, SVN and Mercurial. These
repositories track the changes made by the
contributors to the projects they belong to. Those
changes are related with packages, classes, files and
code. It includes the act of adding new files or
folders, modifying existing ones and the removal of
others. These activities might alter tremendously the
architecture of a software project during its lifecycle.
Information related with SCM is intended to be used
as a source of data for the platform and for further
analysis.
4.2 Big Data
The term Big Data is currently extremely popular
within the IT market (Simmhan, et al., 2013). It is
also becoming a hot topic within the academic
institutions (Liu, et al., 2010). It refers to the ability
of collecting, storing, analysing and visualizing large
amounts of data. Usually this data is so large and
sometimes so complex that traditional tools and data
processing applications are no longer able to process
it within a tolerable elapsed time. It is common to
accept a system as a candidate for a big data use case
when it falls under these three basic dimensions
(3Vs): volume, variety and velocity. They
correspond to the amount of data being captured, the
number of different types of data and to the speed it
has to be processed in order to provide relevant and
timely results to the stakeholders. Usually this data
is a relevant factor when to perform analytical
functions within a specific area of business (Zhang
& Xie, 2012), (Zhang, et al., 2012). We plan to use
big data technologies, for collecting data and as a
repository for our platform as it does a perfect match
to address the requirements spawned by software
evolution visualization. It also provides the
scalability mechanisms that the collection of large
volumes of data might require in a short to medium
term.
4.3 The Platform
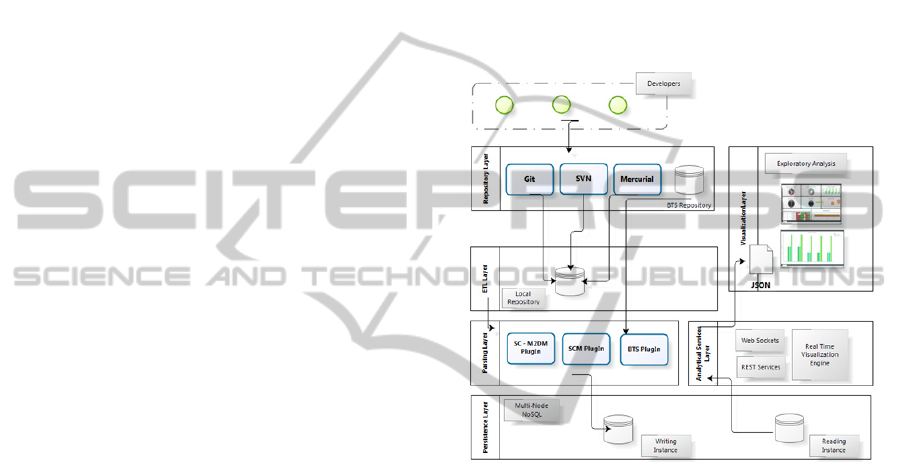
Figure 1: Collaborative SEV Platform.
The platform will divided in layers. Each layer will
have its own tasks and gateway points. The ETL
layer will be responsible for all the extraction data
from software repositories. The Parsing Layer will
be the point where metrics generation and extraction
take place. The Persistence Layer will store and
archive all the data produced. The Analytical
Service Layer will deal with all the services related
with analytical functions and the disposal of the data
for further consume by the Visualization Layer.
5 METHODOLOGY
The methodology comprises three main phases
aligned with the research goals which are: (i) the
setup phase for the initial research and global
planning, (ii) the execution phase for the
instantiation of the platform we want to develop and
to produce and publish the first results, (iii) the
validation phase where we plan to instantiate our
platform with data and perform exploratory analysis.
MODELSWARD2014-DoctoralConsortium
14

5.1 Setup
In this phase we expect to identify the problem, the
contributions we may add and the analysis of the
related work. Additionally it is the phase where we
setup our calendar and define the milestones in the
research.
5.2 Execution
It is related with the development of the platform
and the first experiments and hypothesis testing. As
we plan to have feedback early in the process from
international peers we will try to publish the first
results in the most relevant conferences, journals and
papers.
5.3 Validation
This is when we plan to perform exhaustive
hypothesis testing and start to extract some
conclusions that might help the software
maintenance process and software quality in general.
It is also the moment when we start to consolidate
all the knowledge and produce the final PhD
dissertation.
6 EXPECTED OUTCOME
The main goal is definitely to contribute to the
process of understanding how the software evolves
during its lifecycle and how the quality and/or
complexity is affected (or not) by all the changes
being made by the contributors. At the end of this
work software development teams and the academic
community should expect to have a common
platform for software evolution visualization. This
platform is intended to have near real time
integration with the most used software repositories
like: Git, SVN and Mercurial in order to extract the
metrics and metadata about code changes. Due to the
fact that Eclipse is one of the most used IDEs and
that Eclipse Orion is a recent platform for Cloud
based development, our goal is also to have plugins
for these environments. Using them, developers and
team managers will be able, in real time, to commit
their code changes to the repository and to analyse
software metrics and facts of their projects, compare
them with some other projects and even investigate
within the development groups the individuals who
are more active or build better quality software. For
the platform to be really useful, it requires to store
enormous amounts of data, which, once collected
and stored can then be used for pattern searching,
trend analysis, metric correlation and finally to build
prediction models and what-if scenarios.
6.1 Benefits
Each community will extract their own benefits
based on their interests, inputs and analysis
performed in the platform. Based on this
assumption, it’s important to highlight the potential
gains obtained by each of them.
6.1.1 Software Industry
To be able to link software quality metrics with
software changes and incidents, to correlate them, to
understand their impact, and at the same time to
assure near real time visualization of software
complexity which can be of great help in allocating
the right resources to specific activities.
6.1.2 Software Engineering Research
Community
Perform benchmark studies within a specific group
of students or compare results within different
classes. One may not exclude the possibility to
analyse and compare results between different
institutions and geographical zones, predict
behaviours and simulate scenarios.
6.1.3 Individual Developers
Improve development skills and adopt best practices
by keeping real time track of their development
performance and compare it with the community
peers.
REFERENCES
Abreu, F. B., 2001. Using OCL to formalize object
oriented metrics definitions, Lisbon: Technical Report
ES007/2001.
Alam, S. & Dugerdil, P., s.d. EvoSpaces Visualization
Tool: Exploring Software Architecture in 3D, Geneva,
Switzerland: s.n.
Bacchelli, A., Rigotti, F., Hattori, L. & Lanza, M., s.d.
Manhattan— 3D City Visualizations in Eclipse,
Switzerland: University of Lugano.
Balzer, M., Deussen, O. & Lewerentz, C., 2005. Voronoi
Treemaps for the Visualization of Software Metrics,
s.l.: s.n.
ACollaborativePlatformforSoftwareEvolutionVisualization-LeveragingMeta-modelDrivenMeasurementswithBig
DataStrengths
15

Beyer, D. & Hassan, A. E., 2006. Animated Visualization
of Software History using Evolution Storyboards. s.l.,
IEEE.
Beyer, D. & Hassan, A. E., 2006. Evolution Storyboards:
Visualization of Software Structure Dynamics. s.l.,
IEEE.
Breivold, H. P., Crnkovic, I. & Larsson, M., 2011. A
systematic review of software architecture evolution
research. Information and Software Technology.
Burch, M., Diehl, S. & WeiB3gerber, P., 2005. EPOSee -
A Tool For Visualizing Software Evolution,
Eichstatt,Germany: s.n.
Coimbra, P. J., 2013. An Eclipse Plug-in for Metamodel
Driven Measurement, Lisbon: ISCTE-IUL.
D’Ambros, M., Lanza, M. & Lungu, M., 2006. The
Evolution Radar: Visualizing Integrated Logical
Coupling Information. Shanghai, China, ACM.
Erra, U., Scanniello, G. & Capece, N., 2012. Visualizing
the Evolution of Software Systems using the Forest
Metaphor. s.l., s.n.
Gonzalez-Torres, A. et al., 2011. Maleku: an evolutionary
visual software analytics tool for providing insights
into software evolution. Williamsburg VA, USA,
IEEE.
Goulão, M., Fonte, N., Wermelinger, M. & Abreu, F. B.
e., 2012. Software Evolution Prediction using Sea-
sonal Time Analysis: A Comparative Study. s.l., s.n.
Hanakawa, N., 2007. Visualization for software evolution
based on logical coupling and module coupling. s.l.,
IEEE.
Holten, D., Vliegen, R. & Wijk, J. J. v., s.d. Visualization
of Software Metrics using Computer Graphics
Techniques, Eindhoven, The Netherlands: s.n.
Holt, R. & Pak, J. Y., 1996. GASE: Visualizing Software
Evolution-in-the-Large, Toronto, Canada: s.n.
Hong, Q., Kim, S., Cheung, S. & Bird, C., 2011.
Understanding a Developer Social Network and its
Evolution. s.l., IEEE.
Langelier, G., Sahraoui, H. & Poulin, P., 2008. Exploring
the Evolution of Software Quality with Animated
Visualization. Montréal, Canada, IEEE.
Lanza, M. et al., 2013. Manhattan: Supporting Real-Time
Visual Team Activity Awareness. San Francisco, USA,
IEEE.
Lanza, M. & Ducasse, S., 2002. Understanding software
evolution using a Combination of Software
Visualization and Software Metrics, Berne,
Switzerland: s.n.
Lanza, M., Gall, H. & Dugerdil, P., 2009. EvoSpaces:
Multi-dimensional Navigation Spaces for Software
Evolution. s.l., IEEE.
Liu, G., Zhang, M. & Yan, F., 2010. Large-Scale Social
Network Analysis based on MapReduce. s.l., IEEE.
Novais, R. L., 2013.
Visualizando Evolução de Software
Em Detalhes, Salvador: s.n.
Novais, R. L. et al., 2011. An Interactive Differential and
Temporal Approach to Visually Analyze Software
Evolution, s.l.: IEEE.
Novais, R. et al., 2012. On the Proactive and Interactive
Visualization for Feature Evolution Comprehension:
An Industrial Investigation. Zurich, Switzerland, s.n.
Pérez, J., Deshayes, R., Goeminne, M. & Mens, T., 2012.
SECONDA: Software Ecosystem Analysis Dashboard.
s.l., IEEE.
Renato Lima Novais, A. T. T. S. M. M. N. Z., 2013.
Software evolution visualization: A systematic
mapping study. Information and Software Technology,
31 May.
Ripley, R. M., Sarma, A. & Hoek, A. v. d., s.d. A
Visualization for Software Project Awareness and
Evolution, Irvine, CA 92697-3425 USA: Donald Bren
School of Information and Computer Sciences.
Sakamoto, Y., Matsumoto, S. & Nakamura, M., 2012.
Integrating Service Oriented MSR Framework and
Google Chart Tools for Visualizing Software
Evolution. s.l., IEEE.
Servant, F. & Jones, J. A., s.d. Chronos: Visualizing Slices
of Source-Code History, Irvine, USA: s.n.
Shollo, A. & Pandazo, K., 2008. Improving presentations
of software metrics indicators using visualization
techniques, Göteborg, Sweden: s.n.
Simmhan, Y. et al., 2013. Cloud-based Software Platform
For Big Data Analytics In Smart Grids. s.l., IEEE.
Souza, R., Silva, B., Mendes, T. & Mendonça, M., s.d.
SkyscrapAR: An Augmented Reality Visualization for
Software Evolution. s.l., s.n.
Sun, X., Gao, B., Fan, L. & An, W., 2012. s.l., IEEE.
Ulges, A., 2005. Visualizing Software Evolution,
Kaiserslautern: s.n.
Vasa, R., 2010. Growth and Change Dynamics in Open
Source Software Systems, Melbourne, Australia: s.n.
Wu, J., Holt, R. C. & Hassan, A. E., 2004. Exploring
Software Evolution Using Spectrographs, s.l.: s.n.
Zhang, D., 2012. Software Analytics in Practice –
Approaches and Experiences. Zurich, Switzerland,
IEEE.
Zhang, D., Dang, Y. & Han, S., 2012. Teaching and
Training for Software Analytics. s.l., IEEE.
Zhang, D. & Xie, T., 2012. Software Analytics in
Practice:Mini Tutorial. Zurich, Switzerland, IEEE.
MODELSWARD2014-DoctoralConsortium
16
